This website uses cookies to ensure you get the best experience on our website.


- Table of Contents
Plan chromogenic ACADL IHC in paraffin sections using the cytoplasmic mitochondrial pattern and thyroid glandular cells as a positive reference (HPA tissue IHC). Start with the catalog antibody’s 1:50–1:200 IHC dilution range (datasheet: A07206) and keep fixation consistent across sections (standard IHC practice).

Expected localisation, validated protocols, controls and antibodies — the at-a-glance facts below, then the full design guide.
| Expected localisation | Cytoplasmic mitochondrial pattern in tissue (HPA tissue IHC) | |
| Staining pattern | Thyroid glandular cells show a cytoplasmic mitochondrial pattern (HPA tissue IHC) | |
| Antigen retrieval | Citrate pH 6.0 HIER, 95–98 °C, 20 min (rule: cytoplasmic / membrane antigen) | |
| Positive control | Kidney+4 more · see all | |
| Negative control | Adipose tissue+4 more · see all |
| Fixation | Keep formalin fixation consistent across paraffin sections (standard IHC practice; not target-specific) | |
| Caveat | Staining and RNA expression have medium consistency (HPA tissue IHC) | |
| Regulation | Tissue-dependent; most abundant in thyroid (HPA tissue IHC) | |
| Isoform / epitope | No annotated isoforms; mature chain lacks residues 1–30 (UniProt) |
The catalog antibody’s IHC-P protocol is accompanied by two published ACADL IHC examples (PMC13081255; PMC7096519).
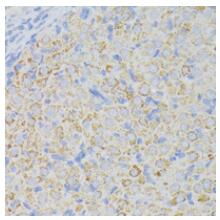
| Sample | FFPE rat ovary formalin fixed paraffin embedded tissue (datasheet A07206) |
| Fixation | Image formalin-fixed; duration unreported (datasheet A07206); verify before use. |
| Sectioning | 4–5 µm sections on charged slides (standard) |
| Deparaffinisation | Xylene, graded ethanol series to water (standard) |
| Antigen retrieval | Heat-induced epitope retrieval in citrate buffer, pH 6.0, 20 min at 95–98 °C (standard rule: cytoplasmic / membrane antigen) |
| Peroxidase block | 3% H2O2, 10 min, room temperature (standard) |
| Blocking | 10% normal serum of the secondary host, 30 min, room temperature (standard) |
| Primary antibody | Rabbit anti-ACADL, 1:50-1:200 (datasheet A07206) |
| Primary incubation | Overnight at 4 °C (standard) |
| Detection | HRP-polymer secondary, DAB chromogen 5–10 min (standard) |
| Counterstain | Hematoxylin, blue, dehydrate and mount (standard) |
| Expected result | ACADL-positive staining in collecting ducts of kidney (HPA tissue IHC: High). HPA tissue profile: Cytoplasmic expression with a mitochondrial pattern in several tissues, most abundant in thyroid gland. No signal in the no-primary control. |
ACADL is a mitochondrial matrix protein with no transmembrane segment (UniProt P28330 localization and topology). In paraffin-section IHC, expect cytoplasmic staining with a mitochondrial pattern, especially in thyroid glandular cells, lung alveolar type II cells, and kidney collecting ducts (HPA tissue IHC). HPA rates the tissue staining evidence Enhanced, while reporting medium consistency between antibody staining and RNA expression (HPA tissue IHC).
| Discrete, granular cytoplasmic staining in thyroid glandular cells, alveolar type II cells, or collecting ducts. | This fits the reported mitochondrial pattern and High staining in those cell populations (HPA tissue IHC). Score the identified cells and their cytoplasmic pattern, since intensity alone does not establish specificity (standard IHC practice). |
| Predominantly nuclear, cell-surface, or extracellular staining with little granular cytoplasmic signal. | Those compartments do not fit a mitochondrial matrix protein with no transmembrane segment (UniProt P28330 localization and topology). Check morphology, counterstain, and detection controls before interpreting such staining as ACADL (standard IHC practice). |
| Strong staining in adipocytes or esophageal squamous epithelial cells while expected positive cells are faint. | HPA reports ACADL as Not detected in those two cell populations (HPA tissue IHC). Investigate antibody cross-reactivity or endogenous detection activity; either can produce misleading chromogenic signal (standard IHC practice). |
| Uniform color across cells, stroma, and empty spaces, obscuring cellular detail. | A widespread deposit does not resemble HPA's cell-associated mitochondrial pattern (HPA tissue IHC). Assess background from primary antibody, detection reagents, and blocking with appropriate controls (standard IHC practice). |
| No convincing signal in thyroid glandular cells, alveolar type II cells, or collecting ducts. | These are reported High staining populations, so an all-negative run warrants investigation (HPA tissue IHC). Review tissue identity, section quality, retrieval, detection, and the IHC-validated antibody's instructions (standard IHC practice). |
| Subcellular location | ACADL resides in the mitochondrial matrix and has no transmembrane segment (UniProt P28330 localization and topology). Interpret cytoplasmic mitochondrial-pattern staining in identified cells; membrane outlines are inconsistent with that annotation (HPA tissue IHC; UniProt P28330 topology). |
| Cell-type distribution | HPA reports High staining in thyroid glandular cells, alveolar type II cells, and kidney collecting ducts, but Medium staining in hepatocytes (HPA tissue IHC). Compare the same cell types across sections rather than whole-tissue color (standard IHC practice). |
| Protein processing | UniProt annotates a mature ACADL chain spanning residues 31–430 (UniProt P28330 processing). The payload gives no antibody epitope, so it cannot establish whether processing changes this assay's staining (UniProt P28330 processing; supplied antibody data). |
| Evidence and antibody scope | HPA lists IHC validation as Enhanced for HPA011990, yet describes only medium consistency with RNA expression (HPA antibody validation; HPA tissue IHC). Treat the listed cell patterns as reference observations, and assess unexpected staining with controls (standard IHC practice). |
| Endogenous chromogen-generating activity | Endogenous activity can add color independently of primary-antibody binding, depending on the detection chemistry (standard IHC practice). A primary-omission and detection-control comparison can help separate that signal from the reported cell-associated pattern (standard IHC practice; HPA tissue IHC). |
| Situation | Likely cause | Next action |
|---|---|---|
| Known-positive thyroid, lung, or kidney cells show no stain. | A failed assay step or unsuitable section is possible; these cells are reported High by HPA (HPA tissue IHC; standard IHC practice). | Verify cell identity and section quality, then check retrieval, antibody application, and detection against the catalog antibody's IHC-P instructions (standard IHC practice). |
| Signal is weak but limited to expected cells. | HPA's High categories describe reported observations, not a guaranteed intensity in every run (HPA tissue IHC; standard IHC practice). | Compare a known-positive control in the same run and review detection and counterstain before assigning an absence score (standard IHC practice). |
| Nuclei or cell borders stain more strongly than cytoplasm. | That distribution conflicts with ACADL's mitochondrial matrix location and HPA's cytoplasmic mitochondrial pattern (UniProt P28330 localization; HPA tissue IHC). | Check cellular morphology, primary-omission controls, and detection controls; do not score the misplaced signal as specific without corroboration (standard IHC practice). |
| Adipocytes or esophageal squamous epithelial cells stain strongly. | HPA records ACADL as Not detected in those populations; cross-reactivity or endogenous detection activity is possible (HPA tissue IHC; standard IHC practice). | Compare with known-positive cells and primary-omission controls, then reassess antibody specificity and detection background (standard IHC practice). |
| Chromogen covers tissue and surrounding background. | Diffuse deposit can arise from assay background and obscures the expected cell-associated pattern (standard IHC practice; HPA tissue IHC). | Inspect primary-omission and detection controls, blocking, washing, and chromogen development before scoring cells (standard IHC practice). |
| Can an IF/ICC image confirm the IHC pattern? | HPA supplies no ACADL ICC-IF image or main subcellular location in this payload (HPA subcellular record). | Use UniProt's mitochondrial matrix annotation as the localization expectation; consult the separate IF/ICC guide for that application's design (UniProt P28330 localization; HPA subcellular record). |

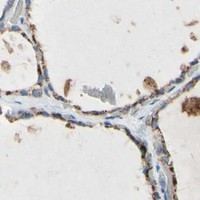


Comprehensive Human Protein Atlas IHC scoring per tissue (reliability: Enhanced — Medium consistency between antibody staining and RNA expression data.). Rows are taken directly from the HPA tissue chart — click any row's HPA link to view the source.
| Tissue | Cell type | Level | Evidence | Source |
|---|---|---|---|---|
| Kidney | Collecting ducts | High | Protein (IHC) | HPA → |
| Lung | Alveolar cells type II | High | Protein (IHC) | HPA → |
| Thyroid gland | Glandular cells | High | Protein (IHC) | HPA → |
| Gallbladder | Glandular cells | Medium | Protein (IHC) | HPA → |
| Liver | Hepatocytes | Medium | Protein (IHC) | HPA → |
| Tissue | Cell type | Level | Evidence | Source |
|---|---|---|---|---|
| Adipose tissue | Adipocytes | Not detected | Protein (IHC) | HPA → |
| Appendix | Glandular cells | Not detected | Protein (IHC) | HPA → |
| Bone marrow | Hematopoietic cells | Not detected | Protein (IHC) | HPA → |
| Caudate | Glial cells | Not detected | Protein (IHC) | HPA → |
| Cerebral cortex | Endothelial cells | Not detected | Protein (IHC) | HPA → |
Troubleshoot ACADL chromogenic IHC in paraffin sections by checking retrieval, cell type, mitochondrial pattern, and staining controls before interpreting signal.
The IHC-listed anti-ACADL antibody A07206 has a rat ovary staining image from a formalin-fixed, paraffin-embedded section (catalog image caption) and listed human, mouse, and rat reactivity (catalog).
A07206 will render with its IHC image of a formalin-fixed, paraffin-embedded rat ovary section (catalog image caption). Its listed application is IHC, with human, mouse, and rat reactivity (catalog applications and reactivity).
Which to pick: For tissue IHC, choose A07206: its own image documents rat ovary staining in a formalin-fixed, paraffin-embedded section (catalog image caption), and the listed IHC dilution is 1:50–1:200 (datasheet). For cross-species work, A07206 lists human, mouse, and rat reactivity, while its supplied IHC image shows rat tissue only (catalog reactivity; catalog image caption). For IF/ICC, the payload lists no IF application or IF image for A07206 (catalog applications and image data); its host is rabbit and clonality is unreported (catalog).