This website uses cookies to ensure you get the best experience on our website.
- Table of Contents
What is flow cytometry, How does FACS work, how to analyze flow cytometry data
Browse Boster Featured ProductsFlow cytometry is a powerful tool because it allows simultaneous multiparametric analysis of the physical and chemical characteristics of up to thousands of particles per second. This makes it a rapid and quantitative method for analysis and purification of cells in suspension. Using flow, we can determine the phenotype and function and even sort live cells.
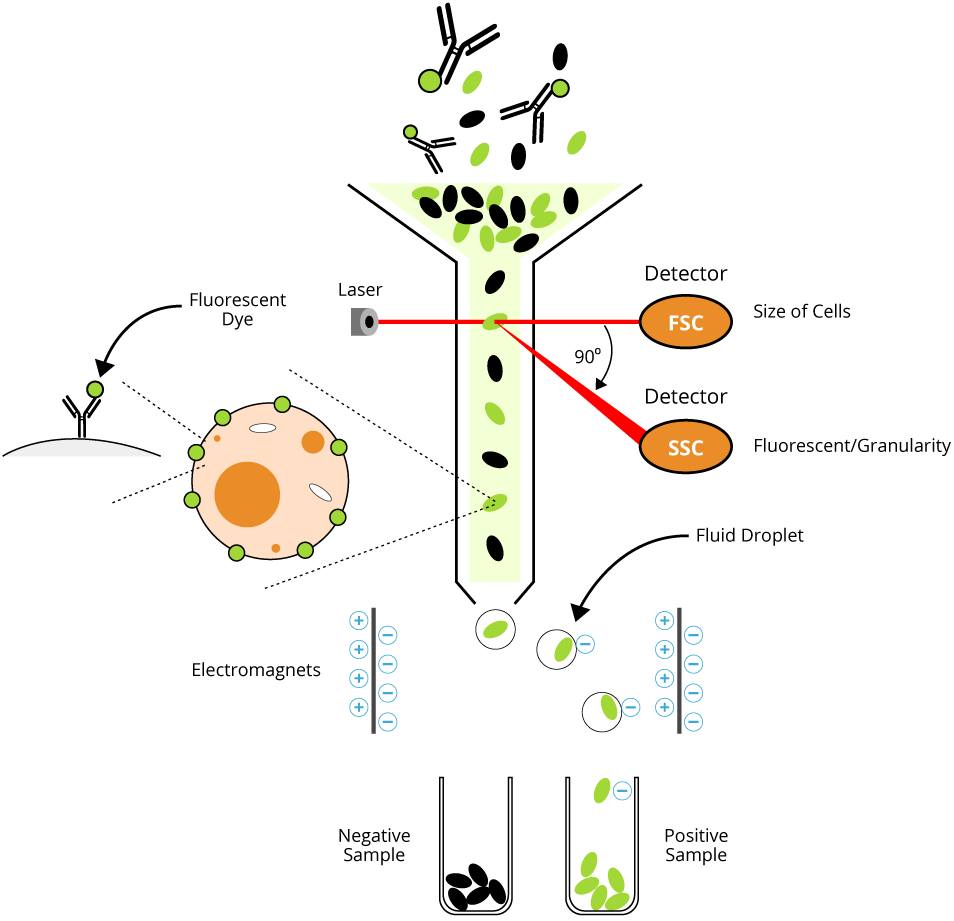
FACS is an abbreviation for fluorescence-activated cell sorting, which is a flow cytometry technique that further adds a degree of functionality. By utilizing highly specific antibodies labeled with fluorescent conjugates, FACS analysis allows us to simultaneously collect data on, and sort a biological sample by a nearly limitless number of different parameters. Just like in conventional flow cytometry, forward-scatter, side-scatter, and fluorescent signal data are collected. The user defines the parameters on how cells should be sorted and then the machine imposes an electrical charge on each cell so that cells will be sorted by charge (using electromagnets) into separate vessels upon exiting the flow chamber. The technology to physically sort a heterogeneous mixture of cells into different populations is useful for a wide range of scientific fields from research to clinical. Nowadays the terms “flow cytometry” and “FACS” are often used interchangeably to describe this laser-based biophysical technique.

The diagram below illustrates the experimental setup and general procedure of a typical FACS experiment. A population of mixed cells is sorted into a negative sample and a positive sample containing cells of interest by the flow cytometer
Flow cytometry is a popular cell biology technique that utilizes laser-based technology to count, sort, and profile cells in a heterogeneous fluid mixture. Using a flow cytometer machine, cells or other particles suspended in a liquid stream are passed through a laser light beam in single file fashion, and interaction with the light is measured by an electronic detection apparatus as light scatter and fluorescence intensity. If a fluorescent label, or fluorochrome, is specifically and stoichiometrically bound to a cellular component, the fluorescence intensity will ideally represent the amount of that particular cell component.
This guide will show you all the nuts and bolts for Flow Cytometry and FACS, including expert review of principle, optimized protocol that really works, and more.
Principle overview, The flow cytometer, Forward scatter and side scatter
The number of measurable parameters that can be used by this technology to separate cell populations is immense – starting from simple surface immune-phenotype to metabolic functions, cell cycle status, redox state, and DNA content to name a few. Since its inception, FACS has been used extensively in biomedical research and clinical diagnostics and therapeutics. The most common usage of FACS is seen in:
The flow cytometer instrument consists of three core systems: fluidics, optics, and electronics. The fluidics system includes a flow cell, where the sample fluid is injected. The flow cell requires sheath fluid to carry and align the cells or particles so that they pass through a narrow channel and into the laser intercept (light beam) in a single file. This hydrodynamic focusing allows the analysis of one cell at a time by laser interrogation. The optics system consists of various filters, light detectors, and the light source, which is usually a laser line producing a single wavelength of light at a specific frequency. This is where the particles are passed through at least one laser beam. Lasers are available at different wavelengths ranging from ultraviolet to far-red and have a variable range of power levels as well (photon output/time). Interrogation by the laser beam excites any compatible fluorescent probes that are conjugated to antibodies, causing the probes to emit light (or fluoresce) at specified wavelengths.

Key parameters which are measured by this machine include forward light scatter (FSC), side light scatter (SSC), and fluorescence emission signals. Forward scattered light (FSC) is light that is refracted by a cell in the forward direction, and continues in the same direction that the light was already traveling (typically up to 20° offset from the laser beam's axis). This signal is collected by a PMT called the forward scatter channel (FSC), and is commonly used to determine particle size. Usually, bigger particles will produce more forward scattered light than smaller ones, and larger cells will have a stronger forward scatter signal.

Side scattered light (SSC) is light that is refracted by cells and travels in a different direction than its original path (measured at a 90° angle to the excitation line). It usually provides information about the granularity and complexity of the cells. Cells with a low granularity and complexity will produce less side scattered light, while highly granular cells with a high degree of internal complexity (such as neutrophils) will result in a higher side scatter signal. Though it’s affected by shape and size of cells, it’s more sensitive to membranes, cytoplasm, nucleus etc. Thus, by using forward and side scattered light detection, cell populations can often be distinguished based on characteristic differences in cell size and granularity. Both FSC and SSC measurements are influenced by multiple factors and also depends on the quality of sample preparation, thus, to gather more detailed information we could utilize fluorescent labeling techniques with flow cytometr

What roles do Fluorochromes play in flow cytometry, how to choose the right Fluorochromes
Fluorophores (also called fluorochromes or fluorescent dyes) are light-emitting molecules conjugated to antibodies. When excited by lasers, they emit light at defined wavelengths. Fluorescence intensity reflects the abundance of the target molecule on or in the cell.
Cell populations can sometimes be separated based on FSC and SSC, but cells can also be separated by whether they express a specific protein. In this case, a fluorophore is usually used to stain the protein of interest. Fluorophores used for the detection of target proteins emit light after excitation by a laser of compatible wavelength. These fluorescently stained cells or particles can be detected individually. Each type of fluorescent dye or label has its own characteristic excitation and emission spectrum which is important for designing flow cytometry experiments. There is a wide selection of fluorophores available nowadays; for example, FITC, PerCP, APC, PE, Cy5.5, Alexa Fluors, and more. Fluorescently conjugated antibodies have commonly been used to label specific structures on the cell for flow cytometric analysis. As the fluorescing cell (or particle) passes through the interrogation point and interacts with the laser beam, it creates a pulse of photon emission over time (a peak). These are detected by the PMTs and converted by the electronics system to a voltage pulse, typically called an "event". The total pulse height and area is measured by the flow cytometer instrument, and the voltage pulse area will correlate directly to the fluorescence intensity for that individual event. These events are assigned channel numbers based on its measured intensity (pulse area). The higher the fluorescence intensity, the higher the channel number the event is assigned. This signal can be amplified by increasing the voltage running through the PMT.
One thing to note is that fluorescent signals may also occur from naturally fluorescing substances in the cell such as reduced pyridine nucleotides (NAD(P)H) and oxidized flavins (FAD), and this is termed “autofluorescence”. In general, larger and more granular cells have higher levels of autofluorescence due to having an increased amount of fluorescent compounds. The level of autofluorescence can be determined using unstained controls. It is often useful to have an unstained control, or an FMO (Fluorescence Minus One) control. The FMO control will help you to identify and gate cells during data analysis.
Click Here to Learn More About FMO controls
There are many fluorescent molecules, also known as fluorochromes, fluorophores, or fluorescent dyes, with a potential application in flow cytometry. These fluorescent molecules are excited by laser light at specific wavelengths and then emit light (fluoresce) at another wavelength. By conjugating (pre-attaching) them to primary antibodies, we can create conjugated antibodies that allow for flow cytometry analysis. Knowing each conjugate label’s properties will be important in choosing the right label for your experiment. Some key features to know about fluorescent conjugate tags are listed here:
Once you have selected suitable fluorochromes and antibodies for your flow cytometry experiment, the section below will walk you through the general experimental procedure.
General experimental procedure
The primary requirement for all types of flow cytometric analysis is that the cells under analysis must be in a single-cell suspension. It is very important to obtain a single-cell suspension to avoid clogging up the system with clumps. Peripheral blood mononuclear cells (PBMCs) isolated from whole blood through Ficoll gradient centrifugation, or RBC lysed whole blood, or non-adherent cultured cells are readily applicable for flow cytometric analysis. Adherent cultured cells or cells present in solid organs should first be made into a single cell suspension before flow analysis by using enzymatic digestion or mechanical dissociation of the tissue, respectively. Subsequently, mechanical filtration should be performed to avoid unwanted instrument clogs and obtain higher quality flow data. The cells are then incubated in test tubes or microtiter plates with unlabeled or fluorescently conjugated antibodies and analyzed through the flow cytometer machine.
Click Here for Sample Preparation Guide
*This is a conceptual explanation for how flow cytometry works.
Click here for step-wise flow cytometry protocols.Each human cell expresses hundreds of thousands of cell surface antigens that specify their cell type, biological function, development stage, and more. Cells from different organs have characteristic surface antigens, and we can utilize fluorochrome-conjugated antibodies specific for these surface markers to analyze these cells directly by flow cytometry. In direct immunofluorescence staining, cells are incubated with an antibody directly conjugated to a fluorophore such as PerCP. This requires only one antibody incubation step and therefore eliminates the possibility of non-specific binding from a secondary antibody. Direct staining is advantageous during intracellular staining because large antibody-fluorophore complexes including secondary antibodies can become trapped and result in non-specific binding, or they may fail to enter the cell which results in no detection.
If the experiment will be staining with unconjugated purified antibody, there needs to be an additional step of staining with a fluorescent conjugated secondary antibody (indirect staining).
Click for Direct Staining ProtocolIn indirect staining, the fluorophore conjugated secondary antibody detects the primary antibody which is unconjugated. Another available method is the avidin-biotin system, whereby a biotin-conjugated antibody is detected with fluorophore-labeled avidin. There is a wide range of conjugated antibodies available today, and with indirect staining, the choices of target proteins further increases. Now unconjugated primary antibodies raised against many different targets can be used together with a conjugated secondary antibody for flow cytometric analysis.
Click for Direct Staining ProtocolIn addition to the cell surface antigens, the intracellular staining procedure allows direct measurement of antigens (cytokines or transcription factors) present inside the cell cytoplasm or nucleus. In this procedure, the fixation and permeabilization of cells are required. Fixing cells will retain the target protein in its original cellular location, and will usually ensure better stability of soluble antigens and antigens with a short half-life. Detecting intracellular antigens requires cell permeabilization before staining, and antibodies should be prepared in permeabilization buffer to ensure the cells remain permeable. This modified staining procedure allows direct measurement of functional activity of any cell of interest present in blood or other tissues without further separation.
Various fixation and permeabilization methods are available to allow access of antibodies to intracellular proteins. To achieve better results, additional in vitro stimulation with some common mitogen may be required to trigger increased production of cytokines inside cells. Some common mitogens for this purpose include PMA, Ca++ or peptide epitopes and protein transport inhibitor, Brefeldin A, etc. Detecting secreted proteins can be difficult if the proteins are released from the cell before detection, or if they degrade rapidly. In these situations, we recommend using Brefeldin A or other compounds that prevent protein release from the Golgi apparatus. A Golgi block such as Brefeldin A will inhibit secretion of expressed proteins from the Golgi apparatus, trapping them in the cell to be detected. The intracellular staining method can then be utilized for detection of the target protein.
Click for Intracellular Staining ProtocolFor more experimental advice, be sure to visit our Optimization Guide by clicking the link below. A successful staining procedure is dependent on optimization of experimental conditions which includes titering of antibodies, optimized fixation and permeabilization procedures, and setting up appropriate controls. Once your samples are prepared as single-cell suspensions and you have all your controls ready, simply run it through the flow cytometer according to the instrument's instructions to obtain your data results. Click here for Optimization Guide

In a flow cytometry experiment, every cell that passes through the interrogation point and is detected will be counted as a distinct event. Each type of light that is detected (forward-scatter, side-scatter, and each different wavelength of fluorescence emission) will also have its own unique channel. The data for each event is plotted independently to represent the signal intensity of light detected in each channel for every event. This data could be visually represented in multiple different ways, so you may need to play around with different types of data plots and how to set your gates. The most common types of data graphs used in flow cytometry include histograms, dot plots, density plots, and contour diagrams. As multiparametric analysis becomes more complicated, analysis techniques can even include higher order plots such as 3 dimensional plots and SPADE trees.
Univariate histogram plots measure only one parameter. Typically, the Y-axis is the number of events (the cell count) that show a given fluorescence, and the X-axis is the relative fluorescence intensity detected in a single channel. A large number of events detected at one particular intensity will be represented as a peak (or spike) on the histogram. Ideally, only one distinct peak will be produced and can be interpreted as the positive dataset (representing the cells with the desired characteristics of interest).
Oftentimes however, flow analysis is performed on a mixed population of cells and results in multiple peaks on the histogram. In these situations, the flow experiment should be repeated with an appropriate negative isotype control which should help to identify the positive dataset. For a positive result, look for the shift in intensity between negative control and positive samples as shown in the diagram below.

For bivariate analysis, data is often represented as dot plots or density plots, and contour diagrams. By analyzing multiple parameters, we can show the relationship between two different markers, allowing for more complex phenotypes to be identified and important populations of interest to be isolated via gating. Gating is an important procedure in flow cytometric data analysis used to selectively visualize the cells of interest and eliminate results from unwanted particles such as dead cells and debris. Click here to learn more about Isotype Controls

Dot plots and density plots compare 2 or 3 parameters simultaneously on a scatter-plot where each event is represented as a single point (or dot). The dot plot is a figure that shows the relationship between multiple variables at once, and the parameters can be any combination of scatter and fluorescence signals. Three common combinations used are: 1) forward scatter (FSC) vs. side scatter (SSC); 2) single color vs. side scatter; and 3) two-color fluorescence plot.
The density plot was developed as a way to show not just expression levels, but the relative number of events (density) in a given region. On the density plot, each dot or point represents a single cell that has passed through the interrogation point of the flow cytometer. Intensity measurements of different channels are represented along the different axes so that events with similar intensities will cluster together in the same region on the scatter-plot. Density plots are excellent for viewing the frequency of subpopulations.
In this example of a dot-plot, cell populations in a peripheral blood sample can be identified based on forward- and side-scatter light signals. Cell populations are marked by their probable identities:
Image Reference : Riley and Idowu. Principles and Applications of Flow Cytometry.
Image Caption : Dot plot of forward-scatter light vs. side-scatter light. Each dot represents an individual cell analyzed by the flow cytometer. The characteristic position of different cell populations is determined by different physical properties such as cell size and granularity, explained in detail below:

Image Caption: Contour diagram of forward-scatter light vs. side-scatter light. Density is represented by contour lines, and like the dot plot, the characteristic position of different cell populations is determined by different physical properties such as cell size and granularity.
Click here to return to Flow Cytometry Technical ResourcesAs you can see, some cell identities can be confirmed by forward and side-scatter profiles, but fluorescent labeling with a cell-type specific marker will provide greater resolution and certainty when profiling complex heterogeneous cell populations. In the example plot above, one may be able to distinguish between lymphocytes and granulocytes using forward and side-scattered light measurements. However, among the granulocytes there are three different classes (eosinophils, basophils, and neutrophils) which are difficult to distinguish using light-scattering properties alone because of their similar cell size and structure. In order to identify the basophils, for example, we could selectively label them with fluorescently conjugated antibodies which target basophil specific markers.
The other way to show the density of your data is to use a contour plot. Contour plots display the relative frequency of the populations, regardless of the number of events collected. A contour diagram displays the probability contouring with joined lines representing similar numbers of cells. Concentric rings form around populations so that the higher the density, the closer the rings are on the contour diagram. Thus, this graph takes on the appearance of a geographical altitude map with steeper islands where the density is high. In a 5% contour plot, five percent of cells fall within each contour line (as defined by the plot). Thus, the outermost line contains 95% of the cells; the second line contains 90% and so on. In the example contour plot below, the cell populations which were represented in the density plot example above is now visualized with a contour diagram instead.
One disadvantage of contour plots is that information about rare populations is not visible since these diagrams are not good at showing outliers. In a 5% contour plot, 5% of cells would fall outside of the last contour line. In these situations, some data analysis programs will have the option to add outliers to most graph types. Another strategy is to combine a contour plot with a dot plot, allowing both density estimation and rare event information to be displayed. It is essential to choose the best way to communicate your data to help you convince your peers of the results you are proposing. Be sure to highlight your results by using the right flow figures to accurately reflect your data without confusion.
Here are the 212 most popular ELISA kits.
Here are the 300 most popular antibodies.
Identify common flow cytometry issues such as high background, weak signal, and poor population separation with practical troubleshooting tips.
Review step-by-step flow cytometry protocols for routine workflow setup, experiment planning, and day-to-day lab reference.
Learn how to prepare cells and samples for flow cytometric analysis to support cleaner data and more reliable results.
Explore optimization tips for panel setup, staining conditions, and signal quality to improve overall flow cytometry performance.
Browse flow cytometry resources in one place, including technical guides, sample preparation help, and supporting educational content.
Learn how cell-free antibody synthesis works and explore its potential advantages for rapid antibody generation and screening workflows.
Improve sample quality with practical guidance on cell handling, viability, and preparation methods before flow cytometry analysis.
Understand the basics of gating and how to define cell populations more accurately for clearer interpretation of flow cytometry data.
Optimize fixation and permeabilization methods for intracellular staining to improve consistency and preserve target detection.