ATP1A2 / Sodium/potassium-transporting ATPase subunit alpha-2 · IHC design guide

Design Immunohistochemistry for ATP1A2

Plan chromogenic ATP1A2 IHC in paraffin sections using cerebellar neuropil as a high-staining reference (HPA tissue IHC). This guide covers fixation, antibody dilution and scoring against the observed cytoplasmic tissue pattern (HPA tissue IHC).

Evidence assembled Oct 2026 · For research use; verify linked source records and product datasheet before use
Immunohistochemistry protocol sheet for ATP1A2 (IHC for ATP1A2): expected localisation Cell membrane expected (UniProt); cytoplasmic tissue staining (HPA tissue IHC), antibody A02064-1, validated IHC image, and IHC protocol steps
Printable ATP1A2 IHC protocol sheet — expected localisation Cell membrane expected (UniProt); cytoplasmic tissue staining (HPA tissue IHC), antibody A02064-1, controls and protocol steps. Open the full ATP1A2 IHC guide →

ATP1A2 Immunohistochemistry Experimental Design Guide

Expected localisation, validated protocols, controls and antibodies — the at-a-glance facts below, then the full design guide.

Must know before staining
Expected localisation Cell membrane expected (UniProt); cytoplasmic tissue staining (HPA tissue IHC)
Staining pattern Cytoplasmic staining is strongest in CNS neuropil (HPA tissue IHC)
Antigen retrieval EDTA pH 8.0 HIER, heat-mediated (datasheet A02064-1)
Positive control ⓘ Cerebellum+4 more · see all
Negative control ⓘ Adrenal gland+4 more · see all
Important caveats
Reasons your staining may differ from the expected pattern.
Fixation Keep fixation consistent across sections (standard IHC practice; not target-specific); Matched tissue-IHC evidence does not establish the fixation claim. Validate the specimen-specific method before use. (selected-SKU IHC image A02064-1)
Caveat Staining has medium consistency with RNA expression (HPA tissue IHC)
Regulation ATP1A2 regulation is not annotated (UniProt)
Isoform / epitope No isoforms annotated; epitope side may affect access (UniProt)
Section 1

Recommended ATP1A2 IHC & IF Protocols

The catalog antibody uses EDTA pH 8.0 retrieval (datasheet A02064-1); the published IHC protocols below provide three paraffin-section examples (PMC8607279; PMC9097831; PMC7362554).

Recommended immunohistochemistry (IHC-P) protocol parameters
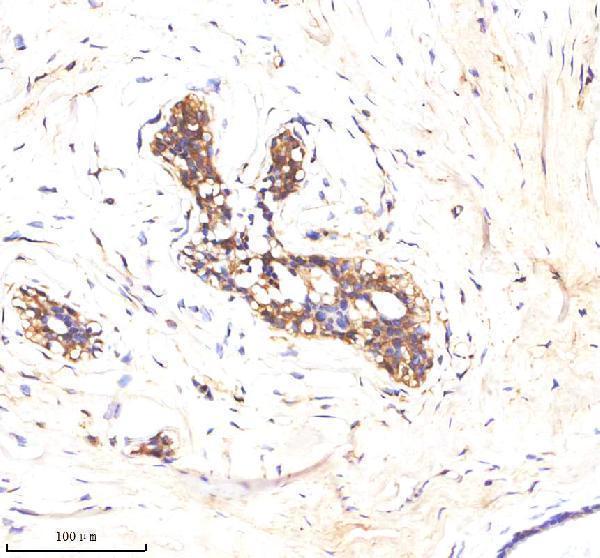
SampleParaffin-embedded human breast cancer tissue; fixative not specified (datasheet A02064-1)
FixationImage fixative and duration unreported (datasheet A02064-1); verify before use.
Sectioning4–5 µm sections on charged slides (standard)
DeparaffinisationXylene, graded ethanol series to water (standard)
Antigen retrievalHeat retrieval: EDTA pH 8.0 (datasheet A02064-1); 20 min, 95–100 °C (standard)
Peroxidase block3% H2O2, 10 min, room temperature (standard)
Blocking10% goat serum (datasheet A02064-1)
Primary antibodyRabbit anti-ATP1A2, 2-5 μg/ml (datasheet A02064-1)
Primary incubationOvernight at 4 °C (datasheet A02064-1)
DetectionHRP-conjugated secondary, DAB chromogen (datasheet A02064-1)
CounterstainHematoxylin, blue, dehydrate and mount (standard)
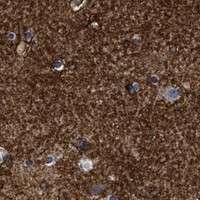
Expected resultATP1A2-positive staining in molecular layer - neuropil of cerebellum (HPA tissue IHC: High). HPA tissue profile: Cytoplasmic expression in several tissues, most abundant in CNS. No signal in the no-primary control.
💡Decision noteStart with EDTA pH 8.0 for the catalog antibody (datasheet A02064-1). The published protocols used sodium citrate or EDTA pH 9.0 (PMC8607279; PMC7362554).
Section 2

What Is the Expected ATP1A2 Staining Pattern?

ATP1A2 is a cell-membrane protein with 10 transmembrane segments (UniProt P50993 topology). In paraffin-section IHC, expect the strongest reported staining in cerebellar molecular-layer neuropil and cerebral-cortex neuropil, with medium staining in caudate and hippocampal glial cells (HPA tissue IHC). HPA describes the broader tissue profile as cytoplasmic expression and rates its antibody–RNA agreement as medium consistency (HPA tissue IHC, Enhanced reliability).

What am I looking at on my slide?
Strong staining follows cerebellar molecular-layer neuropil or cerebral-cortex neuropil (HPA tissue IHC: High).This matches HPA's strongest reported sites. Assess the neuropil pattern in its tissue context; UniProt places ATP1A2 at the cell membrane, while HPA describes tissue staining as cytoplasmic (UniProt P50993; HPA tissue IHC).
Glial cells stain less strongly in caudate or hippocampus (HPA tissue IHC: Medium).Medium glial staining is compatible with the reported pattern. Do not require every positive region to match the high neuropil signal; HPA assigns these sites different staining levels (HPA tissue IHC).
Staining is confined to nuclei, with no corresponding neuropil or glial pattern.A purely nuclear result conflicts with ATP1A2's cell-membrane annotation and HPA's cytoplasmic tissue profile. Treat it as a possible artefact and check controls before scoring it as ATP1A2 (UniProt P50993; HPA tissue IHC).
Strong staining appears in a cell population reported as not detected, such as bone-marrow hematopoietic cells (HPA tissue IHC).This is discordant with that specific HPA observation; assess antibody cross-reactivity and endogenous chromogen-generating activity. HPA's medium antibody–RNA consistency means one discordant field is not, by itself, proof of either cause (HPA tissue IHC; general IHC practice).
Colour covers the section diffusely, including tissue areas without the expected cell pattern.Diffuse background does not establish ATP1A2 localisation. Compare a no-primary control and the expected neuropil or glial distribution before calling the section positive (HPA tissue IHC; general IHC practice).
💡Expected ATP1A2 appearanceCall a section positive when staining resolves in the expected cells—high cerebellar or cortical neuropil, or medium caudate or hippocampal glia—while purely nuclear or uniform section-wide colour warrants investigation (HPA tissue IHC; UniProt P50993 cell-membrane annotation).
How each factor affects the staining
Compartment and epitope orientationUniProt annotates 10 transmembrane segments plus cytoplasmic and extracellular stretches, so epitope position matters when interpreting accessibility (UniProt P50993 topology). The supplied record does not locate the catalog antibody's epitope; do not infer a required retrieval condition from topology alone.
Tissue and cell selectionHPA reports high neuropil staining, medium glial staining, and no detection in specified cell populations, including bone-marrow hematopoietic cells (HPA tissue IHC). Choose comparison regions by their named cells; a whole-organ label can hide different populations and staining levels.
Strength of the evidenceThe catalog antibody CAB022230 has Enhanced IHC validation, while HPA describes antibody–RNA agreement as medium consistency (HPA antibodies; HPA tissue IHC). Use the reported distribution as a reference pattern, and investigate discordance rather than treating every slide-level difference as definitive.
IF/ICC: should it show the same pattern?Membrane localisation is supported by UniProt and HPA's subcellular summary, but HPA supplies no ICC-IF image-bearing cell line or main location here (UniProt P50993; HPA subcellular). These IHC tissue results cannot establish an IF/ICC staining pattern or protocol.
Why is my staining missing, weak or wrong?
SituationLikely causeNext action
No signal in cerebellar molecular-layer neuropil or cerebral-cortex neuropil (HPA tissue IHC: High).The expected positive region may be absent from the section, or an IHC detection step may have failed; the supplied sources do not identify a target-specific fixation effect (HPA tissue IHC; general IHC practice).Confirm the named region is present, then check the run's positive control, primary-antibody application and chromogenic detection steps (HPA tissue IHC; general IHC practice).
Only nuclei stain in an otherwise interpretable section.A nuclear-only pattern disagrees with UniProt's cell-membrane location and HPA's cytoplasmic tissue profile (UniProt P50993; HPA tissue IHC).Compare with a no-primary control and inspect the expected neuropil or glial cells before assigning the nuclear signal to ATP1A2 (HPA tissue IHC; general IHC practice).
Diffuse colour obscures cell boundaries and tissue architecture.Background can arise from nonspecific antibody binding or endogenous chromogen-generating activity (general IHC practice); HPA's cell-specific observations cannot validate diffuse colour (HPA tissue IHC).Review the no-primary control and the run's blocking and wash steps. Score localisation only where a distinct cell or neuropil pattern remains visible (general IHC practice; HPA tissue IHC).
Bone-marrow hematopoietic cells stain strongly despite HPA reporting no detection (HPA tissue IHC).Cross-reactivity or endogenous detection activity is possible; a discrepancy alone does not identify its mechanism (HPA tissue IHC; general IHC practice).Check a no-primary control, verify the stained cell population, and compare staining in HPA-reported positive neuropil on the same run (HPA tissue IHC; general IHC practice).
Caudate or hippocampal glia look weaker than cerebellar or cortical neuropil.That relative intensity matches HPA's medium glial versus high neuropil observations (HPA tissue IHC).Score each named cell population against its own reported level and tissue context; investigate only if the glial pattern is absent or overwhelmed by background (HPA tissue IHC; general IHC practice).
An IF/ICC image lacks a clear membrane outline.UniProt supports membrane localisation, but the supplied HPA subcellular record provides no ICC-IF images or main-location assignment for judging that image (UniProt P50993; HPA subcellular).Interpret the IF/ICC result with its own controls and guide; do not use the paraffin-section IHC pattern alone to declare an IF/ICC result valid or invalid (HPA tissue IHC; HPA subcellular; general IF practice).

Sample controls for ATP1A2 IHC & IF

🧪Run cerebellum first: its molecular-layer neuropil should stain strongly (HPA: High in cerebellar molecular-layer neuropil). Use adrenal gland glandular cells as the negative tissue (HPA: Not detected in adrenal gland glandular cells); on the cerebellar slide, treat cells outside the annotated neuropil as internal background comparators only after confirming that they lack specific staining.
Positive control tissue: Cerebellum (Molecular layer - neuropil, HPA High)
Negative control tissue: Adrenal gland (HPA Not detected)
ICC-IF cell lines (HPA subcellular resource): HPA carries no ICC-IF cell line for ATP1A2; derive a cell-line control from the positive tissue's cell type (Molecular layer - neuropil) and confirm it by RNA or western blot first.
Technical controls: Include a no-primary, secondary-only control; a rabbit immunoglobulin isotype control matched to the catalog antibody’s class and concentration (selected-SKU caption: rabbit primary); and ATP1A2-knockout tissue, if available, as a biological negative. For chromogenic detection, quench endogenous peroxidase and inspect the cerebellar no-primary section for residual background (standard IHC practice; HPA: cerebellar molecular-layer neuropil is High).
⚠️Feasibility: The selected-SKU caption reports paraffin-section staining after heat-mediated EDTA retrieval at pH 8.0, but does not establish whether retrieval is required; its fixative is unreported (selected-SKU tissue-IHC caption). No supplied matched source reports a target-specific fixation window or fixation effect, or establishes whether frozen sections or IF are easier. Dense cerebellar neuropil can make staining difficult to assign to individual cell membranes, so assess its pattern against tissue morphology and the control sections (HPA: High in cerebellar molecular-layer neuropil; UniProt P50993: cell membrane).

HPA tissue IHC evidence for ATP1A2

Comprehensive Human Protein Atlas IHC scoring per tissue (reliability: Enhanced — Medium consistency between antibody staining and RNA expression data.). Rows are taken directly from the HPA tissue chart — click any row's HPA link to view the source.

Positive expression · recommended positive controls

TissueCell typeLevelEvidenceSource
Cerebellum Molecular layer - neuropil High Protein (IHC) HPA →
Cerebral cortex Neuropil High Protein (IHC) HPA →
Appendix Glandular cells Medium Protein (IHC) HPA →
Caudate Glial cells Medium Protein (IHC) HPA →
Duodenum Glandular cells Medium Protein (IHC) HPA →

Undetected expression · recommended negative controls

TissueCell typeLevelEvidenceSource
Adrenal gland Glandular cells Not detected Protein (IHC) HPA →
Bone marrow Hematopoietic cells Not detected Protein (IHC) HPA →
Breast Adipocytes Not detected Protein (IHC) HPA →
Bronchus Respiratory epithelial cells Not detected Protein (IHC) HPA →
Cervix Glandular cells Not detected Protein (IHC) HPA →
Section 3

Advanced ATP1A2 IHC Tips

Use the catalog antibody’s paraffin section result as a starting point, then assess staining against ATP1A2 localisation and tissue controls.

Which retrieval conditions should I try first for ATP1A2 paraffin sections?
Start with heat mediated retrieval in EDTA at pH 8.0 (datasheet A02064-1). The selected paraffin section image used that condition, followed by 10% goat serum blocking and 2 μg/ml primary antibody overnight at 4°C (datasheet A02064-1). If staining is weak, compare a modestly longer heating step on adjacent sections while keeping the buffer constant, and inspect tissue preservation after each change (standard IHC practice). Run a known positive section alongside the test section, because weak signal alone cannot distinguish inadequate retrieval from low ATP1A2 abundance (HPA tissue IHC; standard IHC practice).
How should I troubleshoot fixation when ATP1A2 staining is weak or uneven?
The selected image identifies a paraffin section but does not state its fixative, so ATP1A2 specific fixation sensitivity is unknown (datasheet A02064-1). Record the fixative, time before fixation, fixation duration and processing conditions for each specimen before comparing staining (standard IHC practice). Test adjacent sections with the same EDTA pH 8.0 retrieval and 2 μg/ml primary concentration used in the selected image, changing only one processing variable at a time (datasheet A02064-1; standard IHC practice). Examine morphology and a positive control section together; neither tissue staining patterns nor ATP1A2 topology establishes which fixation condition best preserves this antibody’s epitope (HPA tissue IHC; UniProt P50993 topology).
Where should convincing ATP1A2 staining appear in a paraffin section?
Prioritise staining that outlines cells or their processes, since ATP1A2 is a cell membrane protein with 10 transmembrane segments (UniProt P50993 localisation and topology). In nervous tissue, assess neuropil as well as cell bodies: cerebellar molecular layer and cerebral cortex neuropil are reported high, while caudate and hippocampal glial cells are medium (HPA tissue IHC). HPA also describes cytoplasmic staining across several tissues, so a diffuse intracellular pattern needs comparison with membrane associated signal and appropriate controls before assignment (HPA tissue IHC; UniProt P50993 localisation). Check the same anatomical compartment across adjacent sections and avoid scoring empty spaces or tissue folds as cellular staining (standard IHC practice).
Could epitope position or another sodium pump alpha isoform explain discordant staining?
The antibody epitope is not supplied, so its accessibility after paraffin processing and EDTA pH 8.0 retrieval cannot be predicted from the selected image (datasheet A02064-1). ATP1A2 has 10 transmembrane segments and both cytoplasmic and extracellular loops; positions 337–769 are annotated as cytoplasmic (UniProt P50993 topology). The record lists 0 annotated ATP1A2 isoforms, while the sodium pump family has 4 alpha isoforms with tissue dependent expression (UniProt P50993 isoforms and subunit annotation). Ask for the immunogen or mapped epitope and cross reactivity data before attributing unexpected staining to a particular alpha isoform (standard IHC validation practice).
How should I adapt ATP1A2 localisation checks for multiplex immunofluorescence?
Treat IF as a separate validation exercise: the supplied evidence includes a paraffin section IHC image but no cell line ICC/IF images (datasheet A02064-1; HPA subcellular). Pair ATP1A2 with a validated marker for the cell population under study, then assess whether the signal follows cell boundaries or processes expected for a membrane protein (UniProt P50993 localisation; standard IF practice). Choose spectrally separated fluorophores and place the weaker signal in a channel with low measured tissue autofluorescence, using unstained and single colour controls (standard IF practice). Because the antibody epitope is unspecified, compare mild permeabilisation with no permeabilisation; cytoplasmic epitopes require access across the plasma membrane, whereas exposed extracellular epitopes may not (UniProt P50993 topology; standard IF practice).
What should I change when ATP1A2 DAB staining has high background?
First compare a section without primary antibody with the test section to identify signal from detection reagents or endogenous peroxidase (standard IHC practice). The selected method used 10% goat serum blocking, 2 μg/ml primary antibody overnight at 4°C, and a peroxidase linked secondary for 30 minutes at 37°C (datasheet A02064-1). Include a peroxidase blocking step and monitor DAB development on matched sections; these are general chromogenic IHC controls, not evidence of ATP1A2 specificity (standard IHC practice). If background persists, optimise primary concentration and washing while preserving a positive tissue control and inspecting section edges separately (standard IHC practice; HPA tissue IHC).
How should I quantify ATP1A2 staining across differently composed tissue sections? ⚠ ANSWER MARKED FOR VERIFICATION
Define the anatomical region and cell population before scoring, because HPA reports high neuropil staining in cerebellum and cortex but medium staining in selected glial and glandular populations (HPA tissue IHC). For identifiable cells, report percent positive cells and an H-score from fixed intensity categories; for neuropil, report stained area or signal density per mm² within a defined region (standard IHC quantification practice). Normalise cellular counts to the number of eligible cells and area measurements to evaluated tissue area, excluding folds, necrosis and blank spaces (standard IHC quantification practice). Keep retrieval, chromogen development, imaging and scoring thresholds matched across groups, and analyse membrane associated and diffuse staining separately (standard IHC practice; UniProt P50993 localisation).
How can I distinguish credible ATP1A2 staining from section artefacts?
Credible staining should fit the sampled cell population and favour cell boundaries or processes, consistent with ATP1A2 membrane localisation and high CNS neuropil signal (UniProt P50993 localisation; HPA tissue IHC). Check whether the pattern recurs in comparable regions of replicate sections, rather than appearing only at cut edges, folds or necrotic areas (standard IHC practice). A no primary control helps identify endogenous peroxidase or detection background, while a positive tissue control checks that retrieval and detection worked (standard IHC practice). Interpret breast cancer section staining cautiously: the selected image documents staining there, whereas HPA reports breast adipocytes as not detected, which is a different cell population (datasheet A02064-1; HPA tissue IHC).
Boster reagents

Best ATP1A2 / Sodium/potassium-transporting ATPase subunit alpha-2 IHC Antibodies

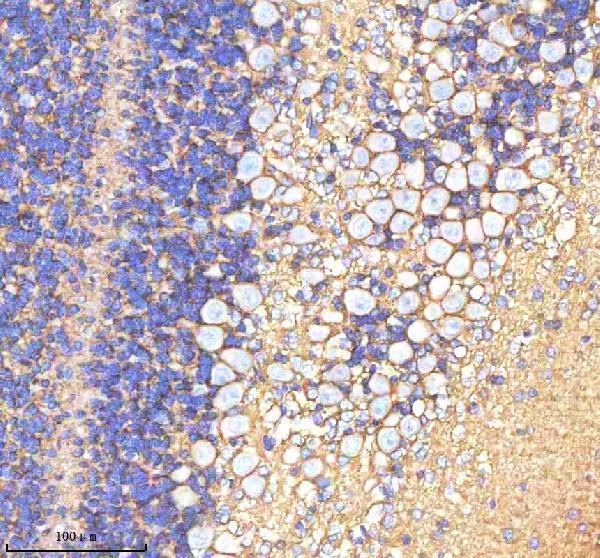
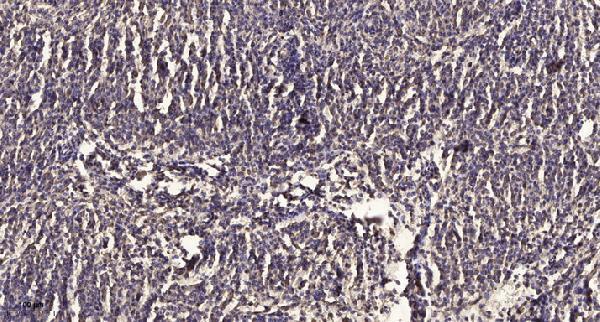
Both antibodies have IHC data from paraffin sections (catalog IHC images). The images cover human meningioma and breast cancer, plus mouse and rat cerebellum (catalog IHC images). No IF data are supplied (catalog IF images).

Real IHC data IHC analysis of ATP1A2 using anti-ATP1A2 antibody (A02064-1). ATP1A2 was detected in a paraffin-embedded section of human breast cancer tissue. Heat mediated antigen retrieval was performed in EDTA buffer (pH 8.0, epitope retrieval solution). The tissue section was blocked with 10% goat serum. The tissue section was then incubated with 2 μg/ml rabbit anti-ATP1A2 Antibody (A02064-1) overnight at 4°C. Peroxidase Conjugated Goat Anti-rabbit IgG was used as secondary antibody and incubated for 30 minutes at 37°C. The tissue section was developed using HRP Conjugated Rabbit IgG Super Vision Assay Kit (Catalog # SV0002) with DAB as the chromogen.
Anti-ATP1A2 Antibody ®
Cat # A02064-1
Real IHC data Immunohistochemical analysis of paraffin-embedded human meningioma. 1, Antibody was diluted at 1:200(4° overnight). 2, Tris-EDTA,pH9.0 was used for antigen retrieval. 3,Secondary antibody was diluted at 1:200(room temperature, 45min).
Anti-ATP1A2 Antibody
Cat # A02064

A02064 has an IHC image from paraffin-embedded human meningioma and lists Human, Monkey, Mouse and Rat reactivity (A02064 image caption; catalog reactivity). A02064-1 has IHC images from paraffin-embedded human breast cancer and mouse and rat cerebellum (A02064-1 image captions).

Which to pick: For paraffin-section IHC, choose A02064-1 when its human, mouse or rat examples match the species of interest; A02064 provides a human meningioma example (A02064-1 image captions; A02064 image caption). For the broadest listed species coverage, choose A02064, which also lists Monkey reactivity, though its supplied IHC image shows human tissue only (catalog reactivity; A02064 image caption). Neither SKU lists IF/ICC or supplies IF images, so there is no supported IF/ICC pick; fixative is unreported in both paraffin-section captions (catalog applications; catalog IF images; IHC image captions).

Each figure is that product's own IHC / IF validation image from its datasheet.

References

  1. UniProt Consortium. UniProt entry P50993 (AT1A2_HUMAN, Sodium/potassium-transporting ATPase subunit alpha-2).
  2. Human Protein Atlas. ATP1A2 tissue IHC expression (reliability: Enhanced).
  3. Human Protein Atlas. ATP1A2 subcellular location (ICC-IF): Membrane.
  4. Human Protein Atlas. ATP1A2 antibody validation summary (1 antibodies).
  5. Identification of Three Potential Prognostic Genes in Platinum-Resistant Ovarian Cancer via Integrated Bioinformatics Analysis. Cancer management and research 2021 — PMC8607279.
  6. Comprehensive analysis identified a reduction in ATP1A2 mediated by ARID3A in abdominal aortic aneurysm. Journal of cellular and molecular medicine 2022 — PMC9097831.
  7. Targeted ASO-mediated Atp1a2 knockdown in astrocytes reduces SOD1 aggregation and accelerates disease onset in mutant SOD1 mice. PloS one 2023 — PMC10683999.
  8. Comprehensive analysis of the expression of sodium/potassium-ATPase α subunits and prognosis of ovarian serous cystadenocarcinoma. Cancer cell international 2020 — PMC7362554.
  9. PubMed PMID:2477373 — UniProt-cited evidence.
  10. PubMed PMID:9872452 — UniProt-cited evidence.
  11. PubMed PMID:16710414 — UniProt-cited evidence.