GIT1 / ARF GTPase-activating protein GIT1 · IHC design guide

Design Immunohistochemistry for GIT1

Plan GIT1 paraffin IHC around cytoplasmic staining, with high staining in cerebral cortical neurons, glandular cells of the fallopian tube and small intestine, and bladder urothelial cells (HPA tissue IHC). Start the IHC-validated antibody at 2–5 μg/ml (datasheet A02140-3) and compare specimens with consistent fixation (standard IHC practice).

Evidence assembled Oct 2026 · For research use; verify linked source records and product datasheet before use
Immunohistochemistry protocol sheet for GIT1 (IHC for GIT1): expected localisation General cytoplasmic staining (HPA tissue IHC), antibody A02140-3, validated IHC image, and IHC protocol steps
Printable GIT1 IHC protocol sheet — expected localisation General cytoplasmic staining (HPA tissue IHC), antibody A02140-3, controls and protocol steps. Open the full GIT1 IHC guide →

GIT1 Immunohistochemistry Experimental Design Guide

Expected localisation, validated protocols, controls and antibodies — the at-a-glance facts below, then the full design guide.

Must know before staining
Expected localisation General cytoplasmic staining (HPA tissue IHC)
Staining pattern Cytoplasmic staining in neuronal and glandular cells (HPA tissue IHC)
Antigen retrieval EDTA pH 8.0 HIER, heat-mediated (datasheet A02140-3)
Positive control ⓘ Cerebral cortex+4 more · see all
Negative control ⓘ Smooth muscle+1 more · see all
Important caveats
Reasons your staining may differ from the expected pattern.
Fixation Matched tissue-IHC evidence does not establish the fixation claim. Validate the specimen-specific method before use. (selected-SKU IHC image A02140-3)
Caveat Cell mix matters: smooth muscle cells are undetected (HPA tissue IHC)
Regulation Brain-enhanced RNA expression (HPA tissue RNA)
Isoform / epitope 3 isoforms; check epitope coverage across sequences (UniProt)
Section 1

Recommended GIT1 IHC & IF Protocols

The catalog antibody uses EDTA pH 8.0 heat retrieval (datasheet: A02140-3). The published GIT1 IHC workflows below cover liver and colon tumors and mouse heart (PMC4689273; PMC3367479; PMC3642222; PMC8806235).

Recommended immunohistochemistry (IHC-P) protocol parameters
SampleParaffin-embedded human appendiceal adenocarcinoma tissue; fixative not specified (datasheet A02140-3)
FixationImage fixative and duration unreported (datasheet A02140-3); verify before use.
Sectioning4–5 µm sections on charged slides (standard)
DeparaffinisationXylene, graded ethanol series to water (standard)
Antigen retrievalHeat retrieval: EDTA pH 8.0 (datasheet A02140-3); 20 min, 95–100 °C (standard)
Peroxidase block3% H2O2, 10 min, room temperature (standard)
Blocking10% goat serum (datasheet A02140-3)
Primary antibodyRabbit anti-GIT1, 2-5 μg/ml (datasheet A02140-3)
Primary incubationOvernight at 4 °C (datasheet A02140-3)
DetectionStreptavidin-biotin complex (SABC), DAB chromogen (datasheet A02140-3)
CounterstainHematoxylin, blue, dehydrate and mount (standard)
Expected resultGIT1-positive staining in neuronal cells of cerebral cortex (HPA tissue IHC: High). HPA tissue profile: General cytoplasmic expression. No signal in the no-primary control.
💡Decision noteStart with EDTA pH 8.0 for the catalog antibody (datasheet: A02140-3). Use citrate pH 6.0 when reproducing the mouse heart protocol (PMC3367479).
Section 2

What Is the Expected GIT1 Staining Pattern?

GIT1 is an intracellular protein without a transmembrane segment; it localizes to cytoplasm, focal adhesions and neuronal synapses (UniProt Q9Y2X7 topology and subcellular location). In IHC, expect chiefly cytoplasmic staining in cortical neurons and in the listed glandular and urothelial cells with high staining (HPA tissue IHC). HPA rates the tissue pattern “Enhanced,” while reporting medium consistency between antibody staining and RNA expression (HPA tissue IHC).

What am I looking at on my slide?
Cytoplasmic staining in cortical neurons, fallopian tube or small-intestinal glandular cells, or bladder urothelium.This matches the listed high-staining cells and the general cytoplasmic IHC profile (HPA tissue IHC). Compare cell populations within the section before interpreting intensity: HPA reports staining by cell type, and its reliability description notes only medium consistency with RNA expression (HPA tissue IHC).
Predominantly nuclear staining, with little or no cytoplasmic staining in expected positive cells.This does not match HPA’s general cytoplasmic IHC profile or UniProt’s reported intracellular locations (HPA tissue IHC; UniProt Q9Y2X7 subcellular location). Treat it as a possible staining artefact and check controls before calling it GIT1; these sources do not validate a nuclear IHC pattern.
Strong staining in smooth muscle cells or soft-tissue fibroblasts.HPA lists these cells as “Not detected,” so prominent staining conflicts with its tissue survey (HPA tissue IHC). Consider antibody cross-reactivity or endogenous detection activity, particularly if a reagent-omission control also develops color (general IHC practice); the HPA result is a comparator, not proof that every such cell must be blank.
Diffuse color across tissue, including spaces between cells, obscures cellular boundaries.This distribution cannot establish intracellular GIT1 localization (UniProt Q9Y2X7 subcellular location). Assess nonspecific background with appropriate omission controls and review blocking, washing and chromogen development (general IHC practice). Do not score diffuse deposit as positive cells.
No staining in cortical neurons or another listed high-staining cell population.That is discordant with the reported high IHC staining and calls the run’s sensitivity into question (HPA tissue IHC). Check whether other expected positive cells stain, then examine antibody and detection controls (general IHC practice). A blank section alone cannot establish GIT1 absence.
💡Expected GIT1 appearanceCall a section positive when its listed high-staining cells show discernible chiefly cytoplasmic chromogenic signal—especially cortical neurons, selected glandular cells or urothelium—while predominantly nuclear color or diffuse cell-free deposit prompts control review (HPA tissue IHC; UniProt Q9Y2X7 subcellular location; general IHC practice).
How each factor affects the staining
Cell type and reference intensityHPA reports high staining in cortical neurons, fallopian tube and small-intestinal glandular cells, and bladder urothelial cells; it reports medium staining in several other listed cells and “Not detected” in smooth muscle cells and soft-tissue fibroblasts (HPA tissue IHC). Interpret the sampled cell population, rather than assigning one intensity to an entire organ.
Compartment and cell stateUniProt places GIT1 in cytoplasm and focal adhesions and describes movement between adhesions, cytosolic complexes and membrane protrusions during migration (UniProt Q9Y2X7 subcellular location). HPA summarizes tissue IHC as generally cytoplasmic (HPA tissue IHC); the finer locations are biological context, not separately validated chromogenic IHC patterns.
Antibody evidenceHPA marks HPA004059 IHC “Enhanced” and HPA004186 IHC “Approved” (HPA antibodies). Those are antibody-specific validation labels; the tissue page’s “Enhanced” reliability still carries a medium-consistency description (HPA tissue IHC). Keep the label tied to the antibody and assay used.
IF/ICC cross-check?Yes, as a localization cross-check: HPA supports cytosol and focal adhesion sites and approves an additional mitochondrial location in ICC-IF images from A-431, U-251MG, U2OS and A-549 (HPA subcellular ICC-IF). These IF findings do not establish a mitochondrial IHC staining requirement; IF/ICC workflow belongs in its own guide.
Isoforms, modification and processingUniProt lists three isoforms, multiple phosphorylated residues, one chain spanning residues 1–761, and no signal peptide or propeptide (UniProt Q9Y2X7 isoforms, modified residues and processing). Without an antibody epitope or target-specific retrieval evidence here, these facts do not predict isoform coverage, phospho-dependent staining or retrieval performance.
Why is my staining missing, weak or wrong?
SituationLikely causeNext action
Expected high-staining cells are blank.The result conflicts with the HPA reference pattern, but the tissue survey cannot identify which assay step failed (HPA tissue IHC).Verify the sampled cell type, review the run’s positive and detection controls, and check the antibody working conditions and antigen-retrieval record (general IHC practice). Do not infer a GIT1-specific retrieval setting from the supplied sources.
Only nuclei show strong chromogen.A nuclear-dominant pattern is outside the reported general cytoplasmic IHC profile and listed UniProt locations (HPA tissue IHC; UniProt Q9Y2X7 subcellular location).Review morphology and counterstain, compare omission controls, and reassess staining specificity before scoring cells positive (general IHC practice).
Smooth muscle cells or fibroblasts stain strongly.Those cell populations are listed as “Not detected” in the HPA tissue survey; cross-reactivity or endogenous detection activity is possible (HPA tissue IHC; general IHC practice).Confirm the cell identity and compare no-primary and detection controls; investigate residual endogenous enzyme activity if the chromogenic system uses that enzyme (general IHC practice).
Color covers the section without clear cell boundaries.Diffuse deposit does not resolve the intracellular pattern reported for GIT1 (HPA tissue IHC; UniProt Q9Y2X7 subcellular location).Use omission controls, then review blocking, wash steps and chromogen development for nonspecific signal (general IHC practice). Score only interpretable cellular staining.
A proposed positive control appears weak.HPA reports low staining in salivary glandular cells, cholangiocytes, cardiomyocytes, skeletal myocytes and adipocytes (HPA tissue IHC).Choose a listed high-staining cell population for the positive-control comparison and evaluate the cells specified by HPA, not the tissue as a whole (HPA tissue IHC; general IHC practice).
IF shows puncta at adhesions, but IHC looks broadly cytoplasmic.HPA supports focal adhesion sites in ICC-IF while describing tissue IHC as generally cytoplasmic (HPA subcellular ICC-IF; HPA tissue IHC).Judge the chromogenic section against its IHC cell-type and cytoplasmic pattern; use the separate IF/ICC guide when testing finer subcellular localization (HPA tissue IHC; HPA subcellular ICC-IF).

Sample controls for GIT1 IHC & IF

🧪Run cerebral cortex first; neuronal cells should stain (HPA: High in cerebral cortex neuronal cells). Run smooth muscle as a negative tissue (HPA: Not detected in smooth muscle cells); on the cortex slide, use non-neuronal cells as an internal background comparator only after confirming their negativity, since no cortex cell type is identified as negative in the supplied HPA rows.
Positive control tissue: Cerebral cortex (Neuronal cells, HPA High)
Negative control tissue: Smooth muscle (HPA Not detected)
ICC-IF cell lines (HPA subcellular resource): HPA ICC-IF images show GIT1 in A-431, U-251MG, U2OS, A-549, with annotated localisation: Focal adhesion sites (supported), Cytosol (supported) (HPA subcellular).
Technical controls: Include no-primary (secondary-only) and matched nonimmune rabbit IgG controls (selected-SKU caption: rabbit primary), plus GIT1 knockout material or a cognate-peptide block if available (standard IHC practice). For cortex, check endogenous pigment and block endogenous peroxidase; address endogenous biotin when using streptavidin-biotin detection (selected-SKU caption: SABC/DAB).
⚠️Feasibility: A target-specific fixation window or fixation effect is unreported, and the selected A02140-3 paraffin-section caption does not state the fixative (selected-SKU caption: fixative not stated). The caption uses heat retrieval in EDTA at pH 8.0, but does not establish that retrieval as universally required (selected-SKU caption: EDTA pH 8.0). Whether frozen sections or IF/ICC are easier is unreported; cerebral-cortex lipofuscin can confound DAB scoring and autofluoresce in IF (standard IHC/IF practice).

HPA tissue IHC evidence for GIT1

Comprehensive Human Protein Atlas IHC scoring per tissue (reliability: Enhanced — Medium consistency between antibody staining and RNA expression data.). Rows are taken directly from the HPA tissue chart — click any row's HPA link to view the source.

Positive expression · recommended positive controls

TissueCell typeLevelEvidenceSource
Cerebral cortex Neuronal cells High Protein (IHC) HPA →
Fallopian tube Glandular cells High Protein (IHC) HPA →
Small intestine Glandular cells High Protein (IHC) HPA →
Urinary bladder Urothelial cells High Protein (IHC) HPA →
Adrenal gland Glandular cells Medium Protein (IHC) HPA →

Undetected expression · recommended negative controls

TissueCell typeLevelEvidenceSource
Smooth muscle Smooth muscle cells Not detected Protein (IHC) HPA →
Soft tissue Fibroblasts Not detected Protein (IHC) HPA →
Section 3

Advanced GIT1 IHC Tips

Troubleshoot GIT1 staining in paraffin sections by checking retrieval, intracellular localisation, cell identity and detection controls.

Which retrieval conditions should I try first for weak GIT1 staining?
Start with heat-mediated retrieval in EDTA pH 8.0 (datasheet A02140-3). The catalog antibody detected GIT1 in a paraffin section of human appendiceal adenocarcinoma after that retrieval, followed by 2 μg/ml primary antibody overnight at 4°C (datasheet A02140-3). If staining is weak, first check that sections received consistent heating and cooling, then compare a modest range of retrieval times while keeping detection and section thickness constant (standard IHC practice). Assess signal against a no-primary control and viable tissue morphology, since excessive heating can damage sections and make apparent gains in staining difficult to interpret (standard IHC practice).
Could fixation explain weak or uneven GIT1 staining?
The selected paraffin-section caption does not state a fixative, so target-specific GIT1 sensitivity to fixation is unknown (datasheet A02140-3). Record the fixative, time in fixative and tissue-processing history for each specimen before comparing staining intensity (standard IHC practice). If specimens were processed differently, compare adjacent sections using the same EDTA pH 8.0 retrieval and 2 μg/ml primary concentration reported for this antibody (datasheet A02140-3). Check whether uneven signal follows folds, poorly preserved regions or section edges, and use matched processing and controls before attributing the difference to GIT1 abundance (standard IHC practice).
Where should convincing GIT1 staining appear in tissue sections?
Expect mainly cytoplasmic staining in tissue IHC (HPA: general cytoplasmic expression), with potential enrichment at cell edges consistent with GIT1 recruitment to focal adhesions (UniProt Q9Y2X7 localisation). GIT1 has no transmembrane segment, so a continuous membrane-only outline deserves scrutiny rather than automatic acceptance (UniProt Q9Y2X7 topology). HPA reports high staining in cerebral-cortex neuronal cells and medium staining in appendix glandular cells, useful cell populations for checking localisation (HPA: tissue IHC). Compare the chromogenic pattern with cell boundaries and morphology on the counterstained section, and verify unusual nuclear or extracellular staining using a no-primary control and an independently validated antibody where available (standard IHC practice).
How do isoforms and phosphorylation affect interpretation of this antibody?
GIT1 has 3 annotated isoforms and an Arf-GAP domain at residues 1–124 (UniProt Q9Y2X7 isoforms and domains). Its record also lists multiple modified residues, including phosphotyrosine 224 and phosphoserines 359 and 362 (UniProt Q9Y2X7 modified residues). The supplied caption gives no epitope sequence or isoform specificity for A02140-3, so staining cannot identify a particular isoform or phosphorylation state (datasheet A02140-3; UniProt Q9Y2X7 isoforms). Check the antibody's epitope documentation before making either claim, and use an independently validated isoform- or modification-specific reagent if that distinction is central to the experiment (standard IHC practice).
How should I check GIT1 localisation by multiplex IF?
Use IF as a complementary localisation check to the chromogenic section, pairing GIT1 with a marker of the expected cell type, such as a neuronal marker when examining cerebral cortex (HPA: high in cerebral-cortex neuronal cells). Choose a red or far-red fluorophore after imaging an unstained section to assess tissue autofluorescence, and include single-channel controls when multiplexing (standard IF practice). GIT1 is intracellular and lacks a transmembrane segment, so test gentle permeabilisation for access to a cytosolic epitope; the antibody's exact epitope is not supplied (UniProt Q9Y2X7 topology; datasheet A02140-3). Compare the resulting pattern with the reported cytosol and focal-adhesion localisation, while validating the antibody separately for IF (HPA: subcellular localisation; standard IF practice).
What controls help distinguish GIT1 signal from brown background?
The demonstrated chromogenic method used 10% goat serum blocking, a biotinylated secondary antibody, a streptavidin-biotin complex and DAB (datasheet A02140-3). Include a no-primary section to reveal secondary-reagent or detection-system staining, and check an endogenous-peroxidase block before applying DAB (standard IHC practice). Because this workflow uses biotin-based detection, consider a biotin-blocking control or a biotin-free detection system if background persists (datasheet A02140-3; standard IHC practice). Titrate the primary around the reported 2 μg/ml condition, then compare background with viable-cell cytoplasm rather than counting diffuse deposits, folds or section-edge colour as GIT1 (datasheet A02140-3; HPA: general cytoplasmic expression; standard IHC practice).
How should I quantify GIT1 staining across paraffin sections? ⚠ ANSWER MARKED FOR VERIFICATION
Define the cell population and cytoplasmic compartment before scoring, because GIT1 shows general cytoplasmic tissue expression (HPA: tissue IHC). For a cell-based readout, report the percentage of positive viable target cells and an H-score calculated from intensity grades 0–3, giving a range of 0–300 (standard IHC practice). If cell counts are unreliable, report positive-cell density per mm² of viable annotated tissue instead (standard IHC practice). Normalise each measure to its relevant denominator—target cells counted or viable tissue area—and keep retrieval, imaging and thresholds consistent across specimens; record edge and necrotic regions separately (standard IHC practice).
When is an unexpected GIT1 pattern likely to be artefact?
Treat cytoplasmic staining in appropriately identified cells as more plausible than a nuclear-only or extracellular deposit pattern, given GIT1's reported tissue and subcellular localisation (HPA: general cytoplasmic expression; UniProt Q9Y2X7 localisation). Check cell identity: HPA reports high staining in cerebral-cortex neuronal cells but no detected staining in smooth-muscle cells (HPA: tissue IHC). Signal restricted to section edges, folds or necrotic tissue should prompt a review of morphology and processing before biological interpretation (standard IHC practice). If brown colour persists in a no-primary control, examine endogenous enzyme activity and detection reagents; interpret differences in GIT1 only after those controls and matched-section staining support them (standard IHC practice).
Boster reagents

Best GIT1 / ARF GTPase-activating protein GIT1 IHC Antibodies

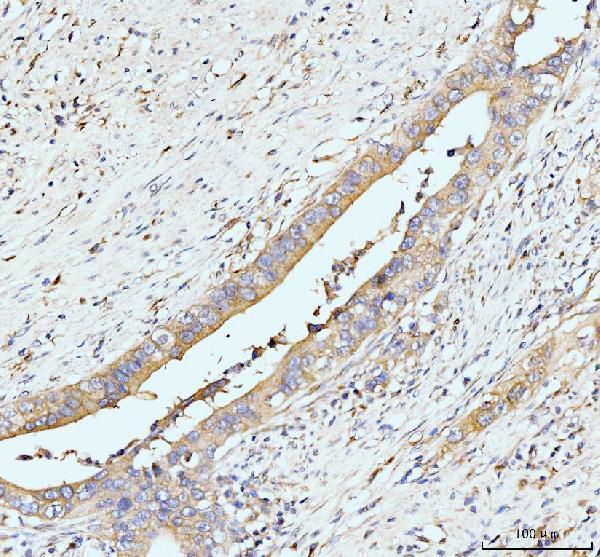
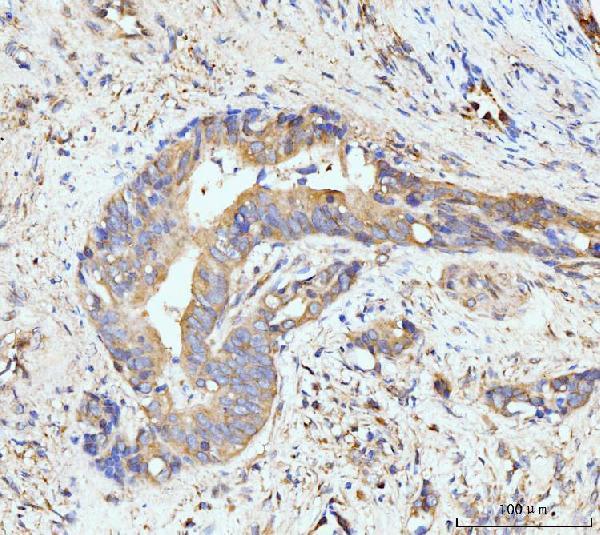
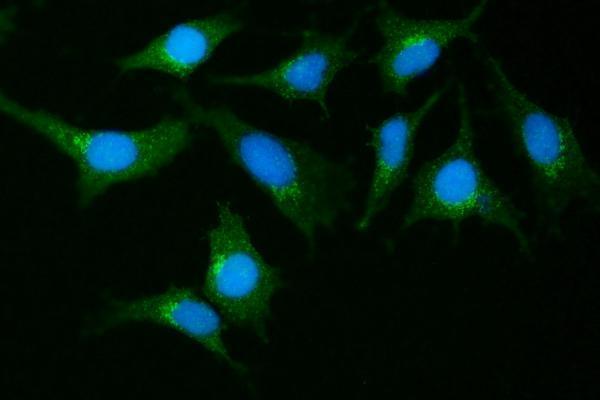
A02140-3 has IHC images from human paraffin sections and an IF image from A549 cells (catalog image captions); its listed reactivity covers human, mouse and rat (catalog: reactivity).

Real IHC data IHC analysis of GIT1 using anti-GIT1 antibody (A02140-3). GIT1 was detected in a paraffin-embedded section of human appendiceal adenocarcinoma tissue. Heat mediated antigen retrieval was performed in EDTA buffer (pH 8.0, epitope retrieval solution). The tissue section was blocked with 10% goat serum. The tissue section was then incubated with 2 μg/ml rabbit anti-GIT1 Antibody (A02140-3) overnight at 4°C. Biotinylated goat anti-rabbit IgG was used as secondary antibody and incubated for 30 minutes at 37°C. The tissue section was developed using Strepavidin-Biotin-Complex (SABC) (Catalog # SA1022) with DAB as the chromogen.
Anti-GIT1 Antibody ®
Cat # A02140-3

A02140-3 has IHC images from human appendiceal adenocarcinoma, gall bladder adenosquamous carcinoma, gastric adenocarcinoma and liver cancer paraffin sections (catalog: IHC image captions). A02140-3 also has an IF image from A549 cells (catalog: IF image caption); its listed applications include IHC, ICC and IF (catalog: applications).

Which to pick: Choose A02140-3 for paraffin-section IHC because its own IHC captions document that preparation (catalog: IHC image captions); the fixative is unreported (catalog: IHC image captions). The same SKU is listed for IF/ICC and has an A549 IF image (catalog: applications; IF image caption). For cross-species work, A02140-3 lists human, mouse and rat reactivity, while the supplied IHC images document human samples (catalog: reactivity; IHC image captions).

Each figure is that product's own IHC / IF validation image from its datasheet.

References

  1. UniProt Consortium. UniProt entry Q9Y2X7 (GIT1_HUMAN, ARF GTPase-activating protein GIT1).
  2. Human Protein Atlas. GIT1 tissue IHC expression (reliability: Enhanced).
  3. Human Protein Atlas. GIT1 subcellular location (ICC-IF): Mainly localized to the cytosol and focal adhesion sites. In addition localized to the mitochondria..
  4. Human Protein Atlas. GIT1 antibody validation summary (2 antibodies).
  5. GIT1 is a novel prognostic biomarker and facilitates tumor progression via activating ERK/MMP9 signaling in hepatocellular carcinoma. OncoTargets and therapy 2015 — PMC4689273.
  6. G protein coupled receptor kinase 2 interacting protein 1 (GIT1) is a novel regulator of mitochondrial biogenesis in heart. Journal of molecular and cellular cardiology 2011 — PMC3367479.
  7. MAT2B-GIT1 interplay activates MEK1/ERK 1 and 2 to induce growth in human liver and colon cancer. Hepatology (Baltimore, Md.) 2013 — PMC3642222.
  8. GIT1 overexpression promotes epithelial-mesenchymal transition and predicts poor prognosis in hepatocellular carcinoma. Bioengineered 2021 — PMC8806235.
  9. PubMed PMID:10896954 — UniProt-cited evidence.
  10. PubMed PMID:14702039 — UniProt-cited evidence.
  11. PubMed PMID:16625196 — UniProt-cited evidence.