This website uses cookies to ensure you get the best experience on our website.


- Table of Contents
Plan chromogenic HADHB IHC on paraffin sections with the catalog antibody at 2–5 μg/mL (datasheet A04776-2). Compare high staining in colon glandular cells with undetected bone-marrow hematopoietic cells, and score the mitochondrial pattern (HPA tissue IHC).

Expected localisation, validated protocols, controls and antibodies — the at-a-glance facts below, then the full design guide.
| Expected localisation | Mitochondrial staining in glandular cells (HPA tissue IHC) | |
| Staining pattern | Glandular-cell mitochondrial staining; germinal and non-germinal centers included (HPA tissue IHC) | |
| Antigen retrieval | EDTA pH 8.0 HIER, heat-mediated (datasheet A04776-2) | |
| Positive control | Colon+4 more · see all | |
| Negative control | Bone marrow+2 more · see all |
| Fixation | Keep fixation consistent across sections (standard IHC practice; not target-specific) | |
| Caveat | Skeletal myocytes stain low despite enhanced tissue RNA (HPA tissue IHC; HPA tissue RNA) | |
| Regulation | RNA enhanced: heart, skeletal muscle, tongue (HPA tissue RNA) | |
| Isoform / epitope | 2 isoforms; chain 34–474; epitope map unreported (UniProt) |
The catalog antibody’s IHC-P protocol is followed by 3 published HADHB IHC protocols from paraffin sections (datasheet A04776-2; PMC6350214; PMC9743170; PMC12394106).
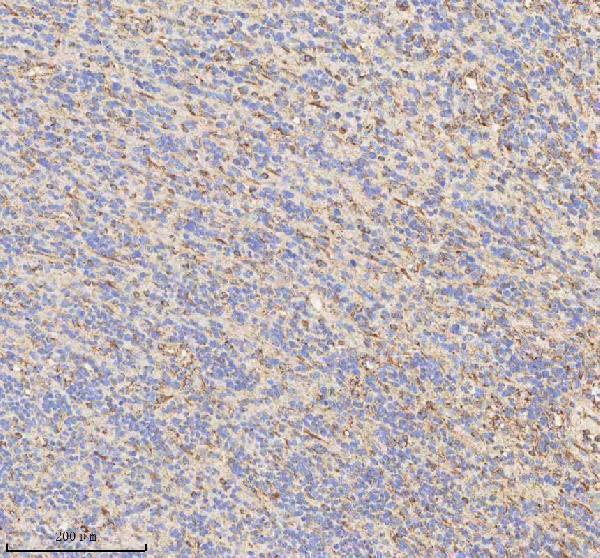
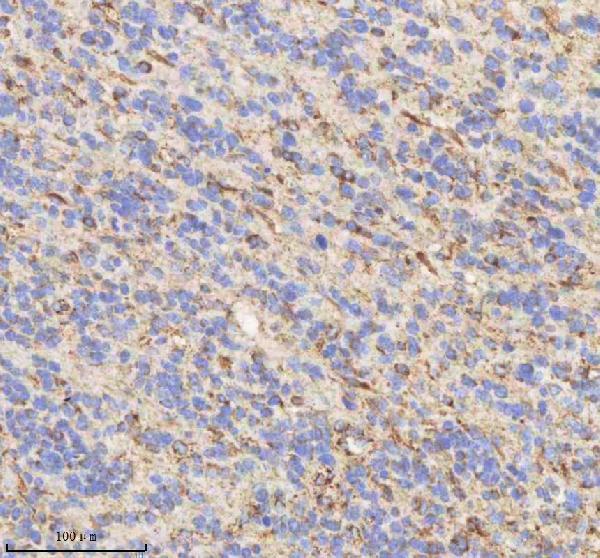
| Sample | Paraffin-embedded human glioblastoma tissue; fixative not specified (datasheet A04776-2) |
| Fixation | Image fixative and duration unreported (datasheet A04776-2); verify before use. |
| Sectioning | 4–5 µm sections on charged slides (standard) |
| Deparaffinisation | Xylene, graded ethanol series to water (standard) |
| Antigen retrieval | Heat retrieval: EDTA pH 8.0 (datasheet A04776-2); 20 min, 95–100 °C (standard) |
| Peroxidase block | 3% H2O2, 10 min, room temperature (standard) |
| Blocking | 10% goat serum (datasheet A04776-2) |
| Primary antibody | Rabbit anti-HADHB, 2-5 μg/ml (datasheet A04776-2) |
| Primary incubation | Overnight at 4 °C (datasheet A04776-2) |
| Detection | HRP-conjugated secondary, DAB chromogen (datasheet A04776-2) |
| Counterstain | Hematoxylin, blue, dehydrate and mount (standard) |
| Expected result | HADHB-positive staining in glandular cells of colon (HPA tissue IHC: High). HPA tissue profile: Mitochondrial expression in glandular cells, also including germinal and non-germinal centers. No signal in the no-primary control. |
HADHB should appear mainly in mitochondria, often as granular cytoplasmic staining (HPA: mitochondrial tissue profile; UniProt P55084: mitochondrial localization). High staining is reported in colon, duodenal, gallbladder, salivary gland and small-intestinal glandular cells, kidney tubular cells, lung alveolar type II cells, and skin endothelial cells (HPA: tissue IHC). HPA rates the tissue profile Enhanced, with medium consistency between staining and RNA data (HPA: reliability). HADHB has no transmembrane segment (UniProt P55084: topology).
| Granular cytoplasmic chromogen in colon glandular cells or kidney tubular cells. | This fits mitochondrial HADHB staining in cell types scored High by tissue IHC (HPA: colon glandular cells; kidney tubular cells). Assess granules within identifiable cells rather than judging overall section color (standard IHC practice). |
| Predominantly nuclear staining, or an exclusively smooth cell-border outline. | These patterns do not match the mainly mitochondrial localization (HPA: subcellular IF; UniProt P55084: localization). Review morphology, antibody specificity and detection controls before calling them HADHB; UniProt also annotates membrane association and endoplasmic reticulum localization (UniProt P55084: localization). |
| Strong staining confined to cells expected to be unstained, such as bone-marrow hematopoietic cells. | HPA reports HADHB not detected in that cell population (HPA: bone marrow IHC). Consider cross-reactivity or endogenous detection activity; neither can be diagnosed from appearance alone (standard IHC practice). |
| Diffuse color across cells and surrounding tissue, obscuring intracellular granules. | The expected mitochondrial pattern cannot be scored confidently (HPA: mitochondrial tissue profile). Check whether background persists in detection controls, then review antibody dilution, blocking, washing and chromogen development (standard IHC practice). |
| No signal in a colon glandular-cell or kidney tubular-cell control. | Both are reported High by HPA, so a blank control calls the staining run into question (HPA: tissue IHC). Verify tissue morphology, retrieval, primary-antibody application and detection before interpreting a test section as negative (standard IHC practice). |
| Tissue and cell selection | Use the reported cell type, not the organ name alone: colon glandular cells and kidney tubular cells are High, while bone-marrow hematopoietic cells are not detected (HPA: tissue IHC). |
| RNA versus protein readout | Skeletal muscle is RNA-enhanced but its myocytes have Low IHC staining; RNA enrichment alone cannot set an IHC intensity threshold (HPA: RNA specificity; skeletal-muscle tissue IHC). |
| Subcellular interpretation | Mitochondria are the main supported IF location; UniProt also lists mitochondrial inner and outer membranes and endoplasmic reticulum (HPA: subcellular IF; UniProt P55084: localization). Bright-field IHC cannot resolve those membrane assignments (standard IHC practice). |
| Protein context | HADHB complexes with HADHA, which is required for its stability and membrane association (UniProt P55084: subunit; localization note). This biological context does not establish a specific change in paraffin-section staining. |
| Antibody validation | HPA lists HPA037540 as IHC Enhanced and HPA037539 as IHC Supported; HPA066099 has no listed IHC status (HPA: antibody validation). Match the validation record to the antibody actually used. |
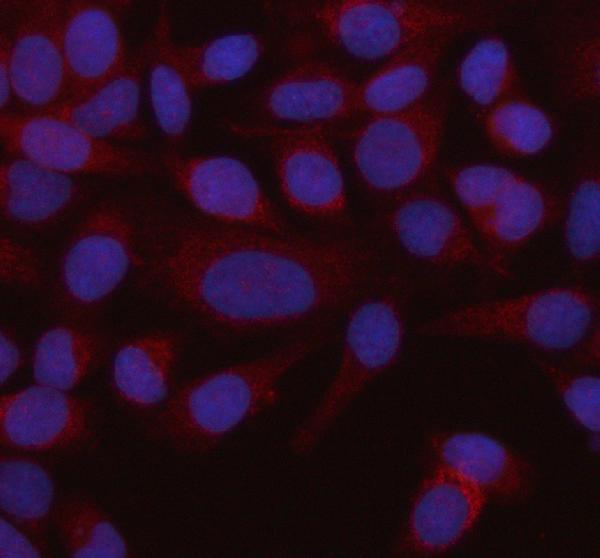
| Q: Does the IF/ICC image predict the chromogenic IHC result? | A: It supports a mainly mitochondrial location, but IF/ICC and paraffin IHC have separate antibody-validation records and readouts (HPA: subcellular IF; HPA: antibody validation). Use the IF/ICC guide for that application. |
| Situation | Likely cause | Next action |
|---|---|---|
| The positive-control section is blank. | A staining-run problem is possible because colon glandular cells and kidney tubular cells are reported High (HPA: tissue IHC). The section alone cannot identify the failed step. | Confirm the control contains the stated cells, then check the documented retrieval, primary-antibody application and detection steps (standard IHC practice). |
| Most of the section has a diffuse brown haze. | Diffuse background can obscure the mitochondrial pattern (HPA: tissue profile). Excess detection signal or nonspecific staining are possibilities (standard IHC practice). | Compare an appropriate detection control and review blocking, washing, antibody dilution and chromogen development (standard IHC practice). |
| Strong nuclear color dominates positive-looking cells. | The dominant pattern conflicts with HPA's mainly mitochondrial localization (HPA: subcellular IF). Morphology alone cannot prove which reagent caused it. | Check nuclear counterstain versus chromogen, inspect control sections and reassess antibody specificity before scoring HADHB (standard IHC practice). |
| Bone-marrow hematopoietic cells stain strongly. | That population is reported not detected by HPA; cross-reactivity or endogenous detection activity is possible (HPA: bone-marrow IHC; standard IHC practice). | Compare a primary-antibody omission control and review the detection-system controls before accepting the signal (standard IHC practice). |
| Skeletal-muscle myocytes stain weakly despite RNA enrichment. | This can agree with HPA's Low myocyte IHC score even though skeletal muscle is RNA-enhanced (HPA: tissue IHC; RNA specificity). | Judge the run against a reported high-staining cell population and its morphology, rather than RNA enrichment alone (HPA: colon or kidney tissue IHC; standard IHC practice). |
| A weak region is being called HADHB-negative. | HPA records different staining levels by cell type, including Low and not detected categories (HPA: tissue IHC). Weak color without a working control is inconclusive (standard IHC practice). | Score the specified cell population, compare the same run's positive and detection controls, and report uncertainty if separation remains unclear (standard IHC practice). |
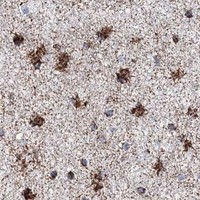
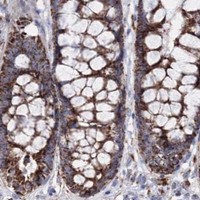
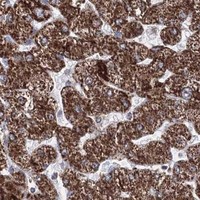
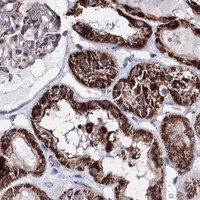


Comprehensive Human Protein Atlas IHC scoring per tissue (reliability: Enhanced — Medium consistency between antibody staining and RNA expression data.). Rows are taken directly from the HPA tissue chart — click any row's HPA link to view the source.
| Tissue | Cell type | Level | Evidence | Source |
|---|---|---|---|---|
| Colon | Glandular cells | High | Protein (IHC) | HPA → |
| Duodenum | Glandular cells | High | Protein (IHC) | HPA → |
| Gallbladder | Glandular cells | High | Protein (IHC) | HPA → |
| Kidney | Cells in tubules | High | Protein (IHC) | HPA → |
| Lung | Alveolar cells type II | High | Protein (IHC) | HPA → |
HADHB staining in paraffin sections should be assessed against its predominantly mitochondrial localisation and the cell types reported to express it (UniProt P55084; HPA tissue IHC).
A04776-2 has IHC data from paraffin-embedded human glioblastoma and liver cancer sections (catalog IHC captions), plus IF data from HeLa cells (catalog IF caption). Listed reactivity includes human, mouse, and rat (catalog reactivity).
A04776-2 is listed for IHC and IF/ICC (catalog applications). Its IHC images show human glioblastoma and liver cancer sections (catalog IHC captions), and its IF image shows HeLa cells (catalog IF caption).
Which to pick: For tissue IHC, choose A04776-2: its captions document paraffin-embedded human sections with EDTA retrieval at pH 8.0 and 2 μg/ml primary antibody; the fixative is unreported (catalog IHC captions). For IF/ICC, A04776-2 has an image from HeLa cells using 5 μg/ml primary antibody (catalog IF caption). For mouse or rat samples, A04776-2 lists those species as reactive, but the supplied IHC and IF images document human samples only (catalog reactivity; catalog image captions).