MT-CYB / Cytochrome b · Western blot design guide

Design a Western Blot for MT-CYB

Source-linked MT-CYB Western blot protocol options, expected-band and isoform facts, troubleshooting for weak or shifted signal, and recommended anti-MT-CYB WB antibodies. Everything you need to plan the experiment before you commit precious samples.

Evidence assembled September 2026 · For research use; verify linked source records and product datasheet before use
Western blot protocol sheet for MT-CYB: expected band ~42.7 kDa, hero antibody A03737-2, catalog values and labelled standard workflow; separate PMC comparisons on the guide
Printable MT-CYB Western blot protocol sheet — expected band ~42.7 kDa, antibody A03737-2, controls and PMC citations. Open the full MT-CYB WB guide →

MT-CYB Western Blot Experimental Design Guide

Expected bands, source-linked protocol options, controls and antibodies — the at-a-glance facts below, then the full design guide.

Must know before running
Expected band ~42.7 kDa
Observed band ~43 kDa
Gel 10% (catalog A03737-2)
Positive control ⓘ Parathyroid gland (IHC candidate; verify WB) +4 more
Negative control ⓘ Bone marrow (IHC candidate; verify WB)
Important caveats
Reasons your observed band may differ from the expected size.
PTM —
Caveat —
Gene-set association MSigDB C7 membership
Isoform 1 isoform(s)
Section 1

Source-Linked MT-CYB Western Blot Protocol Options

The A03737-2 protocol combines labelled catalog values with standard starting conditions. Published comparisons retain their own sample, reagent and detection scope.

Recommended Western blot protocol parameters
Sample / lysatehuman HepG2, human MDA-MB-231, human PC-3 (catalog A03737-2)
Gel %10% (catalog A03737-2)
Load30 ug; reducing conditions (catalog A03737-2)
Transfera nitrocellulose membrane at 150 mA for 50-90 minutes (catalog A03737-2)
Membranenitrocellulose membrane (catalog A03737-2)
Blocking5% non-fat milk/TBS for 1.5 hour at RT (catalog A03737-2)
Primary antibodyA03737-2 · 1:1000 (catalog A03737-2)
Primary incubationovernight at 4°C (catalog A03737-2)
Secondary antibodygoat anti-rabbit IgG-HRP, 1:5000 (catalog A03737-2)
Secondary incubation1.5 hour at RT (catalog A03737-2)
WashTBS-0.1%Tween 3 times with 5 minutes each (catalog A03737-2)
DetectionECL (catalog A03737-2)
Section 2

What Is the Expected MT-CYB Western Blot Band Size?

MT-CYB is predicted at 42.7 kDa and observed near 43 kDa; the supplied evidence does not establish a cause for the small difference.

What am I looking at on my blot?
Band near 43 kDa in whole-cell lysateMatches the reported MT-CYB band and its 42.7 kDa predicted mass
Band near 43 kDa in a mitochondrial fractionConsistent with MT-CYB in the mitochondrial inner membrane
Weak band near 43 kDa in whole-cell lysateThe inner-membrane protein may be poorly represented or recovered
Little or no band near 43 kDa in a cytosolic fractionConsistent with mitochondrial inner-membrane localization
💡Expected MT-CYB appearanceMT-CYB has a predicted mass of 42.7 kDa and an observed band at approximately 43 kDa in reducing whole-cell blots; confirm band identity with appropriate controls.
How each factor affects band size
Predicted molecular mass of 42.7 kDaAgrees with the observed band near 43 kDa
380-amino-acid sequenceDefines the reported full-length mass; no cleavage-related size change is listed
Mitochondrial inner-membrane localizationMay affect recovery, with no size shift established
Multi-pass membrane topologyNo distinct migration shift is established by the supplied evidence
Why is my band missing or off?
SituationLikely causeNext action
No band in lysateMT-CYB is a mitochondrial inner-membrane proteinCheck a mitochondrial fraction and confirm membrane-protein recovery
Weak or no signalPoor recovery or transfer of this multi-pass membrane proteinCheck solubilization, transfer, and a positive-control lysate
Band higher than expectedThe listed features do not establish a higher-mass speciesCompare with the reported 43 kDa band and verify identity using a positive control
Band lower than expectedNo signal-peptide or propeptide cleavage is listedCheck sample integrity and verify the band with an independent antibody
Multiple bandsThe supplied record lists no alternate isoforms or size-changing modificationsIdentify the 43 kDa band using a positive control and assess other bands for nonspecific binding

Sample controls for MT-CYB Western blot

🧪HPA-IHC candidate guidance (verify in WB): For positive controls for MT-CYB in Western blot, you can use parathyroid gland tissue, where HPA reports high expression.
Positive control: Parathyroid gland (IHC candidate; verify WB)
Negative control: Bone marrow (IHC candidate; verify WB)
Loading controls: Run GAPDH, β-actin, and a total-protein stain such as Ponceau alongside the samples.
⚠️Feasibility: As a multi-pass inner-mitochondrial-membrane protein, MT-CYB may require effective membrane solubilization for a clear signal.

HPA tissue expression evidence for MT-CYB

Comprehensive Human Protein Atlas IHC scoring per tissue. Rows are taken directly from the HPA tissue chart — click any row's HPA link to view the source.

Higher expression tissues · candidate positive controls from IHC

TissueCell typeLevelEvidenceSource
Parathyroid gland glandular cells High Protein (IHC) HPA →
Adrenal gland glandular cells Medium Protein (IHC) HPA →
Appendix glandular cells Medium Protein (IHC) HPA →
Breast glandular cells Medium Protein (IHC) HPA →
Bronchus respiratory epithelial cells Medium Protein (IHC) HPA →

Lower expression tissues · IHC evidence, not confirmed WB-negative controls

TissueCell typeLevelEvidenceSource
Bone marrow hematopoietic cells Not detected Protein (IHC) HPA →
Epididymis glandular cells Not detected Protein (IHC) HPA →
Ovary ovarian stroma cells Not detected Protein (IHC) HPA →
Vagina squamous epithelial cells Not detected Protein (IHC) HPA →
Adipose tissue adipocytes Low Protein (IHC) HPA →
Section 3

Advanced MT-CYB Western Blot Tips

Deeper troubleshooting and optimisation questions for MT-CYB, answered from its protein features.

How should MT-CYB band migration be interpreted?
Band shift · Use the separately labelled calculated mass and catalog-observed evidence above. A sequence annotation does not establish an observed migration shift. Verify target identity with orthogonal controls.
Could an isoform explain another band?
Isoforms · The supplied UniProt record lists one isoform and no alternative sequence. It provides no isoform-based explanation for an additional band; check band identity before assigning one.
Do annotated modifications prove a band shift?
PTM · The linked UniProt record describes protein features. A modification annotation alone does not demonstrate a visible shift; retain any condition or experimental qualifier attached to it.
Does this guide establish induction of MT-CYB?
Induction · No general induction response is established by this guide. A pathway or gene-set association is not evidence of induction in a particular specimen. Verify the relevant treatment and control in a target-specific experiment.
What transfer method to use for MT-CYB Western blot?
Transfer · MT-CYB is a multi-pass mitochondrial inner-membrane protein. The supplied features do not specify a transfer method. Check whether the approximately 43 kDa band transfers efficiently under your chosen conditions, including whether protein remains in the gel.
How should blocking be optimized for MT-CYB?
Blocking · The supplied features specify no preferred blocker. Compare blocking conditions using background near 43 kDa and the clarity of the target band as practical readouts.
How should MT-CYB bands be quantified?
Quantitation · Quantify the approximately 43 kDa band within the assay's linear range and use a consistent normalization method across samples. MT-CYB resides in the mitochondrial inner membrane, so changes in its signal can reflect changes in mitochondrial abundance as well as MT-CYB abundance per mitochondrion.
Should MT-CYB migrate at its predicted mass?
Interpretation · Its predicted mass is 42.7 kDa, and the supplied observed band is approximately 43 kDa. Their agreement supports the assignment, but apparent mass alone cannot establish band identity.

MT-CYB is part of the 11-subunit cytochrome bc1 complex and is a multi-pass membrane protein. Those features make association with other proteins relevant to investigate, but they do not establish the identity of a higher band. Confirm its identity experimentally rather than assigning it from size alone.
Boster reagents

MT-CYB Western Blot Antibodies

Catalog antibodies with Western blot application and product-specific WB images. Evaluate suitability with the reported sample, controls and experimental conditions.

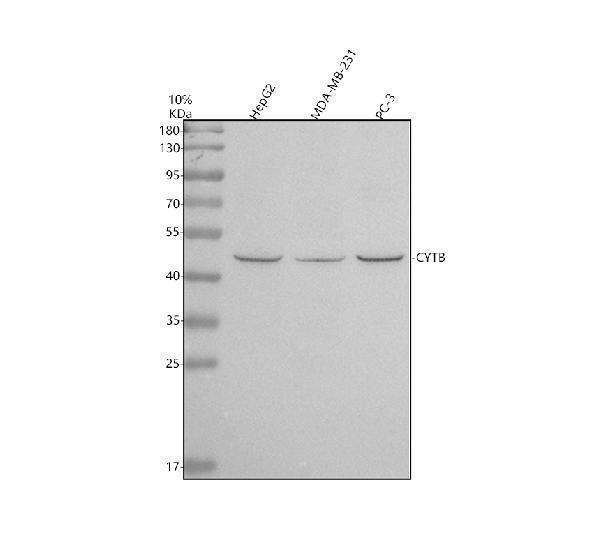
Real WB data Western blot analysis of CYTB using anti-CYTB antibody (A03737-2). Electrophoresis was performed on a 10% SDS-PAGE gel at 80V (Stacking gel) / 120V (Resolving gel) for 2 hours. The sample well of each lane was loaded with 30 ug of sample under reducing conditions. Lane 1: human HepG2 whole cell lysates, Lane 2: human MDA-MB-231 whole cell lysates, Lane 3: human PC-3 whole cell lysates. After electrophoresis, proteins were transferred to a nitrocellulose membrane at 150 mA for 50-90 minutes. Blocked the membrane with 5% non-fat milk/TBS for 1.5 hour at RT. The membrane was incubated with rabbit anti-CYTB antigen affinity purified polyclonal antibody (A03737-2) at 1:1000 overnight at 4°C, then washed with TBS-0.1%Tween 3 times with 5 minutes each and probed with a goat anti-rabbit IgG-HRP secondary antibody at a dilution of 1:5000 for 1.5 hour at RT. The signal is developed using an ECL Plus Western Blotting Substrate (Catalog # AR1196-200) with Tanon 5200 system. A specific band was detected for CYTB at approximately 43 kDa. The expected band size for CYTB is at 43 kDa.
Anti-CYTB/MT-CYB Antibody
Cat # A03737-2
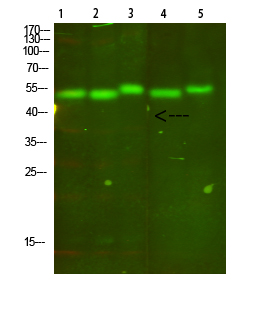
Real WB data Western Blot analysis of 1, mouse-lung 2, mouse-brain 3, mouse-spleen 4, mouse-kidney 5, mouse-heart cells using primary antibody diluted at 1:500 (4°C overnight). Secondary antibody:Goat Anti-rabbit IgG IRDye 800 ( diluted at 1:5000, 25°C, 1 hour)
Anti-Cytochrome b MT-CYB Antibody
Cat # A03737

Both listed anti-MT-CYB antibodies have Western blot images. A03737-2 shows an approximately 43 kDa band in three human cell lysates; A03737 shows mouse tissue lanes. These images document those tested samples, not every listed species.

Which to pick: For human samples, A03737-2 has a human lysate image. For mouse tissues, A03737 has a mouse tissue image. Only A03737-2 lists rat reactivity, but neither supplied caption shows rat samples.

Source: BosterBio MT-CYB gene-info card — filtered to Western-blot-capable antibodies; each card shows that product's actual WB validation figure.