This website uses cookies to ensure you get the best experience on our website.


- Table of Contents
Plan MTHFD1L staining in paraffin sections using the reported cytoplasmic tissue pattern (HPA tissue IHC) and mitochondrial annotation (UniProt). Compare high-staining colon glandular cells with low-staining prostate glandular cells, while accounting for the atlas warning that staining may reflect proteins from more than one gene (HPA tissue IHC).

Expected localisation, validated protocols, controls and antibodies — the at-a-glance facts below, then the full design guide.
| Expected localisation | Cytoplasmic tissue staining (HPA tissue IHC); mitochondrial protein (UniProt) | |
| Staining pattern | Glandular cells show cytoplasmic staining; texture unspecified (HPA tissue IHC) | |
| Antigen retrieval | EDTA pH 8.0 HIER, heat-mediated (datasheet A06289-1) | |
| Positive control | Appendix+4 more · see all | |
| Negative control | None in HPA (detected in all 45 tissues); use no-primary + isotype controls |
| Fixation | Keep fixation consistent across sections. (standard IHC practice; not target-specific) | |
| Caveat | Staining may reflect proteins from more than one gene (HPA tissue IHC) | |
| Regulation | Upregulated in colon adenocarcinoma (UniProt) | |
| Isoform / epitope | Two isoforms; epitope differences are unreported (UniProt) |
The catalog antibody uses EDTA pH 8.0 retrieval (datasheet A06289-1). The published IHC protocols below cover colorectal cancer, melanoma and bladder tissue (PMC7196253; PMC5403766; PMC6700437).
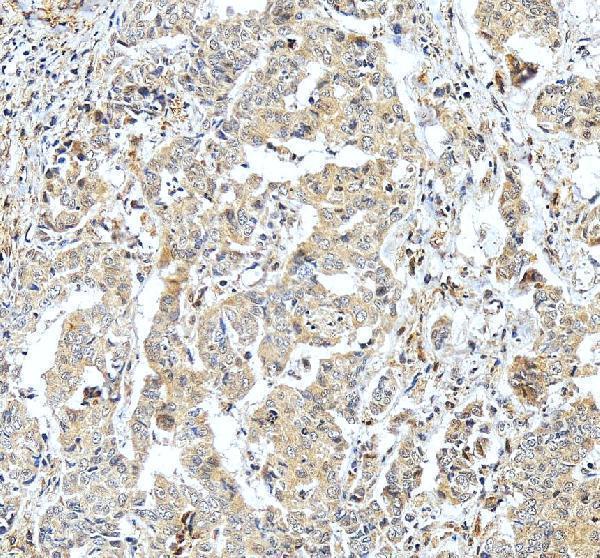
| Sample | Paraffin-embedded human liver cancer tissue; fixative not specified (datasheet A06289-1) |
| Fixation | Image fixative and duration unreported (datasheet A06289-1); verify before use. |
| Sectioning | 4–5 µm sections on charged slides (standard) |
| Deparaffinisation | Xylene, graded ethanol series to water (standard) |
| Antigen retrieval | Heat retrieval: EDTA pH 8.0 (datasheet A06289-1); 20 min, 95–100 °C (standard) |
| Peroxidase block | 3% H2O2, 10 min, room temperature (standard) |
| Blocking | 10% goat serum (datasheet A06289-1) |
| Primary antibody | Rabbit anti-MTHFD1L, 2-5 μg/ml (datasheet A06289-1) |
| Primary incubation | Overnight at 4 °C (datasheet A06289-1) |
| Detection | HRP-conjugated secondary, DAB chromogen (datasheet A06289-1) |
| Counterstain | Hematoxylin, blue, dehydrate and mount (standard) |
| Expected result | MTHFD1L-positive staining in glandular cells of appendix (HPA tissue IHC: High). HPA tissue profile: General cytoplasmic expression. No signal in the no-primary control. |
MTHFD1L localises to mitochondria (UniProt Q6UB35; HPA ICC-IF) and should appear within the cytoplasm of expressing cells in IHC. HPA reports high staining in several glandular epithelia, kidney tubules, hepatocytes and respiratory epithelium (HPA tissue IHC). Its tissue IHC profile is Approved, with a caution that the antibody may target proteins from more than one gene; external verification is pending (HPA tissue IHC).
| Cytoplasmic staining in colon or appendix glandular cells, or kidney tubular cells. | This fits HPA's reported high staining in those cells (HPA tissue IHC). A mitochondrial protein can appear as cytoplasmic signal in a chromogenic section (UniProt Q6UB35; standard IHC interpretation); IHC alone does not prove mitochondrial localisation. |
| Predominantly nuclear, membrane-rim or extracellular staining. | These compartments do not fit the reported mitochondrial location (UniProt Q6UB35; HPA ICC-IF). Review the counterstain and compare controls before calling the signal MTHFD1L; an unexpected compartment raises concern for artefact or nonspecific staining. |
| Strong staining in a cell population reported as low, while the expected cells are weak. | For example, HPA reports low staining in adipocytes and smooth muscle cells (HPA tissue IHC). This mismatch warrants a specificity check with controls or another antibody; endogenous chromogen activity can also produce misleading signal (standard IHC practice). |
| Similar diffuse colour across cells and surrounding tissue, with little cellular distinction. | That pattern does not match HPA's cell-specific high staining examples (HPA tissue IHC). Assess nonspecific background, detection chemistry and section quality with appropriate controls (standard IHC practice); diffuse colour alone is not evidence of MTHFD1L. |
| No staining in the expected cells of a known-positive section. | Check the tissue identity first: HPA reports high staining in colon glandular cells and kidney tubules (HPA tissue IHC). If controls also fail, review antibody dilution, antigen retrieval and detection steps (standard IHC practice); absence on one slide cannot establish absent protein. |
| Location and topology | MTHFD1L is mitochondrial and has no annotated transmembrane segment (UniProt Q6UB35). Interpret chromogenic cytoplasmic staining with the cell type and controls; a membrane outline is not the predicted pattern. |
| Tissue context | HPA reports high hepatocyte IHC staining, while UniProt describes low liver expression (HPA tissue IHC; UniProt Q6UB35). Treat these as differing observations, and compare matched control sections rather than assuming either source predicts every specimen. |
| Antibody specificity | The tissue IHC profile is Approved but carries a more-than-one-gene targeting caution (HPA tissue IHC). Listed antibodies have Approved IHC status; none is listed as IHC Enhanced (HPA antibodies). Interpret unexpected positives conservatively. |
| Processing and variants | UniProt lists a mature chain spanning residues 32–978 and two isoforms (UniProt Q6UB35). These annotations alone do not predict staining intensity or establish whether a particular antibody recognises both isoforms; check the antibody's documented epitope if relevant. |
| IF/ICC Q: What pattern should be expected? | A: HPA reports enhanced mitochondrial localisation in ICC-IF and lists A-431, U-251MG, U2OS and MCF-7 images (HPA ICC-IF). Use that as localisation context; it does not set an IHC staining threshold or provide an IHC protocol. |
| Situation | Likely cause | Next action |
|---|---|---|
| Nuclear staining dominates an otherwise positive section. | The compartment conflicts with mitochondrial localisation (UniProt Q6UB35; HPA ICC-IF); the observed colour may be nonspecific or misread against the counterstain. | Compare the antibody-treated section with its detection control, then reassess the compartment at higher magnification (standard IHC practice). |
| Adipocytes or smooth muscle stain more strongly than nearby expected positive cells. | HPA reports low staining in these cells (HPA tissue IHC). Cross-reactivity or endogenous detection activity is possible (standard IHC practice). | Include an antibody-omission control and an independently validated antibody when available; inspect whether the same cells remain coloured (standard IHC practice). |
| Colour is widespread and obscures cell boundaries. | Diffuse background can arise from nonspecific binding or the chromogenic detection system (standard IHC practice); it is difficult to compare with HPA's cell-specific observations (HPA tissue IHC). | Check blocking, washes and detection controls, then score only distinguishable cellular signal (standard IHC practice). |
| Colon glandular cells or kidney tubules show no detectable signal. | These are reported as high in HPA tissue IHC (HPA tissue IHC); a failed staining run or specimen difference may explain the result (standard IHC practice). | Verify tissue and controls, then review the catalog antibody's IHC-P dilution, retrieval and detection instructions before repeating the run (standard IHC practice). |
| Hepatocyte staining seems unexpectedly strong or weak. | HPA reports high hepatocyte IHC staining, whereas UniProt reports low liver expression (HPA tissue IHC; UniProt Q6UB35); the sources do not supply a universal intensity cutoff. | Record the observed cell type and intensity, and compare sections processed in the same run (standard IHC practice). |
| A positive signal appears only with one antibody. | HPA cautions that its tissue IHC profile may target proteins from more than one gene, with external verification pending (HPA tissue IHC). | Review the controls and compare an independently validated antibody where available; report any disagreement rather than assigning every positive cell to MTHFD1L (standard IHC practice). |


Comprehensive Human Protein Atlas IHC scoring per tissue (reliability: Approved — Caution, targets protein from more than one gene. Pending external verification.). Rows are taken directly from the HPA tissue chart — click any row's HPA link to view the source.
| Tissue | Cell type | Level | Evidence | Source |
|---|---|---|---|---|
| Appendix | Glandular cells | High | Protein (IHC) | HPA → |
| Colon | Glandular cells | High | Protein (IHC) | HPA → |
| Duodenum | Glandular cells | High | Protein (IHC) | HPA → |
| Endometrium | Glandular cells | High | Protein (IHC) | HPA → |
| Kidney | Cells in tubules | High | Protein (IHC) | HPA → |
| Tissue | Cell type | Level | Evidence | Source |
|---|---|---|---|---|
| None in HPA: MTHFD1L is detected in all 45 scored tissues. Use a no-primary (secondary-only) and an isotype control instead. | ||||
Troubleshoot MTHFD1L staining in paraffin sections by checking retrieval, signal location and tissue controls before comparing expression across samples.
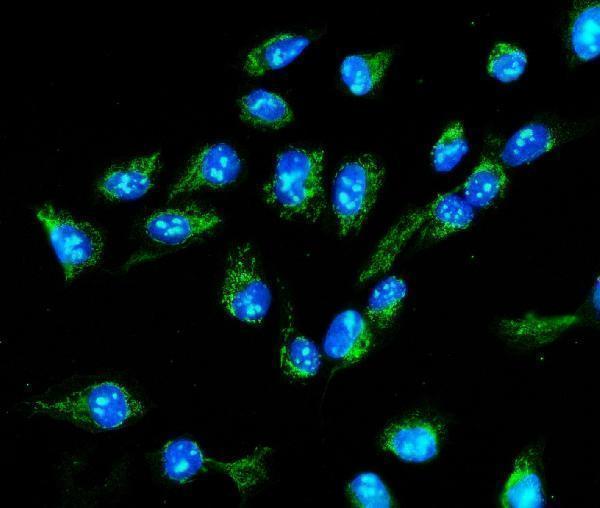
A06289-1 has IHC data from a paraffin-embedded human liver cancer section and IF data from U20S cells (catalog image captions). Its listed reactivity covers human, mouse and rat (catalog: reactivity).
A06289-1 is listed for IHC and IF, with human, mouse and rat reactivity (catalog: applications and reactivity). Its images show IHC in a paraffin-embedded human liver cancer section and IF in U20S cells (catalog image captions).
Which to pick: Choose A06289-1 for paraffin-section IHC: its IHC image used heat retrieval in EDTA at pH 8.0 and 2 μg/ml primary antibody (A06289-1 IHC image caption). Choose the same SKU for IF/ICC because both applications are listed and its IF image shows staining in U20S cells (catalog: applications; A06289-1 IF image caption). For mouse or rat work, A06289-1 lists reactivity with both species, while the supplied IHC image shows human tissue; the IHC caption does not report the fixative (catalog: reactivity; A06289-1 IHC image caption).