This website uses cookies to ensure you get the best experience on our website.


- Table of Contents
Plan QKI chromogenic IHC using nuclear staining in glial and trophoblastic cells as tissue benchmarks (HPA tissue IHC). Account for the cytoplasmic pattern reported in Bergmann glia when interpreting sections (HPA tissue IHC).

Expected localisation, validated protocols, controls and antibodies — the at-a-glance facts below, then the full design guide.
| Expected localisation | Nuclear tissue staining; cytoplasmic in Bergmann glia (HPA tissue IHC) | |
| Staining pattern | Glial and trophoblast nuclei; Bergmann glia cytoplasm (HPA tissue IHC) | |
| Antigen retrieval | EDTA pH 8.0 HIER, heat-mediated (datasheet M01874) | |
| Positive control | Caudate+4 more · see all | |
| Negative control | Breast+4 more · see all |
| Fixation | Keep fixation consistent across sections. (standard IHC practice; not target-specific) | |
| Caveat | Bergmann glia may depart from the nuclear pattern (HPA tissue IHC) | |
| Regulation | Down-regulated in schizophrenia brain (UniProt) | |
| Isoform / epitope | 6 isoforms; map the epitope before isoform-specific scoring (UniProt) |
The catalog antibody protocol (datasheet: M01874) accompanies published QKI IHC methods for paraffin tissue arrays (PMC6995368) and human carotid arteries (PMC4821877).
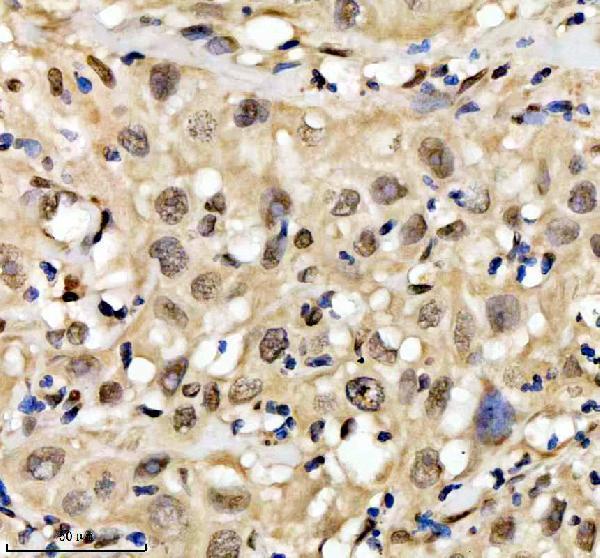
| Sample | Paraffin-embedded human glioma tissue; fixative not specified (datasheet M01874) |
| Fixation | Image fixative and duration unreported (datasheet M01874); verify before use. |
| Sectioning | 4–5 µm sections on charged slides (standard) |
| Deparaffinisation | Xylene, graded ethanol series to water (standard) |
| Antigen retrieval | Heat retrieval: EDTA pH 8.0 (datasheet M01874); 20 min, 95–100 °C (standard) |
| Peroxidase block | 3% H2O2, 10 min, room temperature (standard) |
| Blocking | 10% goat serum (datasheet M01874) |
| Primary antibody | Rabbit monoclonal (clone 26Q56) anti-QKI, 1:50 (datasheet M01874) |
| Primary incubation | Overnight at 4 °C (datasheet M01874) |
| Detection | HRP-conjugated secondary, DAB chromogen (datasheet M01874) |
| Counterstain | Hematoxylin, blue, dehydrate and mount (standard) |
| Expected result | QKI-positive staining in glial cells of caudate (HPA tissue IHC: High). HPA tissue profile: Nuclear expression in several tissues, most abundant in glial cells of the CNS and placental trophoblasts. No signal in the no-primary control. |
QKI is predominantly nuclear, with lower cytoplasmic localization; it has no transmembrane segment (UniProt Q96PU8). In paraffin sections, expect nuclear staining in glial cells of the CNS and placental trophoblasts, with High HPA staining levels in several sampled regions (HPA tissue IHC). The tissue IHC profile has Enhanced reliability, reflecting high agreement between antibody staining and RNA expression data (HPA tissue IHC).
| Distinct glial nuclei stain in caudate or cerebral cortex; trophoblast nuclei stain in placenta. | This matches the predominant nuclear localization (UniProt Q96PU8) and the High staining levels reported for those cell populations (HPA tissue IHC). Judge the cells and their compartments together; staining across a whole tissue section is less informative than staining in the expected cells. |
| Bergmann glia show cytoplasmic or membrane-associated staining in cerebellum. | This is a documented exception to the predominantly nuclear tissue profile: HPA lists High staining in Bergmann glia under cytoplasm/membrane (HPA tissue IHC). Lower cytoplasmic localization is also compatible with the UniProt record (UniProt Q96PU8). Do not classify this specific appearance as artefact solely because it is extranuclear. |
| Staining is confined to membranes, or fills many unrelated cells without a recognizable nuclear pattern. | A broadly membrane-only result conflicts with QKI's predominantly nuclear localization and lack of a transmembrane segment (UniProt Q96PU8). Check whether the apparent pattern instead comes from nonspecific deposition or tissue morphology (general IHC practice); assess Bergmann glia separately because HPA records their cytoplasm/membrane pattern (HPA tissue IHC). |
| Respiratory or glandular epithelium stains strongly where the reference profile reports no detection. | HPA reports QKI as not detected in bronchial respiratory epithelial cells and in duodenal and pancreatic glandular cells (HPA tissue IHC). A signal there warrants a cross-reactivity or endogenous detection activity check (general IHC practice). It does not, by itself, establish that the antibody binds QKI in those cells. |
| Color is diffuse across nuclei, cytoplasm, and extracellular spaces, or no cells stain in a known-positive section. | Diffuse color obscures the cell-specific HPA pattern; assess background and detection controls (general IHC practice; HPA tissue IHC). No signal in glia from caudate or cerebral cortex, or in placental trophoblasts, calls for a technical-control review before interpreting the section as QKI-negative (HPA tissue IHC; general IHC practice). |
| Cell and tissue choice (HPA tissue IHC) | Caudate and cerebral cortex glia and placental trophoblasts are High reference populations (HPA tissue IHC). Hippocampal glia, cardiomyocytes, endometrial stromal cells, and adipocytes are listed as Medium, so use their reported levels when interpreting a weaker pattern (HPA tissue IHC). |
| Subcellular context (UniProt Q96PU8; HPA tissue IHC) | QKI is predominantly nuclear but also occurs at lower levels in cytoplasm (UniProt Q96PU8). Interpret the reported Bergmann glial cytoplasm/membrane staining in its cell and tissue context rather than requiring every positive cell to look exclusively nuclear (HPA tissue IHC). |
| Isoforms and antibody interpretation (UniProt Q96PU8) | UniProt lists 6 QKI isoforms (UniProt Q96PU8). The supplied record gives no epitope or isoform coverage for a chosen IHC antibody; a staining difference therefore cannot be assigned to a particular isoform from these sources alone. |
| Antibody validation (HPA antibodies; HPA tissue IHC) | HPA019123 and CAB022602 each have Enhanced IHC status (HPA antibodies). HPA describes the tissue profile as highly consistent with RNA expression data (HPA tissue IHC). These annotations support the reference pattern, but they do not make every unexpected signal target-specific. |
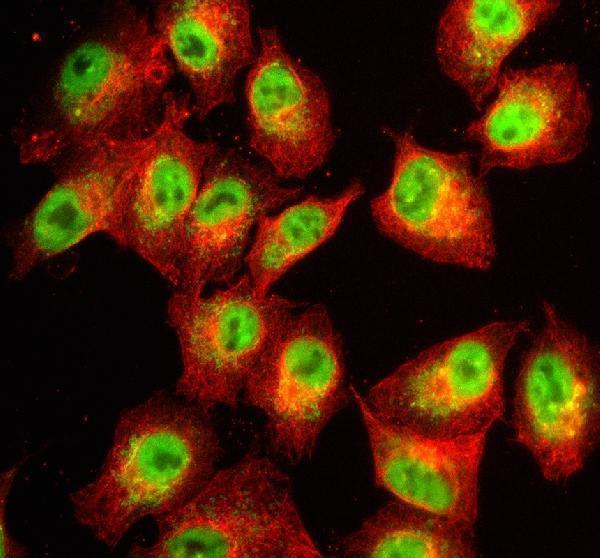
| What should IF/ICC show? (HPA subcellular ICC-IF) | The supported main IF/ICC location is nucleoplasm (HPA subcellular ICC-IF). UniProt also records lower cytoplasmic localization (UniProt Q96PU8). Use that localization as a cross-check only; IF/ICC has its own guide, and this IHC section supplies no IF/ICC protocol option. |
| Fixation sensitivity (source scope) | Target-specific fixation sensitivity for QKI is unreported in the supplied UniProt and HPA records. Any decisions about retrieval or other section-processing conditions should follow the chosen antibody's IHC instructions and controls (general IHC practice), without assigning an observed difference to a documented QKI fixation effect. |
| Situation | Likely cause | Next action |
|---|---|---|
| Known-positive glia or trophoblasts show no signal (HPA tissue IHC). | The reference cells have High reported staining, so an absent result may reflect an assay failure or sample issue; the supplied sources do not identify which (HPA tissue IHC; general IHC practice). | Confirm the expected cells are present, run a known-positive section, and check the chosen antibody's IHC dilution, retrieval, detection, and counterstain instructions (general IHC practice). |
| Staining is weak in hippocampus, heart muscle, or endometrial stroma (HPA tissue IHC). | HPA lists hippocampal glia, cardiomyocytes, and endometrial stromal cells at Medium rather than High (HPA tissue IHC). A weaker appearance in these populations alone does not establish assay failure. | Compare the correct cell population with a High reference such as caudate glia or placental trophoblasts, using matched staining conditions (HPA tissue IHC; general IHC practice). |
| Brown signal appears in bronchial epithelium or pancreatic exocrine cells (HPA tissue IHC). | Both populations are reported as not detected (HPA tissue IHC). Possible explanations include nonspecific binding or endogenous detection activity (general IHC practice); the appearance alone cannot distinguish them. | Review tissue morphology and include an appropriate primary-omission and detection control; reassess blocking and detection chemistry according to the assay (general IHC practice). |
| Background covers much of the section or hides nuclear boundaries. | Diffuse chromogen can make cell-level localization unreliable (general IHC practice). It cannot be reconciled confidently with the nuclear tissue profile while the expected cells remain indistinct (HPA tissue IHC). | Check the primary-omission control, blocking, antibody dilution, wash steps, chromogen development, and counterstain balance under the chosen IHC workflow (general IHC practice). |
| Cerebellar staining looks cytoplasmic or membrane-associated in Bergmann glia (HPA tissue IHC). | HPA specifically records this appearance at a High level in Bergmann glia (HPA tissue IHC), despite the broader predominantly nuclear localization (UniProt Q96PU8). | Identify Bergmann glia in the section and compare their pattern with the HPA cell-specific description; investigate only if the signal extends indiscriminately beyond the expected cells (HPA tissue IHC; general IHC practice). |
| Only broad membrane staining is visible outside the documented Bergmann glial pattern. | A membrane-only distribution in other cells is difficult to reconcile with predominant nuclear localization and no transmembrane segment (UniProt Q96PU8; HPA tissue IHC). | Review the positive and primary-omission controls and inspect for nonspecific deposition; repeat interpretation after the expected nuclei can be assessed clearly (general IHC practice; HPA tissue IHC). |

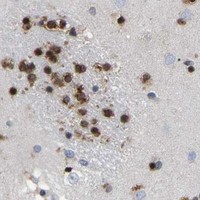


Comprehensive Human Protein Atlas IHC scoring per tissue (reliability: Enhanced — High consistency between antibody staining and RNA expression data.). Rows are taken directly from the HPA tissue chart — click any row's HPA link to view the source.
| Tissue | Cell type | Level | Evidence | Source |
|---|---|---|---|---|
| Caudate | Glial cells | High | Protein (IHC) | HPA → |
| Cerebellum | Bergmann glia - cytoplasm/membrane | High | Protein (IHC) | HPA → |
| Cerebral cortex | Glial cells | High | Protein (IHC) | HPA → |
| Placenta | Trophoblastic cells | High | Protein (IHC) | HPA → |
| Adipose tissue | Adipocytes | Medium | Protein (IHC) | HPA → |
| Tissue | Cell type | Level | Evidence | Source |
|---|---|---|---|---|
| Breast | Adipocytes | Not detected | Protein (IHC) | HPA → |
| Bronchus | Respiratory epithelial cells | Not detected | Protein (IHC) | HPA → |
| Cervix | Glandular cells | Not detected | Protein (IHC) | HPA → |
| Duodenum | Glandular cells | Not detected | Protein (IHC) | HPA → |
| Fallopian tube | Glandular cells | Not detected | Protein (IHC) | HPA → |
Use the catalog antibody’s paraffin-section result as the starting point, then judge QKI staining by cell type, compartment, and matched controls.
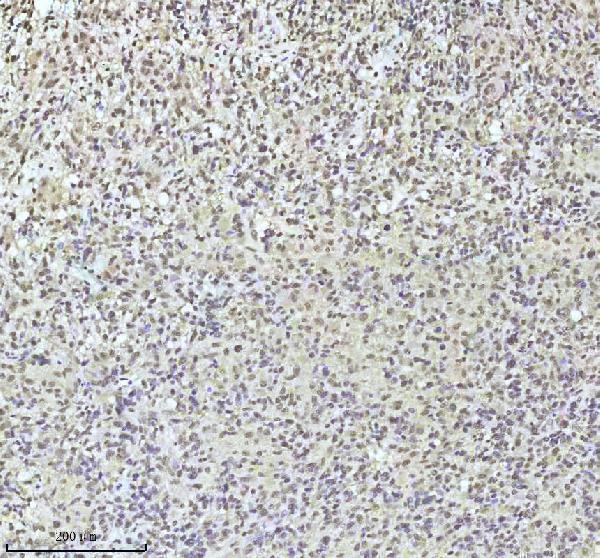
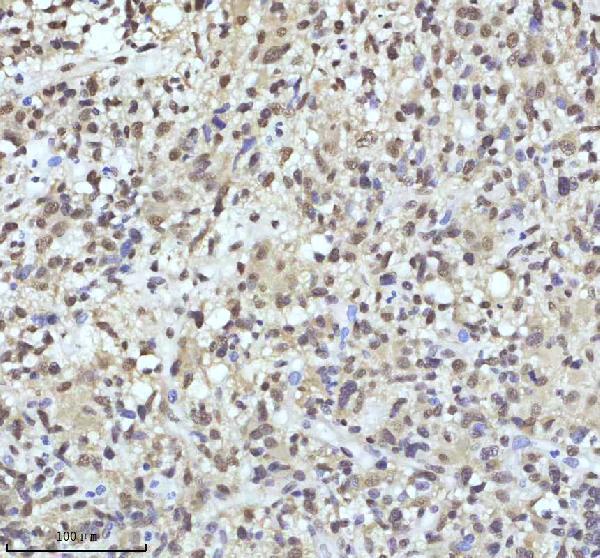
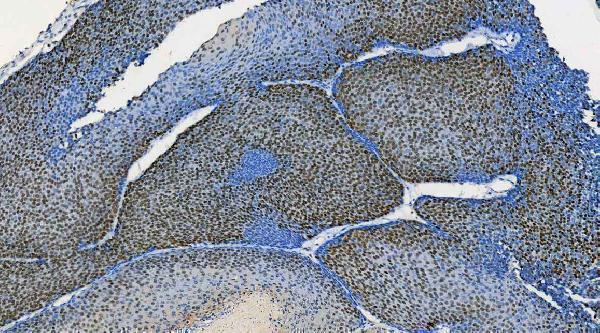
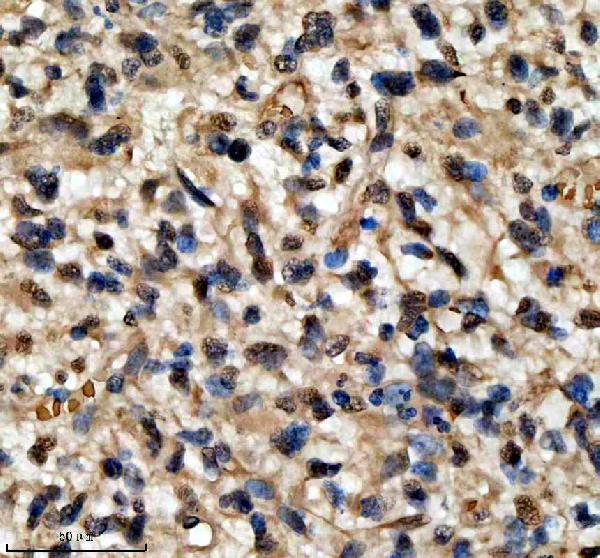
QKI IHC images show human paraffin-embedded cancer sections (catalog IHC captions); IF images show human cancer sections and A549 cells (catalog IF captions). Listed reactivity spans human, mouse, rat, and monkey (catalog reactivity).
M01874 has IHC images from human glioma and testis cancer paraffin sections, plus IF images from human cancer paraffin sections (catalog M01874 image captions). A01874-3 has IHC images from human glioma, bladder, renal, and breast cancer paraffin sections, plus an IF/ICC image from A549 cells (catalog A01874-3 image captions).
Which to pick: Choose M01874 for tissue IHC when a rabbit monoclonal is preferred; its human glioma paraffin-section image used EDTA pH 8 retrieval and 1:50 antibody dilution, with fixation unreported (catalog M01874 clone and IHC caption). Choose A01874-3 for IF/ICC based on its A549 cell image at 5 μg/mL; its own paraffin-section IHC image used EDTA pH 8 retrieval and 2 μg/mL, with fixation unreported (catalog A01874-3 IF and IHC captions). For cross-species selection, A01874-3 lists monkey alongside human, mouse, and rat, while M01874 lists human, mouse, and rat; the supplied IHC/IF images show human samples (catalog reactivity and image captions).