QKI / KH domain-containing RNA-binding protein QKI · Western blot design guide

Design a Western Blot for QKI

Real validated QKI Western blot protocols, expected-band and isoform facts, troubleshooting for weak or shifted signal, and recommended anti-QKI WB antibodies. Everything you need to plan the experiment before you commit precious samples.

Evidence assembled September 2026 · For research use; verify linked source records and product datasheet before use
Western blot protocol sheet for QKI: expected band ~37.7 kDa, hero antibody M01874, catalog values and labelled standard workflow; separate PMC comparisons on the guide
Printable QKI Western blot protocol sheet — expected band ~37.7 kDa, antibody M01874, controls and PMC citations. Open the full QKI WB guide →

QKI Western Blot Experimental Design Guide

Expected bands, validated protocols, controls and antibodies — the at-a-glance facts below, then the full design guide.

Must know before running
Expected band ~37.7 kDa
Observed band ~38 kDa
Gel 5–20% (catalog M01874)
Positive control ⓘ Caudate (IHC candidate; verify WB) +4 more
Negative control ⓘ Breast (IHC candidate; verify WB)
Important caveats
Reasons your observed band may differ from the expected size.
PTM Phosphorylated + Methylated
Caveat Modification-state controls
Gene-set association MSigDB C7 membership
Isoform 6 isoform(s)
Section 1

Real Curated QKI Western Blot Protocols

The M01874 protocol combines labelled catalog values with standard starting conditions. Published comparisons retain their own sample, reagent and detection scope.

Recommended Western blot protocol parameters
Sample / lysatehuman K562, human U251, human HEL (catalog M01874)
Gel %5–20% (catalog M01874)
Load30 ug; reducing conditions (catalog M01874)
Transfera nitrocellulose membrane at 150 mA for 50-90 minutes (catalog M01874)
Membranenitrocellulose membrane (catalog M01874)
Blocking5% non-fat milk/TBS for 1.5 hour at RT (catalog M01874)
Primary antibodyM01874 · 1:500 (catalog M01874)
Primary incubationovernight at 4°C (catalog M01874)
Secondary antibodygoat anti-rabbit IgG-HRP, 1:5000 (catalog M01874)
Secondary incubation1.5 hour at RT (catalog M01874)
WashTBS-0.1%Tween 3 times with 5 minutes each (catalog M01874)
DetectionECL (catalog M01874)
Section 2

What Is the Expected QKI Western Blot Band Size?

QKI is predicted at 37.7 kDa and observed at ~38 kDa; the small difference has no established cause in the supplied evidence.

What am I looking at on my blot?
Band at ~38 kDaQKI-sized band matching the empirical whole-cell lysate result; confirm identity with an antibody control
Several bands at different positionsQKI splice isoforms could contribute, but distinct migration has not been established
Higher band near twice the monomer sizeCould reflect a QKI homodimer that persists during sample preparation
Single ~38 kDa band without a higher bandConsistent with detection of denatured QKI monomer
💡Expected QKI appearanceUniProt predicts a 37.7 kDa QKI monomer, and antibody QC detects a band at ~38 kDa in whole-cell lysates; confirm band identity with standard controls.
How each factor affects band size
UniProt predicted monomer massPredicts 37.7 kDa; the empirical band is ~38 kDa
QKI homodimer formationMay produce a higher band if the dimer survives sample preparation
QKI5, QKI6, QKI7 and QKI7B splice isoformsMay differ in apparent size; their individual masses and migration are not supplied
Splice isoforms 2 and 3May differ in apparent size; their individual masses and migration are not supplied
Why is my band missing or off?
SituationLikely causeNext action
Band higher than expectedQKI homodimer may persist during sample preparationCheck denaturation conditions and compare with a QKI knockdown control
Band lower than expectedA splice isoform or protein breakdown is possibleCompare with a QKI knockdown and use an antibody to another epitope
Multiple bandsSix QKI splice isoforms are annotated, though distinct migration is unprovenCheck which bands decrease after QKI knockdown
Weak or no signalQKI recovery from nuclear and cytoplasmic fractions may varyCheck loading and antibody performance with a positive lysate, then examine both fractions
Fragments below expected sizeProtein degradation during sample handling is possibleProcess samples promptly with protease inhibitors and verify bands using QKI knockdown

Sample controls for QKI Western blot

🧪HPA-IHC candidate guidance (verify in WB): For positive controls for QKI in Western blot, you can use caudate tissue, which has high HPA expression.
Positive control: Caudate (IHC candidate; verify WB)
Negative control: Breast (IHC candidate; verify WB)
Loading controls: Run GAPDH, β-actin, and a total-protein stain alongside.
⚠️Feasibility: QKI is intracellular, and HPA identifies a not-detected tissue for a negative control.

HPA tissue expression evidence for QKI

Comprehensive Human Protein Atlas IHC scoring per tissue. Rows are taken directly from the HPA tissue chart — click any row's HPA link to view the source.

Higher expression tissues · candidate positive controls from IHC

TissueCell typeLevelEvidenceSource
Caudate glial cells High Protein (IHC) HPA →
Cerebellum Bergmann glia - cytoplasm/membrane High Protein (IHC) HPA →
Cerebral cortex glial cells High Protein (IHC) HPA →
Placenta trophoblastic cells High Protein (IHC) HPA →
Soft tissue fibroblasts High Protein (IHC) HPA →

Lower expression tissues · IHC evidence, not confirmed WB-negative controls

TissueCell typeLevelEvidenceSource
Breast adipocytes Not detected Protein (IHC) HPA →
Bronchus respiratory epithelial cells Not detected Protein (IHC) HPA →
Cervix glandular cells Not detected Protein (IHC) HPA →
Duodenum glandular cells Not detected Protein (IHC) HPA →
Fallopian tube glandular cells Not detected Protein (IHC) HPA →
Section 3

Advanced QKI Western Blot Tips

Deeper troubleshooting and optimisation questions for QKI, answered from its protein features.

How should QKI band migration be interpreted?
Band shift · Use the separately labelled calculated mass and catalog-observed evidence above. A sequence annotation does not establish an observed migration shift. Verify target identity with orthogonal controls.
Could QKI isoforms produce different bands?
Isoforms · Yes. UniProt lists six isoforms. Isoforms 2 and 3 lack residues 213–220; isoforms 3, QKI7, QKI6 and QKI7B have different sequences replacing residues 312–341. Consider which isoforms the antibody can recognize when interpreting multiple bands.

Specify whether the measurement is intended to represent one isoform or all recognized QKI isoforms. UniProt lists six isoforms with sequence differences, so a single band's intensity may not represent total QKI. Compare the same defined band or set of bands across samples.
Which QKI modification sites matter when interpreting bands?
PTM · In UniProt coordinates, QKI has phosphoserine at 188 and methylarginine at 227, 242 and 256. At 242, asymmetric dimethylarginine by CARM1 and omega-N-methylarginine are listed as alternate modifications. These features alone do not establish a visible band shift.

UniProt lists phosphoserine at position 188, using its own sequence numbering. This identifies a modification to consider, but does not show that phosphorylation causes any observed shift or account for a difference between apparent and predicted mass.
Does this guide establish induction of QKI?
Induction · No general induction response is established by this guide. A pathway or gene-set association is not evidence of induction in a particular specimen. Verify the relevant treatment and control in a target-specific experiment.
How should transfer be checked for QKI?
Transfer · Standard workflow guidance: verify transfer efficiency for the intended target size before interpreting a weak signal. Use total-protein assessment and optimize transfer for the membrane, gel and apparatus; the labelled catalog values take precedence.
How should blocking be optimized?
Blocking · Standard workflow guidance: follow the M01874 datasheet where specified. Otherwise compare 5% milk or 5% BSA in TBST; for a phospho-specific assay start with BSA. Optimize background and specific signal with matched controls.
How should QKI be quantified?
Quantitation · Standard workflow guidance: quantify only a validated target band within the linear exposure range. Use consistent sample preparation and loading, retain biological replicates, and avoid interpreting saturation or loading differences as regulation.
Does the ~38 kDa band match QKI's predicted mass?
Interpretation · Yes. The observed ~38 kDa band is close to QKI's predicted 37.7 kDa mass. That agreement supports the assignment, but band position alone does not establish identity.

UniProt places QKI in both the nucleus and cytoplasm. When comparing fractions, identify the fraction and quantify corresponding bands consistently; a change in one fraction need not describe QKI across both locations.

UniProt reports that QKI can homodimerize without RNA. A higher band alone does not establish that it is a QKI dimer; the supplied features do not show whether dimers persist under the blot conditions.
Boster reagents

QKI Western Blot Antibodies

Catalog antibodies with Western blot application and product-specific WB images. Evaluate suitability with the reported sample, controls and experimental conditions.

Real WB data Western blot analysis of QK1 using anti-QK1 antibody (M01874). Electrophoresis was performed on a 5-20% SDS-PAGE gel at 70V (Stacking gel) / 90V (Resolving gel) for 2-3 hours. The sample well of each lane was loaded with 30 ug of sample under reducing conditions. Lane 1: human K562 whole cell lysates, Lane 2: human U251 whole cell lysates, Lane 3: human HEL whole cell lysates, Lane 4: human HepG2 whole cell lysates. After electrophoresis, proteins were transferred to a nitrocellulose membrane at 150 mA for 50-90 minutes. Blocked the membrane with 5% non-fat milk/TBS for 1.5 hour at RT. The membrane was incubated with rabbit anti-QK1 antigen affinity purified monoclonal antibody (Catalog # M01874) at 1:500 overnight at 4°C, then washed with TBS-0.1%Tween 3 times with 5 minutes each and probed with a goat anti-rabbit IgG-HRP secondary antibody at a dilution of 1:5000 for 1.5 hour at RT. The signal is developed using an Enhanced Chemiluminescent detection (ECL) kit (Catalog # EK1002) with Tanon 5200 system. A specific band was detected for QK1 at approximately 38 kDa. The expected band size for QK1 is at 38 kDa.
Anti-QK1 Rabbit Monoclonal Antibody
Cat # M01874
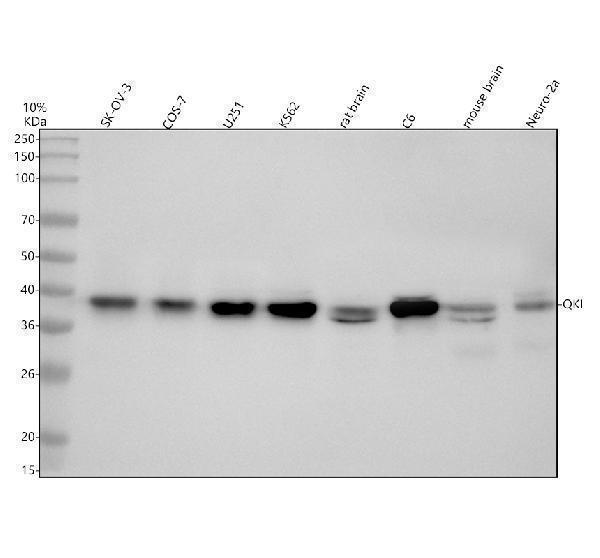
Real WB data Western blot analysis of QKI using anti-QKI antibody (A01874-3). Electrophoresis was performed on a 10% SDS-PAGE gel at 80V (Stacking gel) / 120V (Resolving gel) for 2 hours. The sample well of each lane was loaded with 30 ug of sample under reducing conditions. Lane 1: human SK-OV-3 whole cell lysates, Lane 2: monkey Cos-7 whole cell lysates, Lane 3: human U251 whole cell lysates, Lane 4: human K562 whole cell lysates, Lane 5: rat brain tissue lysates, Lane 6: rat C6 whole cell lysates, Lane 7: mouse brain tissue lysates, Lane 8: mouse Neuro-2a whole cell lysates. After electrophoresis, proteins were transferred to a nitrocellulose membrane at 150 mA for 50-90 minutes. Blocked the membrane with 5% non-fat milk/TBS for 1.5 hour at RT. The membrane was incubated with rabbit anti-QKI antigen affinity purified polyclonal antibody (A01874-3) at 0.5 μg/mL overnight at 4°C, then washed with TBS-0.1%Tween 3 times with 5 minutes each and probed with a goat anti-rabbit IgG-HRP secondary antibody at a dilution of 1:5000 for 1.5 hour at RT. The signal is developed using an ECL Plus Western Blotting Substrate (Catalog # AR1196-200) with Tanon 5200 system. A specific band was detected for QKI at approximately 38 kDa. The expected band size for QKI is at 38 kDa.
Anti-QKI Antibody Picoband®
Cat # A01874-3

The catalog reports two anti-QKI antibodies with Western blot images: monoclonal M01874 and polyclonal A01874-3. Both captions report a band at approximately 38 kDa using 30 μg of sample under reducing conditions. The supplied evidence covers the pictured samples only; no independent validation is provided.

Which to pick: For human cell lysates, both have WB images. A01874-3 also shows monkey Cos-7, rat brain and C6, and mouse brain and Neuro-2a samples. M01874’s image shows human cell lysates, although its listed reactivity includes mouse and rat.

Source: BosterBio QKI gene-info card — filtered to Western-blot-capable antibodies; each card shows that product's actual WB validation figure.