This website uses cookies to ensure you get the best experience on our website.


- Table of Contents
Plan RBM15 paraffin-section IHC around its variable nuclear staining (HPA tissue IHC). The guide highlights high-staining Purkinje cells and colonic glandular cells for tissue selection (HPA tissue IHC), with a catalog antibody starting range of 2–5 μg/ml (datasheet A04395).

Expected localisation, validated protocols, controls and antibodies — the at-a-glance facts below, then the full design guide.
| Expected localisation | Variable nuclear staining in most tissues (HPA tissue IHC) | |
| Staining pattern | Variable nuclear staining across tissue cell types (HPA tissue IHC) | |
| Antigen retrieval | EDTA pH 8.0 HIER, heat-mediated (datasheet A04395) | |
| Positive control | Cerebellum+4 more · see all | |
| Negative control | Soft tissue |
| Fixation | Keep fixation consistent across sections (standard IHC practice; not target-specific); Matched tissue-IHC evidence does not establish the fixation claim. Validate the specimen-specific method before use. (selected-SKU IHC image A04395) | |
| Caveat | Antibody staining and RNA show medium consistency (HPA tissue IHC) | |
| Regulation | Variable by tissue; marrow RNA enhanced (HPA tissue RNA) | |
| Isoform / epitope | Four isoforms; check epitope coverage across variants (UniProt) |
The catalog antibody has an IHC-P protocol (datasheet A04395). These tables summarize published RBM15 IHC in thyroid, lung cancer, and mouse liver tissues (PMC9664221; PMC11831794; PMC9942341).
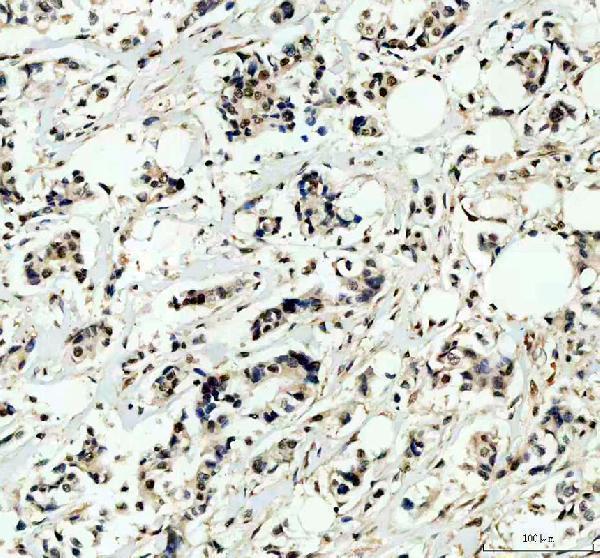
| Sample | Paraffin-embedded human breast cancer tissue; fixative not specified (datasheet A04395) |
| Fixation | Image fixative and duration unreported (datasheet A04395); verify before use. |
| Sectioning | 4–5 µm sections on charged slides (standard) |
| Deparaffinisation | Xylene, graded ethanol series to water (standard) |
| Antigen retrieval | Heat retrieval: EDTA pH 8.0 (datasheet A04395); 20 min, 95–100 °C (standard) |
| Peroxidase block | 3% H2O2, 10 min, room temperature (standard) |
| Blocking | 10% goat serum (datasheet A04395) |
| Primary antibody | Rabbit anti-RBM15, 2-5 μg/ml (datasheet A04395) |
| Primary incubation | Overnight at 4 °C (datasheet A04395) |
| Detection | HRP-conjugated secondary, DAB chromogen (datasheet A04395) |
| Counterstain | Hematoxylin, blue, dehydrate and mount (standard) |
| Expected result | RBM15-positive staining in purkinje cells of cerebellum (HPA tissue IHC: High). HPA tissue profile: Nuclear expression at variable levels in most tissues. No signal in the no-primary control. |
RBM15 should appear predominantly in nuclei: HPA reports variable nuclear staining in most tissues (HPA tissue IHC: Supported), while UniProt places RBM15 in nuclear speckles, nucleoplasm, envelope and membrane (UniProt Q96T37). Strong examples include intestinal glandular cells, kidney collecting ducts and placental decidual cells (HPA tissue IHC: High). RBM15 has no transmembrane segment (UniProt Q96T37 topology).
| Clear nuclear staining in colon or duodenal glandular cells, with variation among cells. | This fits the reported pattern: both cell populations stain at a High level, and nuclear expression varies across tissues (HPA tissue IHC: High in colon and duodenum; variable nuclear expression). Judge signal in the named cells, rather than expecting every cell in the section to match. |
| Cytoplasmic or surface staining dominates while nuclei remain pale. | That distribution conflicts with the nuclear tissue pattern and the reported nuclear locations (HPA tissue IHC: nuclear expression; UniProt Q96T37 subcellular location). Review morphology, counterstain alignment and detection background before calling it RBM15. A nuclear rim can be compatible with UniProt's envelope annotation, but diffuse cytoplasm alone is unconvincing. |
| Strong staining appears in soft tissue fibroblasts or another unexpected cell population. | Soft tissue fibroblasts are reported as not detected (HPA tissue IHC). Confirm cell identity and compare the nuclear pattern with a known positive section; cross-reactivity or endogenous detection activity may explain discordant staining (standard IHC practice). HPA's variable tissue expression limits blanket claims about every unlisted cell type. |
| Color spreads across stroma, empty spaces or multiple compartments without distinct nuclei. | That appearance is difficult to reconcile with predominantly nuclear RBM15 (HPA tissue IHC; UniProt Q96T37 subcellular location). Check the matched negative control and detection reagents for background (standard IHC practice). Background alone does not establish which reagent or step caused it. |
| There is no convincing nuclear signal in a known positive tissue. | A blank result in colon glands or kidney collecting ducts conflicts with their reported High staining (HPA tissue IHC). Check section quality, antibody identity and dilution, detection performance, and a positive control (standard IHC practice). A single blank slide cannot establish true absence of RBM15. |
| Compartment and resolution | UniProt lists nuclear speckles, nucleoplasm, envelope and membrane (UniProt Q96T37 subcellular location); HPA tissue IHC summarizes nuclear staining. Chromogenic sections may support a nuclear call without resolving each subnuclear site (standard IHC interpretation). Avoid requiring a sharply punctate pattern in every positive cell. |
| Cell population and tissue choice | Purkinje cells, intestinal glands, kidney collecting ducts and placental decidual cells are High; soft tissue fibroblasts are not detected (HPA tissue IHC). Thyroid, adrenal and salivary glandular cells are reported Low (HPA tissue IHC). Choose controls by the specified cell population, not the organ name alone. |
| Evidence strength | The overall tissue profile is Supported, with medium agreement between antibody staining and RNA expression (HPA tissue IHC). HPA019824 and CAB015201 have Supported IHC status; HPA049642 has no IHC status listed (HPA antibodies). These labels support cautious pattern interpretation, not universal antibody performance. |
| Isoforms and antibody epitope | UniProt lists 4 isoforms and RRM and SPOC domains (UniProt Q96T37). No epitope location is supplied here, so isoform coverage cannot be inferred for an individual antibody. Confirm the catalog antibody's documented target region before interpreting discordant staining as an isoform-specific pattern. |
| RNA enrichment versus protein staining | Bone marrow is tissue enhanced at the RNA level, while the supplied protein profile reports variable nuclear expression and named High cell populations elsewhere (HPA tissue IHC). RNA enrichment alone does not set an IHC intensity threshold for marrow (standard interpretation of RNA and protein measurements). |
| Situation | Likely cause | Next action |
|---|---|---|
| Expected nuclei are blank in a colon gland positive control. | The result conflicts with High glandular staining (HPA tissue IHC); the slide alone does not identify the failed step. | Verify antibody identity and documented IHC use, dilution, detection reagents and counterstain; repeat with a known positive section and controls (standard IHC practice). Record any antigen retrieval adjustment as a general workflow test, since RBM15-specific fixation sensitivity is unreported here. |
| Signal is broad and cytoplasmic in a tissue with visible nuclei. | Predominantly nuclear staining is expected (HPA tissue IHC; UniProt Q96T37 subcellular location); detection background or nonspecific binding is possible (standard IHC practice). | Compare a matched negative control, inspect the nuclear counterstain, and reassess blocking and detection conditions (standard IHC practice). Accept a nuclear rim only when it is clearly tied to nuclei (UniProt Q96T37 subcellular location). |
| Fibroblasts stain as strongly as the intended positive cells. | Soft tissue fibroblasts are reported not detected (HPA tissue IHC). Cross-reactivity or endogenous detection activity is possible, but staining alone does not distinguish them (standard IHC practice). | Confirm morphology and compare no-primary and detection controls, then repeat with an independently validated IHC antibody if available (standard IHC practice; HPA antibodies: two Supported IHC entries). |
| A low-staining gland is scored negative beside a strong glandular control. | HPA reports Low staining in thyroid, adrenal and salivary glandular cells, but High staining in colon glands (HPA tissue IHC). | Score each named cell population against its own expected range and a same-run positive control (HPA tissue IHC; standard IHC practice). Do not apply the colon intensity threshold to a reported Low population. |
| Two antibodies give different nuclear staining patterns. | IHC status is antibody specific: HPA019824 and CAB015201 are Supported, while HPA049642 has no listed IHC status (HPA antibodies). Epitope and isoform coverage are not supplied here. | Check each antibody's documented IHC validation and epitope information, then compare the same positive and negative control sections (standard IHC practice). Treat disagreement as unresolved until the control patterns are interpretable. |
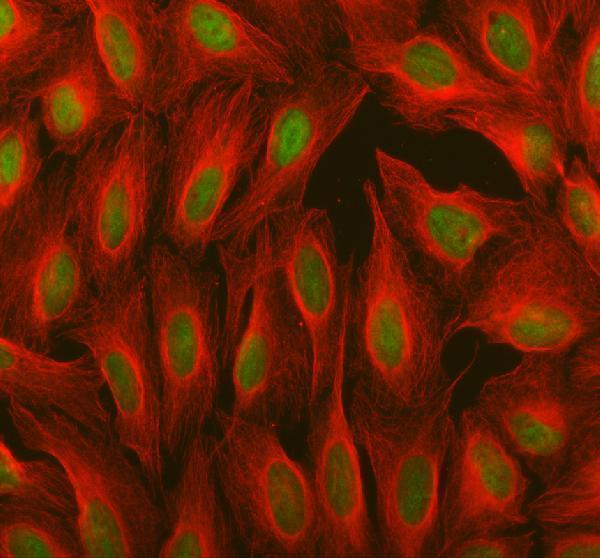
| IF/ICC Q: where should a corroborating cellular signal appear? | HPA reports enhanced nucleoplasmic localization in ICC-IF, consistent with a nuclear IHC call (HPA subcellular; HPA tissue IHC). | Look for nucleoplasmic signal aligned with nuclei, while interpreting the paraffin-section result against its own tissue controls (HPA subcellular; standard IHC interpretation). HPA's ICC-IF images include A-431, U-251MG, U2OS and NIH 3T3 (HPA subcellular). |


Comprehensive Human Protein Atlas IHC scoring per tissue (reliability: Supported — Medium consistency between antibody staining and RNA expression data.). Rows are taken directly from the HPA tissue chart — click any row's HPA link to view the source.
| Tissue | Cell type | Level | Evidence | Source |
|---|---|---|---|---|
| Cerebellum | Purkinje cells | High | Protein (IHC) | HPA → |
| Colon | Glandular cells | High | Protein (IHC) | HPA → |
| Duodenum | Glandular cells | High | Protein (IHC) | HPA → |
| Gallbladder | Glandular cells | High | Protein (IHC) | HPA → |
| Kidney | Collecting ducts | High | Protein (IHC) | HPA → |
| Tissue | Cell type | Level | Evidence | Source |
|---|---|---|---|---|
| Soft tissue | Fibroblasts | Not detected | Protein (IHC) | HPA → |
Troubleshoot RBM15 staining by checking nuclear localisation, documented antibody conditions, cell type and controls before comparing sections.
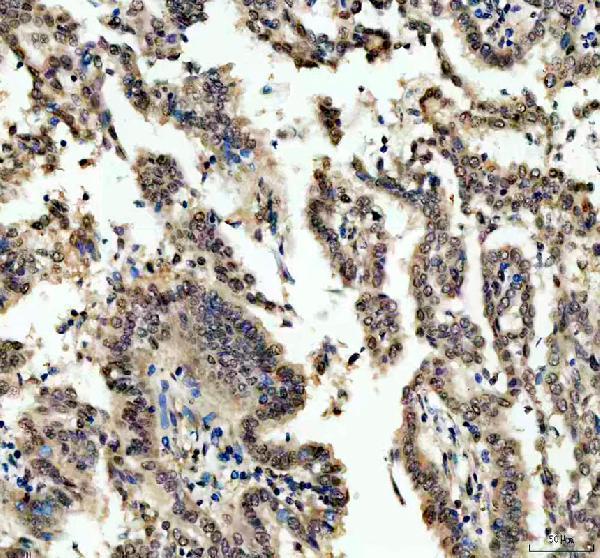
A04395 has IHC images from paraffin sections of human breast and lung cancer and mouse and rat brain, plus IF images from U2OS cells and human lung cancer sections (A04395 image captions).
A04395 is the only SKU shown; its IHC images cover paraffin sections of human breast and lung cancer and mouse and rat brain (A04395 IHC captions). Its IF images show U2OS cells and human lung cancer sections, and the catalog lists both IF and ICC applications (A04395 IF captions; catalog applications).
Which to pick: Choose A04395 for tissue IHC on paraffin sections; its own IHC captions show staining at 2 μg/ml in human, mouse and rat samples (A04395 IHC captions). For IF/ICC, A04395 lists both applications and has IF images from U2OS cells and human lung cancer sections (catalog applications; A04395 IF captions). For cross-species IHC, A04395 lists Human, Mouse and Rat reactivity and has IHC images for all three; clonality and the tissue fixative are unreported (catalog reactivity and clone field; A04395 IHC captions).