This website uses cookies to ensure you get the best experience on our website.


- Table of Contents
Real validated ADIPOR1 Western blot protocols, expected-band and isoform facts, troubleshooting for weak or shifted signal, and recommended anti-ADIPOR1 WB antibodies. Everything you need to plan the experiment before you commit precious samples.
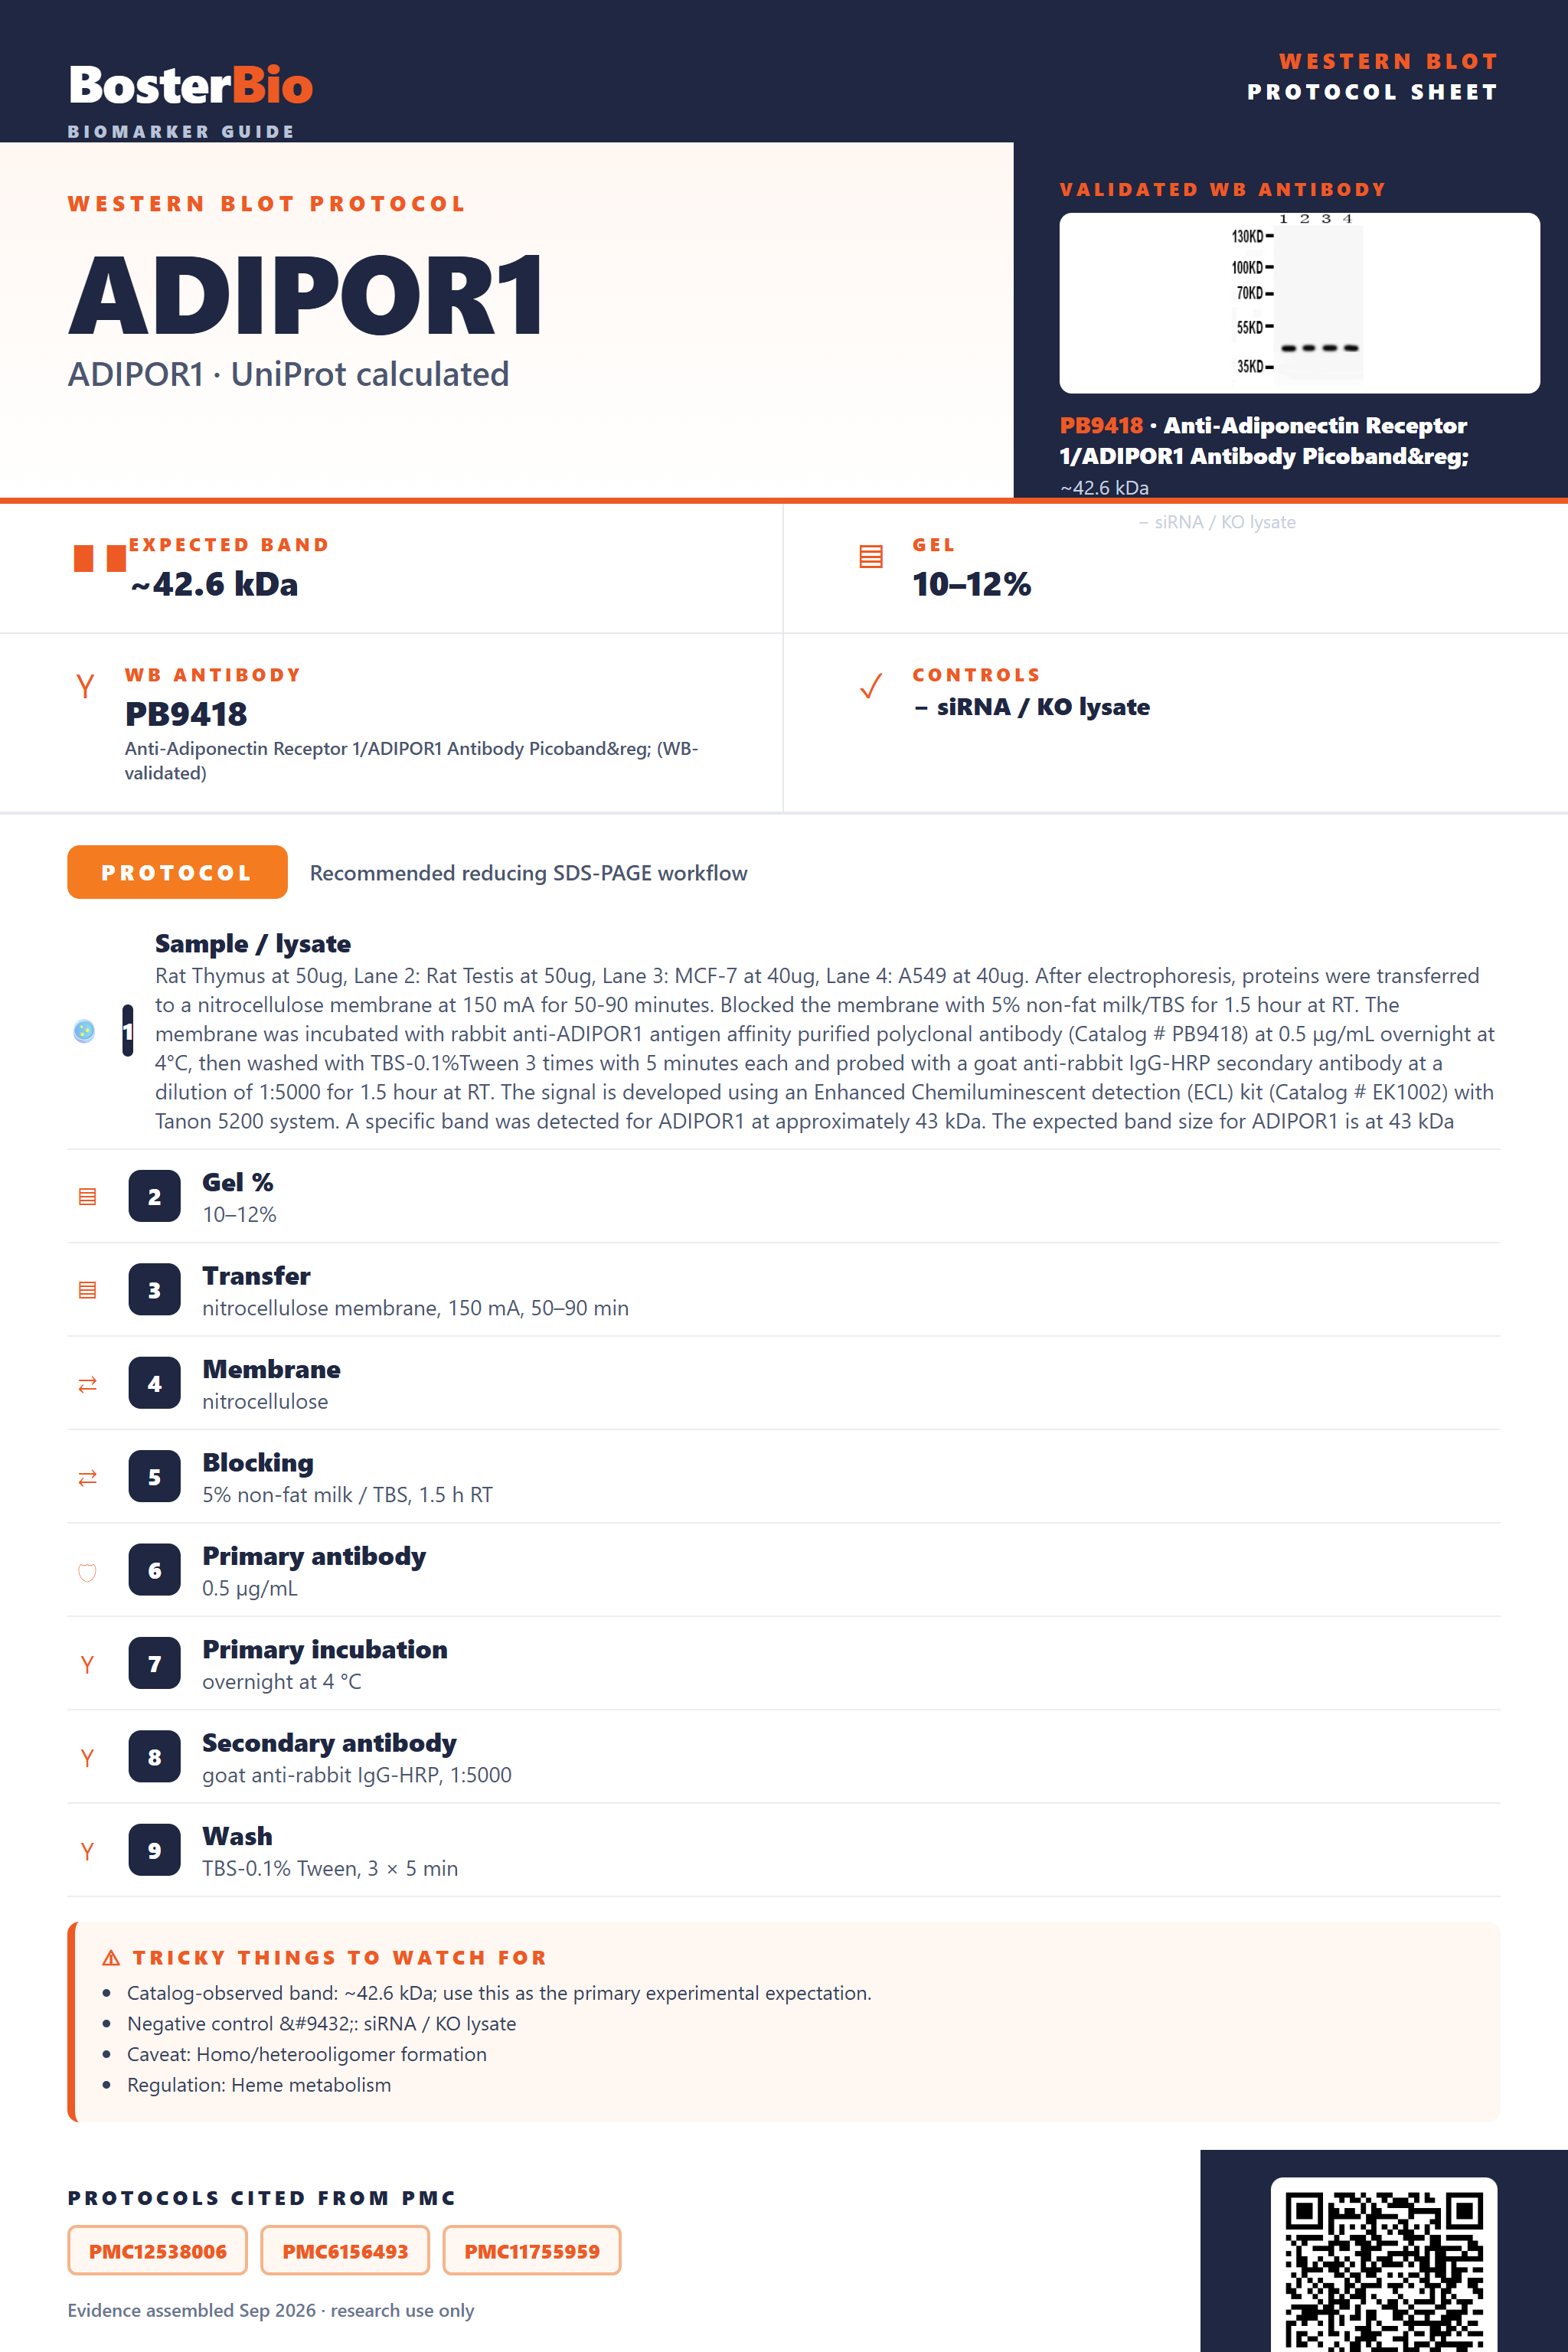
Expected bands, validated protocols, controls and antibodies — the at-a-glance facts below, then the full design guide.
| Expected band | ~42.6 kDa | |
| Observed band | Approximately 43 kDa | |
| Gel | 10–12% | |
| Negative control | siRNA / KO lysate |
| PTM | — | |
| Caveat | Homo/heterooligomer formation | |
| Regulation | Heme metabolism | |
| Isoform | 1 isoform(s) |
Literature-validated Western blot parameters for ADIPOR1 — gel percentage, transfer, blocking, antibody incubation and detection, extracted from published methods.
| Sample / lysate | Rat Thymus at 50ug, Lane 2: Rat Testis at 50ug, Lane 3: MCF-7 at 40ug, Lane 4: A549 at 40ug. After electrophoresis, proteins were transferred to a nitrocellulose membrane at 150 mA for 50-90 minutes. Blocked the membrane with 5% non-fat milk/TBS for 1.5 hour at RT. The membrane was incubated with rabbit anti-ADIPOR1 antigen affinity purified polyclonal antibody (Catalog # PB9418) at 0.5 μg/mL overnight at 4°C, then washed with TBS-0.1%Tween 3 times with 5 minutes each and probed with a goat anti-rabbit IgG-HRP secondary antibody at a dilution of 1:5000 for 1.5 hour at RT. The signal is developed using an Enhanced Chemiluminescent detection (ECL) kit (Catalog # EK1002) with Tanon 5200 system. A specific band was detected for ADIPOR1 at approximately 43 kDa. The expected band size for ADIPOR1 is at 43 kDa |
| Gel % | 10–12% |
| Transfer | nitrocellulose membrane, 150 mA, 50–90 min |
| Membrane | nitrocellulose |
| Blocking | 5% non-fat milk / TBS, 1.5 h RT |
| Primary antibody | 0.5 µg/mL |
| Primary incubation | overnight at 4 °C |
| Secondary antibody | goat anti-rabbit IgG-HRP, 1:5000 |
| Wash | TBS-0.1% Tween, 3 × 5 min |
| Detection | ECL |
| Exposure / imaging | Tanon 5200 |
| Observed band | 43 kDa |
ADIPOR1 has a 42.6 kDa predicted backbone and runs at essentially the same size, about 43 kDa, since it lacks glycosylation, cleavage, or disulfide-linked dimerization.
| single clean band at approximately 43 kDa | matches the 42.6 kDa predicted monomer mass for ADIPOR1, with no glycosylation, cleavage, or isoform variation to shift it |
| no diffuse smear above the main band | zero annotated glycosylation sites mean no heterogeneous sugar-driven mass increase is expected |
| no doublet or ladder of bands | only one isoform is annotated for ADIPOR1, so multiple isoform-driven bands are not expected |
| faint higher-molecular-weight band above the ~43 kDa monomer | residual non-covalent homo- or hetero-oligomer (with ADIPOR2) that did not fully dissociate during sample preparation |
| band at the same position as the full-length predicted size, not smaller | no signal peptide or propeptide is annotated, so there is no cleaved mature fragment running below the precursor size |
| Predicted mass (UniProt) | 375 aa / 42.6 kDa unmodified backbone sets the baseline expected monomer size, closely matching the ~43 kDa empirical band |
| No N-/O-glycosylation sites annotated | with zero glycosylation sites listed, there is no glycan-driven upward mass shift or smearing above the ~43 kDa monomer |
| No signal peptide or propeptide | the full-length sequence is used to compute mass, so there is no precursor-to-mature cleavage that would shift the band lower |
| Single annotated isoform | with only one isoform listed, no additional isoform-driven bands at different molecular weights are expected |
| Homo-/hetero-oligomerization (with ADIPOR2) | non-covalent oligomer formation, with no disulfide bonds annotated, means fully denatured and reduced samples should resolve to the ~43 kDa monomer, though incomplete denaturation can leave higher-MW oligomer species |
| Situation | Likely cause | Next action |
|---|---|---|
| No band in lysate | standard lysis buffers may not fully solubilize this multi-pass membrane receptor, leaving it in the insoluble membrane pellet | use a detergent-based membrane extraction buffer and load a membrane-enriched fraction rather than relying only on a mild whole-cell lysate |
| Band higher than expected | incomplete denaturation or reduction leaves the non-covalent homo- or hetero-oligomer (with ADIPOR2) partially intact | fully denature and reduce samples with SDS sample buffer and freshly prepared lysate to dissociate oligomers down to the ~43 kDa monomer |
| Broad smear instead of sharp band | the hydrophobic multi-pass transmembrane topology promotes aggregation, especially if samples are boiled at high temperature | heat samples at a lower temperature for a shorter time instead of full boiling to limit membrane protein aggregation |
| Multiple bands | residual monomer-plus-oligomer species from ADIPOR1 homo-/hetero-oligomerization with ADIPOR2 can appear alongside the main ~43 kDa band | treat the ~43 kDa band as the specific monomer signal and confirm identity by comparing fully reduced versus partially reduced preps |
| Weak or no signal | as a membrane-embedded receptor, ADIPOR1 can be underrepresented in lysates prepared without membrane-protein-compatible detergents | increase protein loading and use a membrane-protein extraction or enrichment protocol before probing |

Comprehensive Human Protein Atlas IHC scoring per tissue. Rows are taken directly from the HPA tissue chart — click any row's HPA link to view the source.
| Tissue | Cell type | Level | Evidence | Source |
|---|
| Tissue | Cell type | Level | Evidence | Source |
|---|
Deeper troubleshooting and optimisation questions for ADIPOR1, answered from its protein features.
BosterBio's ADIPOR1 antibodies are among the best-performing WB antibodies on the market — well cited, thoroughly validated, and orthogonally cross-validated against negative tissues and complementary methods.
Boster's anti-ADIPOR1 antibody is a top-performing, widely cited reagent for Western blot, rigorously validated through orthogonal testing against negative tissue controls and complementary detection methods, ensuring reliable, specific, and reproducible ADIPOR1 detection across experimental systems.
Which to pick: Only PB9418 is catalogued for ADIPOR1, backed by an actual Western blot image (rat thymus lysate), so it's the clear choice, no alternative SKUs to compare against for this target.