AGT / Angiotensinogen · IHC design guide

Design Immunohistochemistry for AGT

Plan chromogenic AGT IHC on paraffin sections using the 2–5 μg/mL antibody range (datasheet A02103-4). Interpret plasma positivity alongside high staining in proximal tubule cell bodies and medium staining in cytotrophoblasts (HPA tissue IHC).

Evidence assembled Oct 2026 · For research use; verify linked source records and product datasheet before use
Immunohistochemistry protocol sheet for AGT (IHC for AGT): expected localisation Plasma positivity (HPA tissue IHC), antibody A02103-4, validated IHC image, and IHC protocol steps
Printable AGT IHC protocol sheet — expected localisation Plasma positivity (HPA tissue IHC), antibody A02103-4, controls and protocol steps. Open the full AGT IHC guide →

AGT Immunohistochemistry Experimental Design Guide

Expected localisation, validated protocols, controls and antibodies — the at-a-glance facts below, then the full design guide.

Must know before staining
Expected localisation Plasma positivity (HPA tissue IHC)
Staining pattern Plasma positivity; high proximal tubule cell-body staining (HPA tissue IHC)
Antigen retrieval EDTA pH 8.0 HIER, heat-mediated (datasheet A02103-4)
Positive control ⓘ Kidney+1 more · see all
Negative control ⓘ Adipose tissue+4 more · see all
Important caveats
Reasons your staining may differ from the expected pattern.
Fixation Keep formalin fixation consistent across sections (standard IHC practice; not target-specific); AGT-specific effects are unclear.
Caveat Plasma staining may differ from tissue AGT RNA (HPA tissue IHC)
Regulation Liver-enriched RNA expression (HPA tissue RNA)
Isoform / epitope No annotated isoforms; mature chain starts at 25 (UniProt)
Section 1

Recommended AGT IHC & IF Protocols

The catalog antibody protocol uses heat-mediated EDTA retrieval at pH 8.0 (datasheet A02103-4). The three published AGT IHC protocols below cover rat liver, rat kidney, and human renal biopsies (PMC3560510; PMC2974762; PMC6662362).

Recommended immunohistochemistry (IHC-P) protocol parameters
SampleParaffin-embedded human lung adenocarcinoma tissue; fixative not specified (datasheet A02103-4)
FixationImage fixative and duration unreported (datasheet A02103-4); verify before use.
Sectioning4–5 µm sections on charged slides (standard)
DeparaffinisationXylene, graded ethanol series to water (standard)
Antigen retrievalHeat retrieval: EDTA pH 8.0 (datasheet A02103-4); 20 min, 95–100 °C (standard)
Peroxidase block3% H2O2, 10 min, room temperature (standard)
Blocking10% goat serum (datasheet A02103-4)
Primary antibodyRabbit anti-AGT, 2-5 μg/ml (datasheet A02103-4)
Primary incubationOvernight at 4 °C (datasheet A02103-4)
DetectionHRP-conjugated secondary, DAB chromogen (datasheet A02103-4)
CounterstainHematoxylin, blue, dehydrate and mount (standard)
Expected resultAGT-positive staining in proximal tubules (cell body) of kidney (HPA tissue IHC: High). HPA tissue profile: Positivity in plasma. No signal in the no-primary control.
💡Decision noteStart with heat-mediated EDTA retrieval at pH 8.0 for the catalog antibody (datasheet A02103-4); the emitted articles do not specify a retrieval condition (PMC3560510; PMC2974762; PMC6662362).
Section 2

What Is the Expected AGT Staining Pattern?

AGT is produced by the liver and secreted into plasma (UniProt P01019; HPA: positivity in plasma). In tissue IHC, expect high staining in kidney proximal tubule cell bodies and medium staining in placental cytotrophoblasts (HPA: tissue IHC, Supported). AGT has no transmembrane segment (UniProt P01019 topology), so a fixed membrane-only pattern would require scrutiny.

What am I looking at on my slide?
Proximal tubule cell bodies stain strongly in kidney; placental cytotrophoblasts stain less strongly.This matches the reported High kidney and Medium placenta patterns (HPA: tissue IHC). Judge each cell population separately rather than comparing whole-section color.
Signal appears confined to nuclei, or forms sharp outlines around every cell.That distribution is difficult to reconcile with AGT secretion and the reported proximal tubule cell-body staining (UniProt P01019; HPA: tissue IHC). Check counterstain, detection deposits and antibody specificity before assigning it to AGT.
Strong staining appears in adipocytes or bronchial respiratory epithelium.HPA reports AGT as Not detected in those cell populations (HPA: adipose tissue; bronchus). Investigate cross-reactivity or endogenous detection activity; plasma-associated signal can also complicate interpretation of a secreted protein (HPA: positivity in plasma).
Broad, even color covers cells and spaces without recognizable tissue structure.Treat this as background until controls establish otherwise (general IHC practice). AGT's reported plasma positivity means extracellular color alone does not identify a producing cell (HPA: tissue IHC; UniProt P01019).
Kidney proximal tubules show no signal in an otherwise interpretable section.This conflicts with their reported High staining (HPA: tissue IHC). Review tissue integrity and the IHC workflow, then repeat with appropriate controls (general IHC practice); a single negative section does not establish absent AGT expression.
💡Expected AGT appearanceCall a result positive when kidney proximal tubule cell bodies show high staining, with medium placental cytotrophoblast staining as another supported pattern (HPA: tissue IHC); isolated nuclear or widespread unrelated-cell staining warrants investigation (UniProt P01019; HPA: tissue IHC).
How each factor affects the staining
Secretion and tissue locationAGT is liver-expressed and plasma-secreted (UniProt P01019), while HPA reports kidney and placental cell staining plus plasma positivity (HPA: tissue IHC). A stained site therefore need not be the site of synthesis.
RNA versus proteinLiver-enriched tissue RNA does not establish a liver IHC intensity here (HPA: tissue IHC). HPA flags complex RNA–protein correlation for secreted variants; score the observed cell pattern against protein IHC evidence.
Topology and processingAGT has no transmembrane segment; residues 1–24 are a signal peptide and 25–476 form angiotensinogen (UniProt P01019). A membrane-like signal alone is insufficient to define the antibody's epitope or prove specificity.
GlycosylationFour glycosylation sites are annotated at residues 38, 161, 295 and 319 (UniProt P01019). Their effect on this antibody's IHC staining is unreported; do not infer a retrieval or sensitivity requirement from them.
Validation scopeThe listed mouse monoclonal CAB025798 has IHC status Supported, with no ICC status supplied (HPA: antibody record). HPA's subcellular summary says membrane and secreted, but provides no ICC-IF images (HPA: subcellular).
Why is my staining missing, weak or wrong?
SituationLikely causeNext action
Kidney proximal tubules are unexpectedly negative.The result disagrees with the reported High cell-body pattern (HPA: kidney IHC); the cause cannot be assigned from that observation alone.Confirm section quality and antibody use, then review retrieval, dilution and detection with suitable controls (general IHC practice). Do not assume AGT-specific fixation sensitivity; it is unreported here.
All tissue compartments develop similar color.Nonspecific background or endogenous detection activity may obscure a cellular pattern (general IHC practice). Plasma positivity adds a possible extracellular source of AGT signal (HPA: tissue IHC).Inspect negative detection controls and blocking, then compare the result with kidney proximal tubule cell bodies (general IHC practice; HPA: kidney IHC).
Nuclei stain more strongly than proximal tubule cell bodies.A dominant nuclear pattern is unsupported by the supplied AGT location and kidney cell-body observations (UniProt P01019; HPA: kidney IHC).Check the counterstain and detection controls; reassess whether the antibody signal follows the expected cell population (general IHC practice; HPA: kidney IHC).
Adipocytes or bronchial epithelial cells appear strongly positive.Those populations are reported as Not detected (HPA: adipose tissue; bronchus). Cross-reactivity or endogenous detection activity is possible (general IHC practice).Compare negative controls and a kidney positive section under the same detection conditions before calling the unexpected cells AGT-positive (general IHC practice; HPA: kidney IHC).
Placenta stains, but kidney and plasma-associated areas do not.Placental cytotrophoblast staining is reported at Medium intensity; kidney proximal tubules are High and plasma positivity is reported (HPA: tissue IHC). The discordance needs review.Verify cell identity, section quality and staining controls across the specimens before interpreting relative intensity (general IHC practice).
IF/ICC: what localization should be expected?HPA summarizes AGT as membrane and secreted, but supplies no ICC-IF images or ICC antibody status for CAB025798 (HPA: subcellular; antibody record).Treat any IF/ICC pattern as provisional and use the separate IF/ICC guide for assay design; do not transfer the IHC cell-body pattern into an ICC localization claim (HPA: tissue IHC; subcellular).

Sample controls for AGT IHC & IF

🧪Run kidney first and look for staining in proximal tubule cell bodies (HPA: High). Use adipose tissue adipocytes as the negative tissue (HPA: Not detected); on the kidney slide, assess cells outside the stained proximal tubules as candidate internal negatives and expect only control-level background, without assuming every other cell is AGT-negative.
Positive control tissue: Kidney (Proximal tubules (cell body), HPA High)
Negative control tissue: Adipose tissue (HPA Not detected)
ICC-IF cell lines (HPA subcellular resource): HPA carries no ICC-IF cell line for AGT; derive a cell-line control from the positive tissue's cell type (Proximal tubules (cell body)) and confirm it by RNA or western blot first.
Technical controls: Include a no-primary (secondary-only) control, a rabbit IgG isotype control matched to the primary antibody’s clonality, and AGT knockout tissue if available as a biological negative (selected-SKU IHC caption: rabbit primary; standard IHC practice). Quench endogenous peroxidase and compare kidney tubular DAB signal with the no-primary control (standard chromogenic IHC practice).
⚠️Feasibility: A target-specific fixation window or fixation effect is unreported, and the exact A02103-4 tissue-IHC caption does not state a fixative (selected-SKU IHC caption). Heat-mediated EDTA retrieval at pH 8.0 was used, but whether retrieval is required for AGT staining is unreported (selected-SKU IHC caption). The supplied evidence does not establish whether frozen sections or IF are easier than paraffin IHC; kidney tubular DAB background needs comparison with the negative controls (HPA: High in proximal tubules; standard IHC practice).

HPA tissue IHC evidence for AGT

Comprehensive Human Protein Atlas IHC scoring per tissue (reliability: Supported — At least one protein variant secreted, tissue location of RNA and protein might differ and correlation is complex.). Rows are taken directly from the HPA tissue chart — click any row's HPA link to view the source.

Positive expression · recommended positive controls

TissueCell typeLevelEvidenceSource
Kidney Proximal tubules (cell body) High Protein (IHC) HPA →
Placenta Cytotrophoblasts Medium Protein (IHC) HPA →

Undetected expression · recommended negative controls

TissueCell typeLevelEvidenceSource
Adipose tissue Adipocytes Not detected Protein (IHC) HPA →
Adrenal gland Glandular cells Not detected Protein (IHC) HPA →
Appendix Endocrine cells Not detected Protein (IHC) HPA →
Bone marrow Hematopoietic cells Not detected Protein (IHC) HPA →
Breast Adipocytes Not detected Protein (IHC) HPA →
Section 3

Advanced AGT IHC Tips

Use the IHC-validated antibody’s paraffin-section conditions as the starting point, then assess AGT staining against its secreted biology and documented tissue pattern (datasheet A02103-4; UniProt P01019; HPA tissue IHC).

Which retrieval conditions should I try first for AGT paraffin-section IHC?
Start with heat-mediated retrieval in EDTA at pH 8.0 for AGT paraffin-section IHC (datasheet A02103-4). The selected tissue image used that retrieval before 2 μg/ml primary antibody overnight at 4°C, so reproduce the reported sequence when troubleshooting weak signal (datasheet A02103-4). Keep section thickness, heating method, and retrieval duration consistent across controls, and compare staining in the same cell compartment (standard IHC practice). If staining remains weak, adjust heating duration in a small controlled series while checking tissue integrity; a different retrieval buffer is a fallback that requires separate validation (standard IHC practice).
Could fixation explain weak or uneven AGT staining?
The selected AGT image documents a paraffin-embedded section but does not state its fixative, so AGT-specific fixation sensitivity is unknown (datasheet A02103-4). For new specimens, standardize fixation using 10% neutral buffered formalin, record the interval from collection to fixation, and process comparison sections together (standard IHC practice). Compare weak and strong cases only after checking section quality, retrieval consistency, and staining-run controls, since these variables can alter apparent signal (standard IHC practice). Do not attribute a fixation effect to AGT’s secreted topology or glycosylation without a controlled fixation comparison (UniProt P01019 topology and glycosylation; standard IHC practice).
How should I interpret cytoplasmic versus extracellular AGT staining?
AGT has a signal peptide at residues 1–24, lacks an annotated transmembrane segment, and is secreted (UniProt P01019 topology). Cytoplasmic staining may be assessed separately from extracellular or plasma-associated staining; staining location alone does not establish which cells synthesized the protein (UniProt P01019; HPA tissue IHC profile). HPA reports high staining in kidney proximal-tubule cell bodies, medium staining in placental cytotrophoblasts, and positivity in plasma (HPA tissue IHC). Record cellular and extracellular patterns separately, then inspect adjacent morphology and a no-primary control before assigning a biological interpretation to diffuse deposits (standard IHC practice).
How do processing and glycosylation affect AGT epitope interpretation?
The supplied record lists 0 annotated isoforms and a signal peptide at residues 1–24, followed by the angiotensinogen chain at 25–476 (UniProt P01019 processing and isoforms). It also lists glycosylation sites at residues 38, 161, 295, and 319, but the selected antibody’s binding epitope is unspecified (UniProt P01019 glycosylation; datasheet A02103-4). Therefore, a stain cannot identify a processing state or glycoform without additional epitope evidence (UniProt P01019; standard IHC interpretation). If that distinction matters, document antibody epitope information when available and compare independently validated reagents under matched retrieval and detection conditions (standard IHC practice).
How can I adapt AGT localisation checks to multiplex immunofluorescence?
For IF, pair AGT with a validated marker of the expected cell type, such as a proximal-tubule cell marker in kidney or a cytotrophoblast marker in placenta (HPA tissue IHC; standard IF practice). Choose a fluorophore whose signal is clearly separated from the specimen’s autofluorescence, and include unstained and single-label controls before judging colocalisation (standard IF practice). AGT is secreted and has no annotated transmembrane segment, while this antibody’s epitope is unspecified; choose permeabilisation according to the experimentally established epitope location and intended intracellular or extracellular readout (UniProt P01019 topology; datasheet A02103-4; standard IF practice). The supplied product image establishes paraffin-section IHC conditions, not IF performance (datasheet A02103-4).
What should I check when AGT DAB staining is diffuse?
First compare the specimen with a no-primary control, and inspect blood-rich regions and section edges separately from intact cell bodies (standard IHC practice; HPA tissue IHC profile). AGT is secreted and HPA reports plasma positivity, so diffuse extracellular colour can reflect genuine antigen distribution even when cellular assignment is uncertain (UniProt P01019; HPA tissue IHC profile). For the reported workflow, review the 10% goat-serum block, 2 μg/ml primary concentration, and DAB development alongside wash consistency (datasheet A02103-4; standard IHC practice). Include a peroxidase-blocking step and verify it with controls, because endogenous enzyme activity can produce chromogenic background (standard IHC practice).
How should I score AGT IHC across specimens? ⚠ ANSWER MARKED FOR VERIFICATION
Define the anatomical region and viable cell population before scoring, then record cellular AGT staining separately from plasma or other extracellular signal (HPA tissue IHC profile; standard IHC practice). For cell-associated staining, report percent positive cells and intensity on a consistent 0–3 scale, or calculate an H-score on a 0–300 scale (standard IHC scoring practice). For extracellular deposits, report positive area or optical density per mm² of viable tissue rather than assigning it to adjacent cells (standard IHC quantification practice). Normalize comparisons to the same compartment, tissue area, section quality, and staining run, with prespecified thresholds and blinded review where feasible (standard IHC practice).
How can I distinguish convincing AGT signal from staining artefact?
Check whether the pattern fits a secreted protein: plasma-associated signal is plausible, and HPA documents proximal-tubule cell-body and cytotrophoblast staining in the indicated tissues (UniProt P01019; HPA tissue IHC). Do not infer local AGT production solely from extracellular deposits or from staining in an unexpected cell type, because secreted protein location and expression location can differ (HPA tissue IHC reliability description). Examine section edges and necrotic regions for nonspecific colour, and compare suspicious areas with a no-primary control and adjacent morphology (standard IHC practice). Confirm that peroxidase blocking worked before interpreting DAB deposits as AGT, particularly where endogenous enzyme activity is possible (standard IHC practice).
Boster reagents

Best AGT / Angiotensinogen IHC Antibodies

Human-reactive anti-AGT antibodies have paraffin-section IHC images in lung adenocarcinoma and pancreatic cancer, plus an ICC image in HeLa cells (catalog image captions).

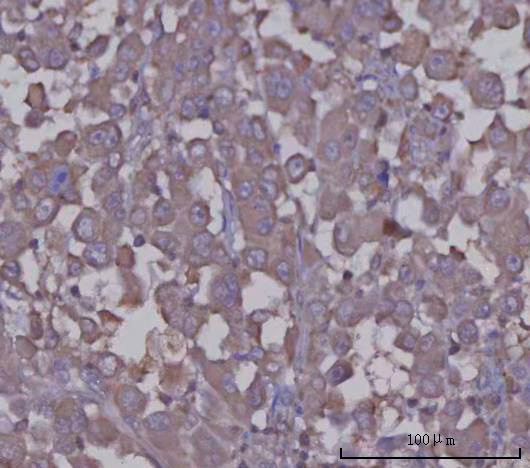
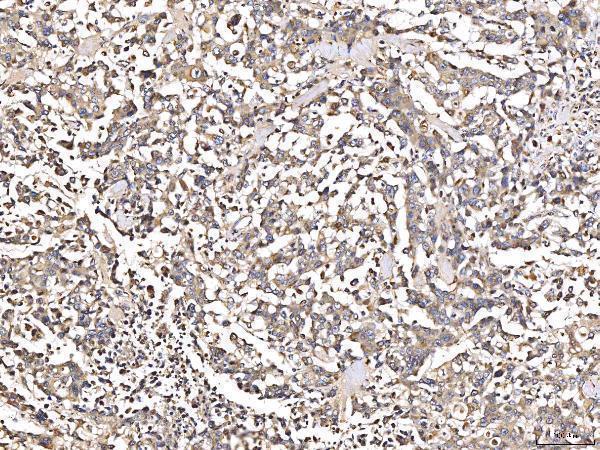
Real IHC data IHC analysis of Angiotensinogen/AGT using anti-Angiotensinogen/AGT antibody (A02103-4). Angiotensinogen/AGT was detected in a paraffin-embedded section of human lung adenocarcinoma tissue. Heat mediated antigen retrieval was performed in EDTA buffer (pH 8.0, epitope retrieval solution). The tissue section was blocked with 10% goat serum. The tissue section was then incubated with 2 μg/ml rabbit anti-Angiotensinogen/AGT Antibody (A02103-4) overnight at 4°C. Peroxidase Conjugated Goat Anti-rabbit IgG was used as secondary antibody and incubated for 30 minutes at 37°C. The tissue section was developed using HRP Conjugated Rabbit IgG Super Vision Assay Kit (Catalog # SV0002) with DAB as the chromogen.
Anti-Angiotensinogen/AGT Antibody ®
Cat # A02103-4
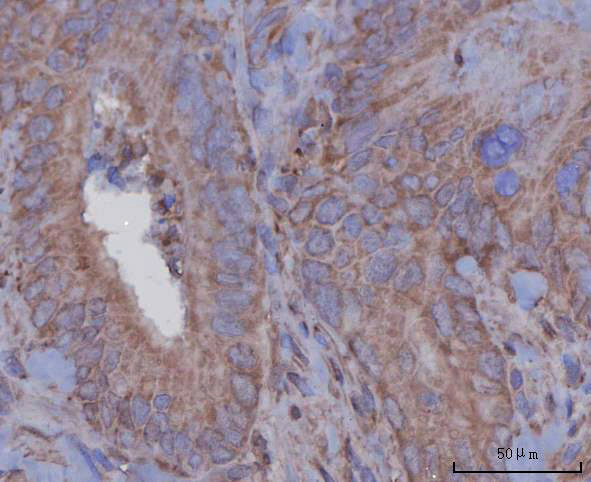
Real IHC data IHC analysis of Angiotensinogen/AGT using anti-Angiotensinogen/AGT antibody (A02103-3). Angiotensinogen/AGT was detected in a paraffin-embedded section of human pancreatic cancer tissue. Heat mediated antigen retrieval was performed in EDTA buffer (pH 8.0, epitope retrieval solution). The tissue section was blocked with 10% goat serum. The tissue section was then incubated with 2 μg/ml rabbit anti-Angiotensinogen/AGT Antibody (A02103-3) overnight at 4°C. Peroxidase Conjugated Goat Anti-rabbit IgG was used as secondary antibody and incubated for 30 minutes at 37°C. The tissue section was developed using HRP Conjugated Rabbit IgG Super Vision Assay Kit (Catalog # SV0002) with DAB as the chromogen.
Anti-Angiotensinogen/AGT Antibody ®
Cat # A02103-3
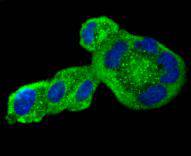
Real IF data ICC staining Angiotensinogen in Hela cells (green). The nuclear counter stain is DAPI (blue). Cells were fixed in paraformaldehyde, permeabilised with 0.25% Triton X100/PBS.
Anti-Angiotensinogen AGT Antibody
Cat # A02103-2

A02103-4 has a human lung adenocarcinoma IHC image, and A02103-3 has a human pancreatic cancer IHC image (respective catalog IHC image captions). A02103-2 has an ICC image in HeLa cells (A02103-2 ICC image caption).

Which to pick: For tissue IHC, choose A02103-4 for human lung adenocarcinoma or A02103-3 for human pancreatic cancer; each has its own paraffin-section image with EDTA pH 8.0 retrieval, and neither caption reports the fixative (respective catalog IHC image captions). For IF/ICC, choose A02103-2, which lists both applications and has a paraformaldehyde-fixed HeLa cell ICC image (A02103-2 catalog applications and ICC image caption). No cross-species choice is supported: all three list Human reactivity only (catalog reactivity fields).

Each figure is that product's own IHC / IF validation image from its datasheet.

References

  1. UniProt Consortium. UniProt entry P01019 (ANGT_HUMAN, Angiotensinogen).
  2. Human Protein Atlas. AGT tissue IHC expression (reliability: Supported).
  3. Human Protein Atlas. AGT subcellular location (ICC-IF): Membrane, Secreted.
  4. Human Protein Atlas. AGT antibody validation summary (1 antibodies).
  5. Expression of angiotensinogen during hepatic fibrogenesis and its effect on hepatic stellate cells. Medical science monitor : international medical journal of experimental and clinical research 2011 — PMC3560510.
  6. Mismatch repair deficiency does not mediate clinical resistance to temozolomide in malignant glioma. Clinical cancer research : an official journal of the American Association for Cancer Research 2008 — PMC2830553.
  7. Glomerular angiotensinogen is induced in mesangial cells in diabetic rats via reactive oxygen species--ERK/JNK pathways. Hypertension research : official journal of the Japanese Society of Hypertension 2010 — PMC2974762.
  8. Evidence of Augmented Intrarenal Angiotensinogen Associated With Glomerular Swelling in Gestational Hypertension and Preeclampsia: Clinical Implications. Journal of the American Heart Association 2019 — PMC6662362.
  9. PubMed PMID:6089875 — UniProt-cited evidence.
  10. PubMed PMID:2924688 — UniProt-cited evidence.
  11. PubMed PMID:1692023 — UniProt-cited evidence.