AKT3 / RAC-gamma serine/threonine-protein kinase · IHC design guide

Design Immunohistochemistry for AKT3

Plan chromogenic AKT3 IHC in paraffin sections around variable cytoplasmic and nuclear staining (HPA tissue IHC). This guide covers tissue controls, cell-specific scoring, and the catalog antibody’s 1:50–1:100 IHC-P starting dilution (datasheet).

Evidence assembled Oct 2026 · For research use; verify linked source records and product datasheet before use
Immunohistochemistry protocol sheet for AKT3 (IHC for AKT3): expected localisation Cytoplasm and nucleus in tissue IHC (HPA tissue IHC), antibody A00520-1, validated IHC image, and IHC protocol steps
Printable AKT3 IHC protocol sheet — expected localisation Cytoplasm and nucleus in tissue IHC (HPA tissue IHC), antibody A00520-1, controls and protocol steps. Open the full AKT3 IHC guide →

AKT3 Immunohistochemistry Experimental Design Guide

Expected localisation, validated protocols, controls and antibodies — the at-a-glance facts below, then the full design guide.

Must know before staining
Expected localisation Cytoplasm and nucleus in tissue IHC (HPA tissue IHC)
Staining pattern Variable cytoplasmic and nuclear staining across cell types (HPA tissue IHC)
Antigen retrieval Tris-EDTA pH 9.0 HIER, 95–98 °C, 20 min (rule: nuclear antigen)
Positive control ⓘ Caudate+4 more · see all
Negative control ⓘ Salivary gland+1 more · see all
Important caveats
Reasons your staining may differ from the expected pattern.
Fixation Keep formalin fixation consistent across samples (standard IHC practice; not target-specific)
Caveat Closely related AKT1/2 warrant antibody-specificity controls (UniProt)
Regulation Adult and fetal tissue expression differs (UniProt)
Isoform / epitope 2 isoforms; epitope coverage is unreported (UniProt)
Section 1

Recommended AKT3 IHC & IF Protocols

The catalog antibody protocol is followed by 2 published AKT3 IHC protocols for oral tissues and skeletal muscle (PMC13450933; PMC3698551).

Recommended immunohistochemistry (IHC-P) protocol parameters
SampleFFPE human cancer tissue (datasheet A00520-1)
FixationImage formalin-fixed; duration unreported (datasheet A00520-1); verify before use.
Sectioning4–5 µm sections on charged slides (standard)
DeparaffinisationXylene, graded ethanol series to water (standard)
Antigen retrievalHeat-induced epitope retrieval in Tris-EDTA buffer, pH 9.0, 20 min at 95–98 °C (standard rule: nuclear antigen)
Peroxidase block3% H2O2, 10 min, room temperature (standard)
Blocking10% normal serum of the secondary host, 30 min, room temperature (standard)
Primary antibodyRabbit anti-AKT3, 1:50-1:100 (datasheet A00520-1)
Primary incubationOvernight at 4 °C (standard)
DetectionHRP-polymer secondary, DAB chromogen 5–10 min (standard)
CounterstainHematoxylin, blue, dehydrate and mount (standard)
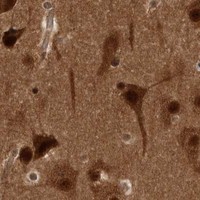
Expected resultAKT3-positive staining in neuronal cells of caudate (HPA tissue IHC: High). HPA tissue profile: General cytoplasmic and nuclear expression at variable levels. No signal in the no-primary control.
💡Decision noteStart with Tris-EDTA pH 9.0 retrieval at 95–98 °C for 20 min (page retrieval rule; UniProt: nuclear localisation).
Section 2

What Is the Expected AKT3 Staining Pattern?

AKT3 staining is expected mainly in cytoplasm and nuclei, with variable intensity across tissues (HPA: Approved IHC; medium consistency with RNA; general cytoplasmic and nuclear expression). Caudate and hippocampal neurons, cerebral cortical glia, and thyroid and gallbladder glandular cells show high staining (HPA: tissue IHC). AKT3 has no transmembrane segment; membrane association can follow cell stimulation (UniProt Q9Y243: topology and subcellular location).

What am I looking at on my slide?
Cytoplasmic and nuclear staining in caudate neurons or cerebral cortical glia.This matches the reported compartments and high staining in those cell types (HPA: tissue IHC). Judge intensity against an appropriate control on the same run; high is an HPA observation, not a required intensity in every section (general IHC practice).
Signal appears exclusively at cell borders or in an unexpected structural compartment.Check for artefact or nonspecific detection: HPA describes general cytoplasmic and nuclear IHC staining (HPA: tissue IHC). Some membrane association is biologically possible after stimulation (UniProt Q9Y243: subcellular location), so membrane signal alone does not establish an error.
Strong staining appears in salivary gland glandular cells or splenic red pulp cells.Those cell populations were not detected in the supplied HPA IHC profile (HPA: tissue IHC). Review cell identification and controls for cross-reactivity or endogenous detection activity (general IHC practice); one discrepant section does not prove either cause.
Broad chromogen deposition obscures cell boundaries and affects tissue compartments uniformly.A diffuse pattern cannot be scored confidently as AKT3 localisation. Review background in a no-primary control, blocking and detection steps (general IHC practice), then reassess the reported cytoplasmic and nuclear pattern (HPA: tissue IHC).
No staining is visible in an expected-positive control section.Caudate neurons and thyroid glandular cells showed high staining in HPA (HPA: tissue IHC), but that does not guarantee every specimen will stain. Check the control's tissue identity and preservation, then review retrieval, antibody dilution and detection (general IHC practice).
💡Expected AKT3 appearanceCall a result positive when identifiable expected cells show discernible cytoplasmic and/or nuclear staining above local background—such as high-staining caudate neurons or thyroid glandular cells (HPA: tissue IHC); widespread cell-free chromogen or equally strong signal in the no-primary control suggests background (general IHC practice).
How each factor affects the staining
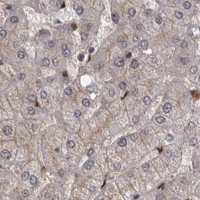
Tissue and cell choiceUse HPA's cell-level observations when choosing controls: hippocampal neurons and gallbladder glandular cells are high, while liver hepatocytes and heart cardiomyocytes are low (HPA: tissue IHC). Whole-organ expectations can miss cell-specific differences.
IHC evidence strengthThe tissue profile is Approved, with medium consistency between staining and RNA expression (HPA: reliability). Two listed antibodies, HPA026441 and CAB013090, are IHC Approved (HPA: antibodies); neither entry here claims Enhanced IHC validation.
Compartment and stimulationNucleus and cytoplasm are reported locations; membrane association follows cell stimulation (UniProt Q9Y243: subcellular location). HPA's general tissue IHC profile is cytoplasmic and nuclear (HPA: tissue IHC), so do not require membrane staining in routine sections.
Isoforms and antibody epitopeTwo AKT3 isoforms are listed (UniProt Q9Y243: isoforms). The supplied evidence gives no antibody epitope or isoform coverage; a staining difference cannot be assigned to an isoform from morphology alone.
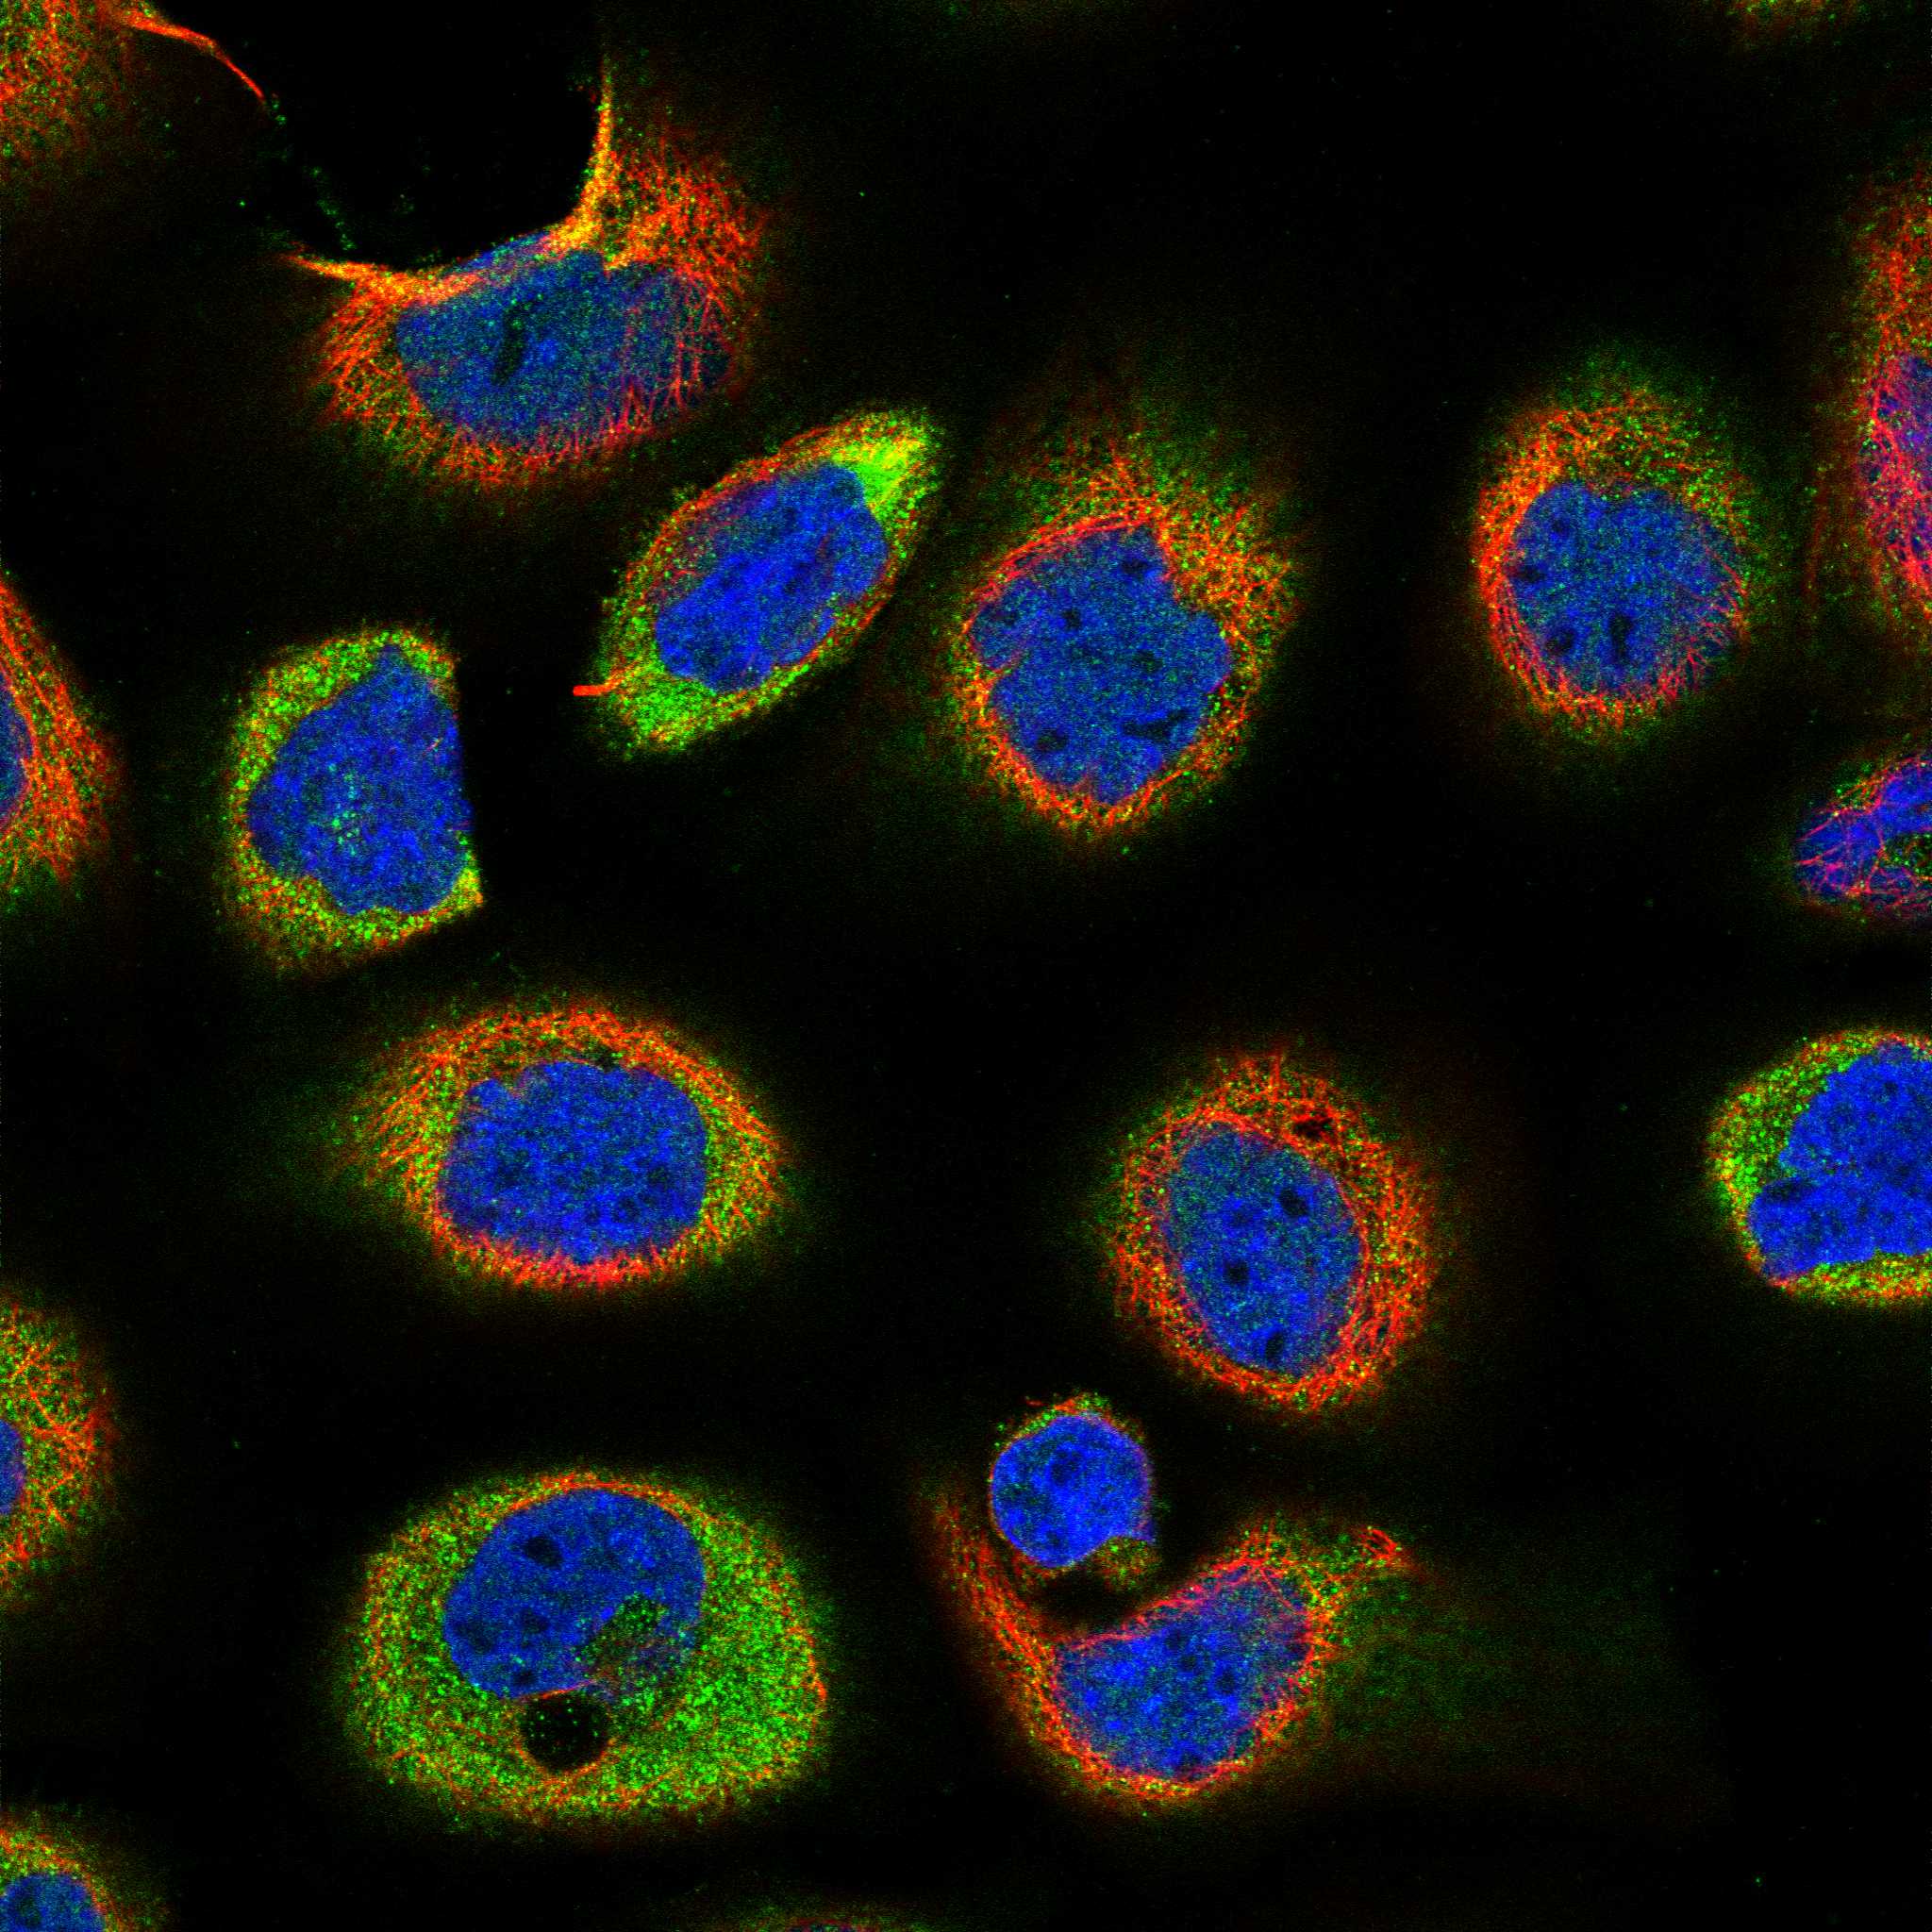
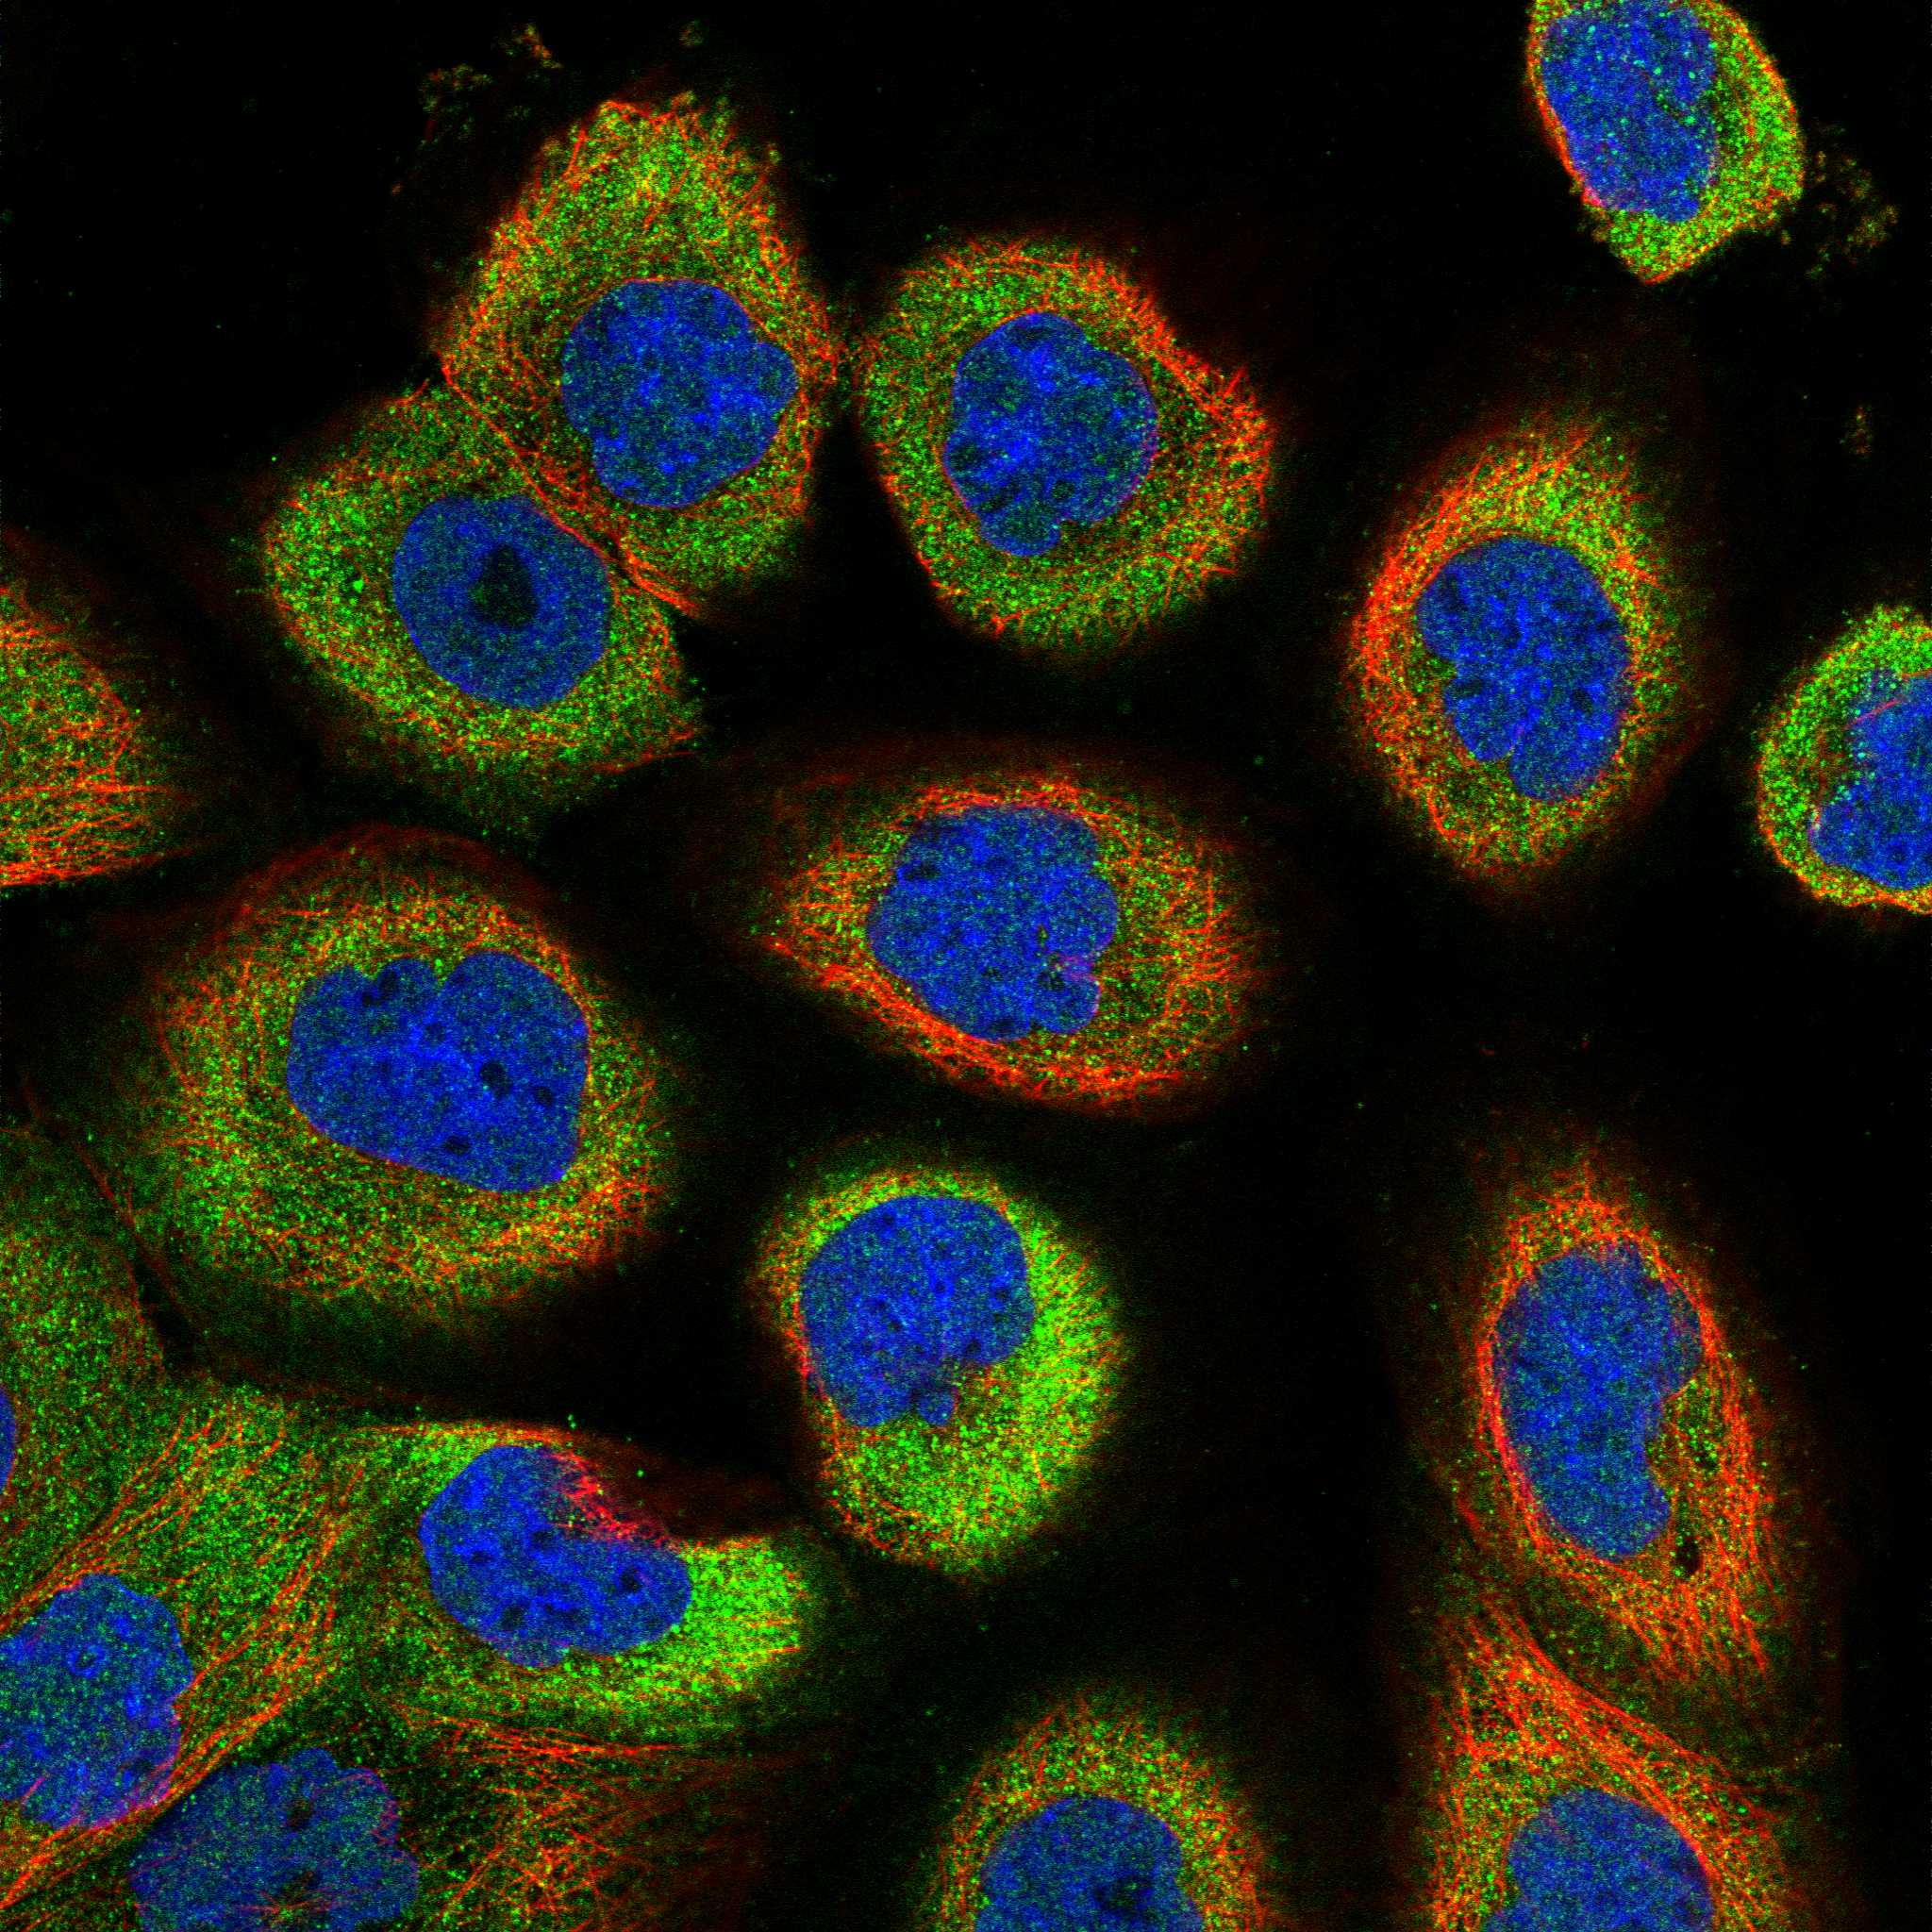
IF/ICC Q&A: where should fluorescence appear?HPA places AKT3 mainly in nucleoplasm and cytosol, with an approved Golgi location (HPA: subcellular ICC-IF). Plasma membrane, primary cilium and basal body are uncertain additional locations (HPA: subcellular ICC-IF); these ICC-IF observations do not define an IHC protocol.
Why is my staining missing, weak or wrong?
SituationLikely causeNext action
Expected-positive control is blank.The run may have failed, or that particular section may not reproduce the reported high-staining population; HPA IHC has medium RNA consistency (HPA: tissue IHC reliability).Confirm the expected cell population is present; review retrieval, dilution, incubation and detection against the run controls (general IHC practice). Do not infer target-specific fixation sensitivity from this result.
Signal is faint in liver hepatocytes or cardiomyocytes.Low staining is reported for these cells (HPA: tissue IHC). A weak result there is less informative than a high-staining control.Compare with caudate neurons or thyroid glandular cells, reported high by HPA (HPA: tissue IHC), before changing assay conditions (general IHC practice).
Nuclear signal is absent but cytoplasmic signal is clear.The reported IHC profile includes both compartments at variable levels (HPA: tissue IHC); distribution may differ among cells or sections.Inspect a known-positive cell population and nuclear counterstain, then compare staining with the no-primary control (general IHC practice). Avoid calling the result negative solely because one compartment is faint.
Strong staining appears in a reported not-detected cell population.Salivary gland glandular cells and splenic red pulp cells were not detected in the supplied HPA profile (HPA: tissue IHC); nonspecific primary binding or endogenous detection activity is possible (general IHC practice).Verify the cell type, inspect a no-primary control, and assess the relevant endogenous enzyme block for chromogenic detection (general IHC practice). Treat the discrepancy as unresolved until controls clarify it.
Diffuse brown background masks individual cells.Excess chromogen development, incomplete blocking or endogenous enzyme activity can obscure localisation (general IHC practice); the supplied sources do not identify a specific AKT3 cause.Compare tissue and no-primary controls, review blocking and development time, and score only clearly localised cellular signal (general IHC practice).
Predominantly membrane-edge staining is seen.Membrane association can occur after stimulation (UniProt Q9Y243: subcellular location), whereas routine HPA tissue IHC is generally cytoplasmic and nuclear (HPA: tissue IHC).Check whether the edge signal is confined to cells, compare controls, and report it separately from the established cytoplasmic and nuclear pattern (general IHC practice).

Sample controls for AKT3 IHC & IF

🧪Run caudate first: neuronal cells should stain (HPA: High in caudate neuronal cells). Use salivary gland glandular cells as the negative tissue (HPA: Not detected); cells without specific signal within the caudate section should show counterstain only, with background judged against the no-primary slide (standard IHC practice).
Positive control tissue: Caudate (Neuronal cells, HPA High)
Negative control tissue: Salivary gland (HPA Not detected)
ICC-IF cell lines (HPA subcellular resource): HPA ICC-IF images show AKT3 in A-431, U-251MG, U2OS, ASC52telo, RPTEC/TERT1, hTERT-RPE1 (serum starved), KOLF2.1J, with annotated localisation: Nucleoplasm (supported), Golgi apparatus (approved), Cytosol (supported) (HPA subcellular).
Technical controls: Include no-primary (secondary-only) and host-species- and immunoglobulin-class-matched isotype controls, plus AKT3-knockout tissue or cells as a biological specificity control (standard IHC practice). Quench endogenous peroxidase for chromogenic IHC and assess neuronal autofluorescence if examining the caudate by IF (standard IHC/IF practice).
⚠️Feasibility: No AKT3-specific fixation window, fixation effect, or antigen-retrieval dependency is reported in the supplied evidence; optimize retrieval for the IHC-validated antibody (supplied evidence; standard IHC practice). The selected A00520-1 caption explicitly describes formalin-fixed, paraffin-embedded human cancer tissue detected with peroxidase and AEC, but gives no fixation duration (selected tissue-IHC caption). The supplied evidence does not establish that frozen sections or IF are easier; neuronal autofluorescence can complicate IF interpretation in caudate (standard IF practice).

HPA tissue IHC evidence for AKT3

Comprehensive Human Protein Atlas IHC scoring per tissue (reliability: Approved — Medium consistency between antibody staining and RNA expression data.). Rows are taken directly from the HPA tissue chart — click any row's HPA link to view the source.

Positive expression · recommended positive controls

TissueCell typeLevelEvidenceSource
Caudate Neuronal cells High Protein (IHC) HPA →
Cerebral cortex Glial cells High Protein (IHC) HPA →
Gallbladder Glandular cells High Protein (IHC) HPA →
Hippocampus Neuronal cells High Protein (IHC) HPA →
Nasopharynx Ciliated cells (ciliary rootlets) High Protein (IHC) HPA →

Undetected expression · recommended negative controls

TissueCell typeLevelEvidenceSource
Salivary gland Glandular cells Not detected Protein (IHC) HPA →
Spleen Cells in red pulp Not detected Protein (IHC) HPA →
Section 3

Advanced AKT3 IHC Tips

Troubleshoot AKT3 staining in chromogenic paraffin-section IHC, using localisation, tissue patterns and controls to assess signal specificity.

How should I adjust retrieval when AKT3 staining is weak or uneven?
Start with Tris-EDTA at pH 9.0, heated to 95–98 °C for 20 min (page retrieval setting). If staining is weak, compare a shorter and longer heating time on adjacent sections while keeping buffer and detection conditions fixed; record tissue damage alongside signal. AKT3 can appear in both nuclei and cytoplasm (HPA: general cytoplasmic and nuclear expression), so assess retrieval in each compartment rather than optimizing for one alone. Include a matched section without primary antibody and a consistently stained reference section to distinguish increased antigen signal from increased background.
Could fixation explain inconsistent AKT3 staining between paraffin blocks?
Target-specific sensitivity of AKT3 to fixation duration is unknown from the supplied evidence, so a difference between blocks cannot be assigned to fixation alone. Compare sections with documented fixation and processing histories, applying the same pH 9.0 retrieval at 95–98 °C for 20 min (page retrieval setting). Process a reference section in each staining run and inspect morphology, nuclear detail and tissue edges before interpreting signal differences. If histories vary, report them with the staining results and repeat on comparably processed material before attributing a weak compartment-specific signal to biology.
Which AKT3 staining compartments are plausible in paraffin sections?
Score nuclear and cytoplasmic staining separately because tissue IHC shows both at variable levels (HPA: general cytoplasmic and nuclear expression). UniProt also lists membrane localisation after cell stimulation (UniProt Q9Y243: subcellular location), but a membrane-enriched pattern alone does not establish stimulation or kinase activation. AKT3 has no transmembrane segment (UniProt Q9Y243: topology), so avoid interpreting a sharp cell outline as evidence of an integral membrane protein. Compare compartment patterns with cell morphology and a matched negative control, especially where precipitate or section folds can create apparent rim staining.
How can I assess whether staining distinguishes AKT3 isoforms and activation states?
Confirm the antibody’s documented immunogen and epitope before assigning staining to either AKT3 splice isoform (UniProt Q9Y243: 2 isoforms). Map the epitope against the PH domain (5–107), kinase domain (148–405) or C-terminal region (406–479) where possible (UniProt Q9Y243: domains). AKT3 is closely related to AKT1 and AKT2 (UniProt Q9Y243: function), so test specificity with an appropriate genetic loss control if isoform discrimination matters. Total-AKT3 staining cannot by itself establish phosphorylation or activity, including phosphorylation at Thr305 or Ser472 (UniProt Q9Y243: modified residues).
How should I cross-check an AKT3 IHC pattern by multiplex immunofluorescence?
For a separate IF/ICC assay, pair AKT3 with a validated marker for the expected cell type, such as a neuronal marker when examining neuronal cells in caudate (HPA: high in caudate neuronal cells). Select spectrally separated fluorophores after measuring tissue autofluorescence, and include single-stain and no-primary controls to check bleed-through and background. Permeabilise to expose intracellular epitopes because AKT3 is found in nucleoplasm and cytosol (HPA subcellular: supported locations); adjust detergent conditions to preserve morphology and marker staining. Compare cell-level localisation with chromogenic IHC, but validate the IF/ICC antibody and settings independently.
What should I check when AKT3 chromogenic staining looks diffuse?
Inspect a no-primary section for secondary-reagent binding and chromogen deposition before changing the AKT3 antibody concentration. In peroxidase-based IHC, include an endogenous peroxidase block as a general workflow step, and check whether residual color follows blood-rich or damaged regions rather than intact cells. The selected antibody has been shown on formalin-fixed paraffin-embedded human cancer tissue with peroxidase-linked secondary detection and AEC staining (caption: A00520-1). Titrate primary antibody and detection incubation on adjacent sections, comparing nuclear and cytoplasmic signal with the matched no-primary control (HPA: general cytoplasmic and nuclear expression).
How should I quantify AKT3 staining across tissue regions? ⚠ ANSWER MARKED FOR VERIFICATION
Choose an H-score using staining intensity and the percentage of positive cells, or report percentage positive alone if intensity cannot be calibrated consistently. Score nuclei and cytoplasm separately because both compartments show variable tissue staining (HPA: general cytoplasmic and nuclear expression). Define the cell population and region before scoring, then normalise positive-cell counts to all evaluable cells of that population, or stained area to tissue area in mm². Hold retrieval, chromogen exposure, imaging and thresholds constant across sections, and exclude folds, necrosis and tissue edges using the same documented rules for every sample.
How can I distinguish credible AKT3 positivity from staining artefacts?
A credible pattern should follow intact cells and plausible nuclear or cytoplasmic compartments (HPA: general cytoplasmic and nuclear expression). Compare cell identity with tissue context: neuronal cells in caudate and glial cells in cerebral cortex show high staining, whereas salivary glandular cells were not detected in the cited tissue profile (HPA: tissue IHC). Treat signal concentrated at section edges, folds or necrosis as suspect, and check no-primary controls for endogenous enzyme or reagent background. Finally, do not equate positive total-AKT3 IHC with active kinase, because the protein has separately annotated phosphorylation sites (UniProt Q9Y243: modified residues).
Boster reagents

Best AKT3 / RAC-gamma serine/threonine-protein kinase IHC Antibodies

An anti-AKT3 antibody has a human paraffin-section IHC image (catalog image caption); a separate antibody lists human IF/ICC testing (catalog applications and dilution data).

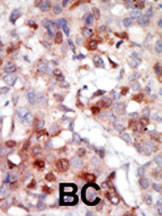
Real IHC data Formalin-fixed and paraffin-embedded human cancer tissue reacted with the primary antibody, which was peroxidase-conjugated to the secondary antibody, followed by AEC staining. This data demonstrates the use of this antibody for immunohistochemistry; clinical relevance has not been evaluated. BC = breast carcinoma; HC = hepatocarcinoma.
Anti-AKT3 Antibody (Center)
Cat # A00520-1

A00520-1 is the sole rendered card; its image shows chromogenic staining of formalin-fixed, paraffin-embedded human cancer tissue (catalog image caption). It lists IHC-P use and reactivity with human, monkey, mouse, and rat, while the supplied IHC image documents human tissue only (catalog applications, reactivity, and image caption).

Which to pick: Choose A00520-1 for tissue IHC: it is a rabbit polyclonal antibody listed for IHC-P at 1:50–1:100, with an image of formalin-fixed, paraffin-embedded human tissue (catalog host, dilution data, and image caption). For IF/ICC, A00520-2 is the rabbit polyclonal option listed for human immunocytochemistry/immunofluorescence at 5 μg/ml; no IF image is supplied (catalog applications, dilution data, and image data). A00520-1 has the broader listed species reactivity, including monkey, but its IHC image establishes staining only in human tissue (catalog reactivity and image caption).

Each figure is that product's own IHC / IF validation image from its datasheet.

References

  1. UniProt Consortium. UniProt entry Q9Y243 (AKT3_HUMAN, RAC-gamma serine/threonine-protein kinase).
  2. Human Protein Atlas. AKT3 tissue IHC expression (reliability: Approved).
  3. Human Protein Atlas. AKT3 subcellular location (ICC-IF): Mainly localized to the nucleoplasm, the Golgi apparatus and cytosol. In addition localized to the plasma membrane, primary cilium and basal body..
  4. Human Protein Atlas. AKT3 antibody validation summary (2 antibodies).
  5. AKT3 and α-SMA in oral submucous fibrosis and oral squamous cell carcinoma with concomitant oral submucous fibrosis as potential prognostic indicators. Journal of oral and maxillofacial pathology : JOMFP 2026 — PMC13450933.
  6. Multifunctional Phase-Transition Nanoparticles for Effective Targeted Sonodynamic-Gene Therapy Against Thyroid Papillary Carcinoma. International journal of nanomedicine 2023 — PMC10163883.
  7. AKT3 drives adenoid cystic carcinoma development in salivary glands. Cancer medicine 2018 — PMC5806106.
  8. miR-29 targets Akt3 to reduce proliferation and facilitate differentiation of myoblasts in skeletal muscle development. Cell death & disease 2013 — PMC3698551.
  9. PubMed PMID:10092583 — UniProt-cited evidence.
  10. PubMed PMID:10208883 — UniProt-cited evidence.
  11. PubMed PMID:10491192 — UniProt-cited evidence.