This website uses cookies to ensure you get the best experience on our website.


- Table of Contents
Use liver hepatocytes or kidney tubules as positive tissue controls and expect cytoplasmic ALDOB staining (HPA tissue IHC). This paraffin-section guide covers the catalog antibody’s 0.5–1 μg/mL IHC range (datasheet A03893-2) and chromogenic detection controls (standard IHC practice).

Expected localisation, validated protocols, controls and antibodies — the at-a-glance facts below, then the full design guide.
| Expected localisation | Cytoplasmic staining in selected tissues (HPA tissue IHC) | |
| Staining pattern | Tubule cells, hepatocytes and intestinal endocrine cells: cytoplasmic (HPA tissue IHC) | |
| Antigen retrieval | Citrate pH 6 HIER, heat-mediated (datasheet A03893-2) | |
| Positive control | Kidney+3 more · see all | |
| Negative control | Adipose tissue+4 more · see all |
| Fixation | Matched tissue-IHC evidence does not establish the fixation claim. Validate the specimen-specific method before use. (selected-SKU IHC image A03893-2) | |
| Caveat | Endogenous peroxidase may add DAB background in liver (standard IHC practice) | |
| Regulation | Expression regulation is unreported in the supplied evidence (UniProt; HPA tissue IHC) | |
| Isoform / epitope | No annotated isoforms; epitope location is unspecified (UniProt) |
The catalog antibody’s IHC-P protocol is paired with published ALDOB staining methods for hepatocellular carcinoma, colorectal lesions, and gastric tissue (PMC9834807; PMC6606928; PMC5065259).
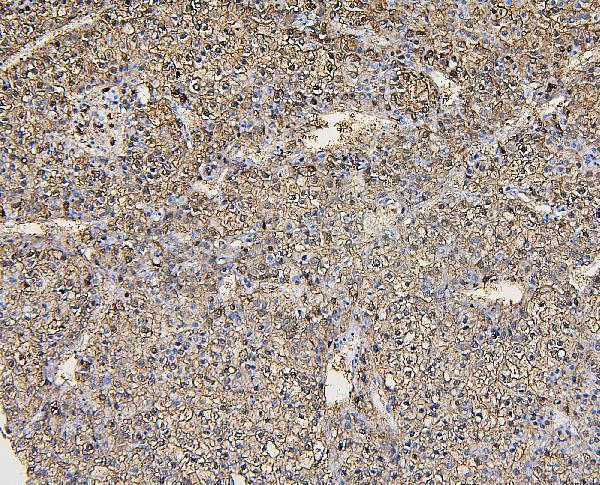
| Sample | Paraffin-embedded human liver cancer tissues; fixative not specified (datasheet A03893-2) |
| Fixation | Image fixative and duration unreported (datasheet A03893-2); verify before use. |
| Sectioning | 4–5 µm sections on charged slides (standard) |
| Deparaffinisation | Xylene, graded ethanol series to water (standard) |
| Antigen retrieval | Heat retrieval: Citrate pH 6, 20 min (datasheet A03893-2) |
| Peroxidase block | 3% H2O2, 10 min, room temperature (standard) |
| Blocking | 10% goat serum (datasheet A03893-2) |
| Primary antibody | Rabbit anti-ALDOB, 0.5-1μg/ml (datasheet A03893-2) |
| Primary incubation | Overnight at 4 °C (datasheet A03893-2) |
| Detection | Streptavidin-biotin complex (SABC), DAB chromogen (datasheet A03893-2) |
| Counterstain | Hematoxylin, blue, dehydrate and mount (standard) |
| Expected result | ALDOB-positive staining in cells in tubules of kidney (HPA tissue IHC: High). HPA tissue profile: Selective cytoplasmic expression in renal tubules, hepatocytes, small intestine and duodenum. No signal in the no-primary control. |
ALDOB should appear predominantly in the cytoplasm of renal tubular cells and hepatocytes, with staining also reported in intestinal endocrine cells (HPA tissue IHC: selective cytoplasmic expression; cell-level scores). This fits a cytosolic protein with no transmembrane segment (UniProt P05062: localization and topology). HPA rates the tissue IHC pattern Enhanced because antibody staining is highly consistent with RNA expression (HPA tissue IHC: reliability description).
| Strong cytoplasmic staining in kidney tubules and hepatocytes. | This matches the reported high cell-level signal in both tissues (HPA tissue IHC: kidney and liver, High). Judge the pattern in the named cells, alongside tissue morphology and the negative control (general IHC practice). |
| Cytoplasmic staining in intestinal endocrine cells, stronger in small intestine than duodenum. | The supplied cell-level scores are High in small intestine and Medium in duodenum (HPA tissue IHC). The broader tissue profile names both sites; it does not establish that every intestinal cell should stain (HPA tissue IHC: profile and cell-level scores). |
| Predominantly nuclear or crisp cell-surface staining in a known-positive tissue. | Those patterns disagree with the expected cytoplasmic distribution and lack of a transmembrane segment (HPA tissue IHC: profile; UniProt P05062: topology). Treat them as suspect and check morphology, detection controls and staining conditions before assigning ALDOB positivity (general IHC practice). |
| Strong staining in adipocytes or other cells scored Not detected. | Adipocytes in adipose tissue are scored Not detected (HPA tissue IHC). Consider nonspecific binding, cross-reactivity or endogenous detection activity; the image alone cannot distinguish these causes (general IHC practice). Compare an appropriate negative tissue and detection-only control (general IHC practice). |
| Weak or absent staining in otherwise interpretable kidney tubules or hepatocytes. | Both are reported High and serve as useful positive tissue comparators (HPA tissue IHC). A missing signal can reflect a staining-run problem or the sampled section; confirm tissue identity and controls, then review the validated assay conditions (general IHC practice). |
| Which compartment should guide scoring? | Cytosol is the primary expectation; UniProt also lists centrosome and centriolar satellite associations (UniProt P05062: localization). HPA tissue IHC reports a cytoplasmic pattern, so do not require visible centrosomal puncta to call a section positive (HPA tissue IHC: profile). |
| Which tissues provide the clearest comparison? | Kidney tubules and hepatocytes are High, intestinal endocrine cells are High in small intestine and Medium in duodenum, and adipocytes in adipose tissue are Not detected (HPA tissue IHC: cell-level scores). These observations support a tissue comparison, not a universal intensity cutoff. |
| How much confidence does antibody validation add? | Three listed antibodies have Enhanced IHC status (HPA antibodies: HPA002198, HPA073201, CAB020827). The tissue profile also has Enhanced reliability through agreement with RNA expression (HPA tissue IHC). Neither label establishes the behavior of an untested antibody or detection system. |
| IF/ICC Q&A: can this IHC pattern be assumed in cultured cells? | No cell lines with ICC-IF images or main subcellular location are supplied (HPA subcellular: unavailable). Cytosolic localization is reported by UniProt (UniProt P05062), but this payload cannot verify an IF/ICC staining pattern, intensity or cell-line control. |
| Situation | Likely cause | Next action |
|---|---|---|
| Kidney or liver positive control has no chromogenic signal. | The expected High cell-level staining is missing (HPA tissue IHC: kidney tubules and hepatocytes). A failed staining or detection step is possible (general IHC practice). | Verify tissue morphology and control performance, then review the IHC-validated antibody's documented retrieval, dilution and detection conditions (general IHC practice). |
| Slide shows widespread haze that obscures cellular boundaries. | Diffuse background prevents reliable comparison with the selective cytoplasmic profile (HPA tissue IHC: profile). Nonspecific binding or detection background is possible (general IHC practice). | Compare the negative and detection-only controls; review blocking, washes and detection exposure, then rescore only interpretable cells (general IHC practice). |
| Signal is mainly nuclear or outlines cell membranes. | The compartment conflicts with cytoplasmic tissue staining and the absence of a transmembrane segment (HPA tissue IHC: profile; UniProt P05062: topology). | Check counterstain and tissue morphology, then compare positive and negative tissues with the same detection run (general IHC practice). |
| Adipocytes stain as strongly as the positive tissue. | Adipose-tissue adipocytes are scored Not detected (HPA tissue IHC). Cross-reactivity or endogenous detection activity may explain the result, but staining alone cannot identify which (general IHC practice). | Inspect a detection-only control and compare the pattern against kidney tubules or hepatocytes stained in the same run (general IHC practice; HPA tissue IHC: High scores). |
| Duodenal staining appears weaker than small-intestine staining. | The supplied endocrine-cell scores differ: Medium in duodenum and High in small intestine (HPA tissue IHC). | Score the identified endocrine-cell compartment and tissue morphology; do not require equal intensity across the two sites (HPA tissue IHC: cell-level scores; general IHC practice). |
| A proposed IF/ICC control gives an ambiguous pattern. | HPA supplies no ICC-IF image-bearing cell lines or main subcellular assignment for ALDOB (HPA subcellular: unavailable). | Keep IF/ICC interpretation provisional and assess its own controls and antibody validation separately; the supplied IHC evidence cannot establish an IF/ICC result (HPA antibodies: ICC status unavailable; HPA subcellular). |
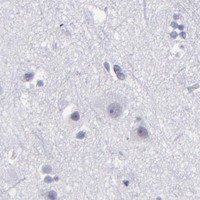

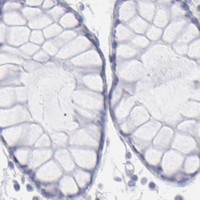
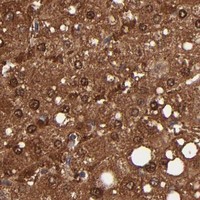
Comprehensive Human Protein Atlas IHC scoring per tissue (reliability: Enhanced — High consistency between antibody staining and RNA expression data.). Rows are taken directly from the HPA tissue chart — click any row's HPA link to view the source.
| Tissue | Cell type | Level | Evidence | Source |
|---|---|---|---|---|
| Kidney | Cells in tubules | High | Protein (IHC) | HPA → |
| Liver | Hepatocytes | High | Protein (IHC) | HPA → |
| Small intestine | Endocrine cells | High | Protein (IHC) | HPA → |
| Duodenum | Endocrine cells | Medium | Protein (IHC) | HPA → |
| Tissue | Cell type | Level | Evidence | Source |
|---|---|---|---|---|
| Adipose tissue | Adipocytes | Not detected | Protein (IHC) | HPA → |
| Adrenal gland | Glandular cells | Not detected | Protein (IHC) | HPA → |
| Appendix | Endocrine cells | Not detected | Protein (IHC) | HPA → |
| Bone marrow | Hematopoietic cells | Not detected | Protein (IHC) | HPA → |
| Breast | Adipocytes | Not detected | Protein (IHC) | HPA → |
Use the catalog antibody’s paraffin section result as the IHC starting point, then judge staining against ALDOB’s expected cell types and cytoplasmic localisation.
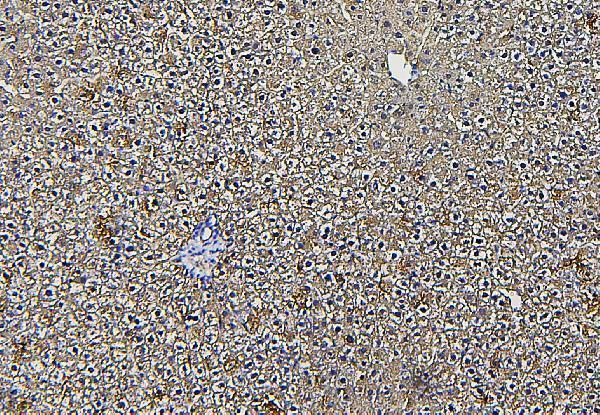
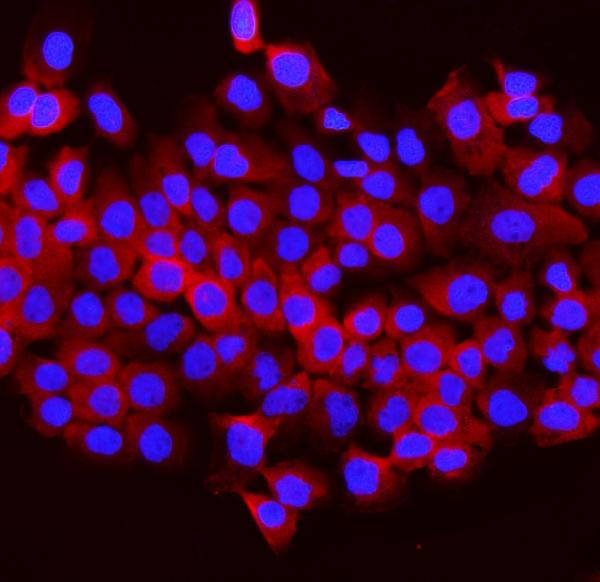
A03893-2 has IHC images from human liver cancer and rat liver paraffin sections, plus IF/ICC images from A431, CACO-2 and U20S cells (catalog image captions).
A03893-2 is listed for IHC and IF/ICC, with images from human liver cancer and rat liver paraffin sections (catalog applications; IHC image captions). Its IF/ICC images show A431, CACO-2 and U20S cells; listed reactivity covers human, monkey, mouse and rat (IF image captions; catalog reactivity).
Which to pick: Choose A03893-2 for paraffin-section IHC: its own captions document citrate retrieval at pH 6 for 20 minutes and primary antibody at 1 μg/ml; the fixative is unreported (A03893-2 IHC image captions). The same SKU is listed for IF/ICC at 2 μg/ml, with cell images in the catalog (catalog applications and dilution; A03893-2 IF image captions). For work across species, A03893-2 lists human, monkey, mouse and rat reactivity, though its IHC images document human and rat specimens; its host is rabbit and clonality is unreported (catalog reactivity and host; A03893-2 IHC image captions; catalog clone field).