This website uses cookies to ensure you get the best experience on our website.


- Table of Contents
Real validated AMOT Western blot protocols, expected-band and isoform facts, troubleshooting for weak or shifted signal, and recommended anti-AMOT WB antibodies. Everything you need to plan the experiment before you commit precious samples.

Expected bands, validated protocols, controls and antibodies — the at-a-glance facts below, then the full design guide.
| Expected band | ~118.1 kDa | |
| Observed band | ~140 kDa | |
| Gel | 5–20% (catalog A04170-1) | |
| Positive control | Colon (IHC candidate; verify WB) +4 more | |
| Negative control | Adipose tissue (IHC candidate; verify WB) |
| PTM | Phosphorylated + Ubl conjugation | |
| Caveat | Phosphorylation-state controls | |
| Gene-set association | MSigDB Hallmark membership | |
| Isoform | 2 isoform(s) |
The A04170-1 protocol combines labelled catalog values with standard starting conditions. Published comparisons retain their own sample, reagent and detection scope.
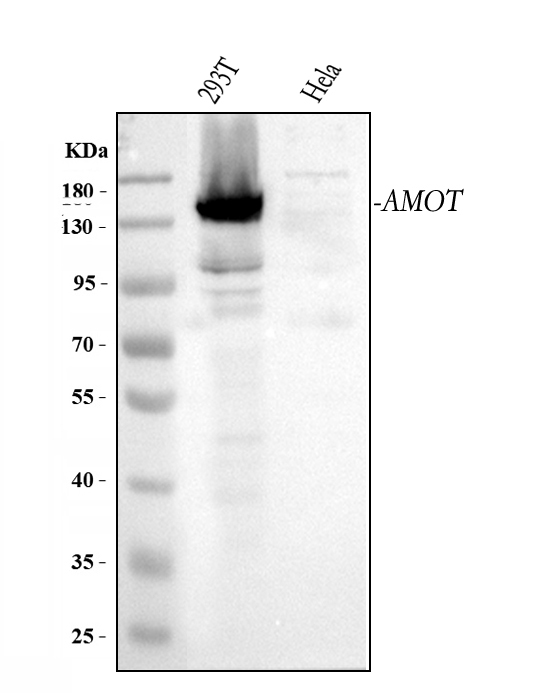
| Sample / lysate | human 293T, human Hela (catalog A04170-1) |
| Gel % | 5–20% (catalog A04170-1) |
| Load | 30 ug; reducing conditions (catalog A04170-1) |
| Transfer | a nitrocellulose membrane at 150 mA for 50-90 minutes (catalog A04170-1) |
| Membrane | nitrocellulose membrane (catalog A04170-1) |
| Blocking | 5% non-fat milk/TBS for 1.5 hour at RT (catalog A04170-1) |
| Primary antibody | A04170-1 · 0.5 μg/mL (catalog A04170-1) |
| Primary incubation | overnight at 4°C (catalog A04170-1) |
| Secondary antibody | goat anti-rabbit IgG-HRP, 1:5000 (catalog A04170-1) |
| Secondary incubation | 1.5 hour at RT (catalog A04170-1) |
| Wash | TBS-0.1%Tween 3 times with 5 minutes each (catalog A04170-1) |
| Detection | ECL (catalog A04170-1) |
AMOT is predicted at 118.1 kDa, while an empirical band appears near 140 kDa; the cause of this difference is not established.
| Band near 140 kDa | Empirical AMOT band in 293T and HeLa lysates; verify identity with appropriate controls |
| Band near 118 kDa | Near the 118.1 kDa sequence-based prediction; identity requires verification |
| Several bands at different positions | Isoforms 1 and 2 are annotated, but distinct migration is unproven |
| One band without a doublet | Annotated isoforms need not appear as separately resolved bands |
| UniProt predicted mass | 118.1 kDa sequence-based reference versus the empirical band near 140 kDa; the difference is unexplained |
| Alternative splicing | Two isoforms are annotated, but separate band sizes are not established |
| Isoform 1 | Its individual mass and migration are not supplied |
| Isoform 2 | Its individual mass and migration are not supplied |
| Situation | Likely cause | Next action |
|---|---|---|
| Band higher than expected | The reported AMOT band is near 140 kDa rather than the 118.1 kDa prediction; the cause is unestablished | Compare with a validated AMOT-positive lysate and confirm identity using an independent antibody or AMOT depletion |
| Band lower than expected | An alternative isoform or protein breakdown is possible, but neither is established for that band | Confirm identity with AMOT depletion and compare antibodies recognizing different regions |
| Multiple bands | Isoforms 1 and 2 are annotated, but their band positions are unknown | Use isoform-aware antibodies or AMOT depletion to identify specific bands |
| Weak or no signal | AMOT abundance or detection may be insufficient in the tested lysate | Include a 293T or HeLa positive-control lysate and check loading and transfer |
| Fragments below expected size | Protein breakdown is possible; fragment sizes are not documented here | Use fresh lysate with protease inhibitors and confirm fragments with AMOT depletion |
Comprehensive Human Protein Atlas IHC scoring per tissue. Rows are taken directly from the HPA tissue chart — click any row's HPA link to view the source.
| Tissue | Cell type | Level | Evidence | Source |
|---|---|---|---|---|
| Colon | endothelial cells | High | Protein (IHC) | HPA → |
| Kidney | cells in glomeruli | High | Protein (IHC) | HPA → |
| Placenta | decidual cells | High | Protein (IHC) | HPA → |
| Cerebral cortex | endothelial cells | Medium | Protein (IHC) | HPA → |
| Lung | macrophages | Medium | Protein (IHC) | HPA → |
| Tissue | Cell type | Level | Evidence | Source |
|---|---|---|---|---|
| Adipose tissue | adipocytes | Not detected | Protein (IHC) | HPA → |
| Adrenal gland | glandular cells | Not detected | Protein (IHC) | HPA → |
| Appendix | glandular cells | Not detected | Protein (IHC) | HPA → |
| Bone marrow | hematopoietic cells | Not detected | Protein (IHC) | HPA → |
| Bronchus | respiratory epithelial cells | Not detected | Protein (IHC) | HPA → |
Deeper troubleshooting and optimisation questions for AMOT, answered from its protein features.
Catalog antibodies with Western blot application and product-specific WB images. Evaluate suitability with the reported sample, controls and experimental conditions.
The catalog reports one anti-AMOT antibody, A04170-1, with a Western blot image from human 293T and HeLa whole cell lysates. The reported band is approximately 140 kDa, versus an expected 118 kDa; the supplied evidence does not resolve this difference.
Which to pick: A04170-1 is the only listed option. Its reported reactivity is human, and its Western blot image uses 293T and HeLa lysates. Consider the 140 kDa observed band versus the 118 kDa expected size when interpreting results.