This website uses cookies to ensure you get the best experience on our website.


- Table of Contents
Plan AOC1 staining in paraffin sections using the observed tissue pattern and positive tissues (HPA tissue IHC). This guide covers the catalog antibody's IHC conditions (datasheet PB10040) and the interpretation of staining from a secreted protein (HPA tissue IHC).

Expected localisation, validated protocols, controls and antibodies — the at-a-glance facts below, then the full design guide.
| Expected localisation | Cytoplasmic and membranous staining (HPA tissue IHC) | |
| Staining pattern | Cytoplasmic and membranous signal in most cell types (HPA tissue IHC) | |
| Antigen retrieval | EDTA pH 8.0 HIER, heat-mediated (datasheet PB10040) | |
| Positive control | Colon+4 more · see all | |
| Negative control | Adipose tissue+4 more · see all |
| Fixation | Matched tissue-IHC evidence does not establish the fixation claim. Validate the specimen-specific method before use. (selected-SKU IHC image PB10040) | |
| Caveat | Secreted AOC1 may appear away from expressing cells (HPA tissue IHC) | |
| Regulation | Expression regulation unreported (UniProt) | |
| Isoform / epitope | Two isoforms; epitope overlap is unspecified (UniProt) |
The catalog antibody has an EDTA pH 8.0 IHC-P protocol (datasheet: PB10040). The four published AOC1 IHC protocols below report their own tissue preparation, staining and detection details (cited PMC methods).
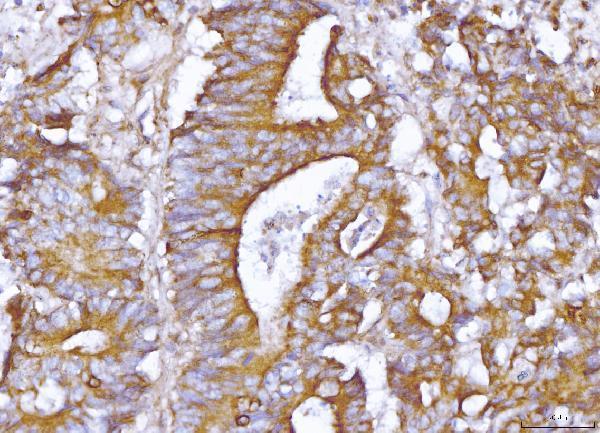
| Sample | Paraffin-embedded human colonic adenoma tissue; fixative not specified (datasheet PB10040) |
| Fixation | Image fixative and duration unreported (datasheet PB10040); verify before use. |
| Sectioning | 4–5 µm sections on charged slides (standard) |
| Deparaffinisation | Xylene, graded ethanol series to water (standard) |
| Antigen retrieval | Heat retrieval: EDTA pH 8.0 (datasheet PB10040); 20 min, 95–100 °C (standard) |
| Peroxidase block | 3% H2O2, 10 min, room temperature (standard) |
| Blocking | 10% goat serum (datasheet PB10040) |
| Primary antibody | Rabbit anti-AOC1, 2-5 μg/ml (datasheet PB10040) |
| Primary incubation | Overnight at 4 °C (datasheet PB10040) |
| Detection | HRP-conjugated secondary, DAB chromogen (datasheet PB10040) |
| Counterstain | Hematoxylin, blue, dehydrate and mount (standard) |
| Expected result | AOC1-positive staining in glandular cells of colon (HPA tissue IHC: High). HPA tissue profile: Cytoplasmic and membranous expression in most cell types. No signal in the no-primary control. |
AOC1 is secreted and associated with the cell membrane despite having no transmembrane segment (UniProt P19801 topology). In tissue IHC, expect cytoplasmic and membranous staining, especially in colon glandular cells and kidney tubule cells (HPA: cytoplasmic and membranous profile; High in both). HPA rates the tissue staining Approved but reports low consistency with RNA expression; secretion can separate the sites of RNA and protein (HPA: reliability description).
| Strong cytoplasmic and membranous stain in colon glands or kidney tubules. | This matches the most informative supplied positive patterns (HPA: High in colon glandular cells and kidney tubule cells). Judge the stained cells and compartments together; a dark area without recognizable cellular staining is less convincing. |
| Predominantly nuclear stain, with little cytoplasmic or membranous signal. | This does not match the reported tissue profile (HPA: cytoplasmic and membranous). Treat isolated nuclear staining as suspect and compare it with the no-primary control before assigning it to AOC1. The supplied sources establish no nuclear pattern. |
| Strong stain in cells expected to be undetected, such as adipocytes. | HPA reports adipocytes as Not detected in adipose tissue (HPA: adipose tissue IHC). Check whether the signal follows a cellular pattern and persists in a no-primary control. Cross-reactivity or endogenous detection activity is possible; staining alone cannot distinguish them. |
| Diffuse color across tissue, spaces and slide background. | AOC1 is secreted, so extracellular signal cannot be dismissed solely by location (UniProt P19801: extracellular space). Yet uniform color that ignores tissue structure is poorly supported by HPA's cellular profile (HPA: cytoplasmic and membranous); assess background controls and detection conditions. |
| No discernible stain in colon glands or kidney tubules. | An absent signal conflicts with the supplied strong positive examples (HPA: High in colon glandular cells and kidney tubule cells). First establish that tissue morphology and detection controls are satisfactory; a failed positive control does not establish biological absence. |
| Secretion and membrane association | UniProt lists extracellular space and cell membrane, with no transmembrane segment (UniProt P19801 topology). Consider extracellular color in context, but anchor scoring to HPA's observed cellular pattern (HPA: cytoplasmic and membranous). |
| Tissue choice and RNA comparison | Colon glands and kidney tubules provide High IHC examples; placenta trophoblasts are Medium (HPA: tissue IHC). HPA reports low staining–RNA consistency and expects RNA and protein locations to differ for a secreted protein (HPA: reliability description). |
| Antibody evidence | Two listed antibodies, HPA031032 and HPA031033, have Approved IHC status (HPA: antibody validation). Neither has an ICC status in the supplied list (HPA: antibody validation); IHC approval alone does not establish an IF/ICC staining pattern. |
| Processing and isoforms | The annotated signal peptide spans residues 1–19, with a mature chain at 20–751; two isoforms are listed (UniProt P19801). Without an antibody epitope or isoform-specific staining record, their effect on this IHC result is unknown. |
| Antigen retrieval and detection | These are general IHC workflow variables. Optimize retrieval and chromogen exposure against a positive tissue and a no-primary control (general IHC practice). The supplied HPA and UniProt records do not establish AOC1-specific fixation sensitivity or retrieval requirements. |
| Situation | Likely cause | Next action |
|---|---|---|
| A known-positive section has no stain. | The expected reference pattern is missing (HPA: High in colon glands and kidney tubules). A detection or retrieval problem is possible, but these records do not identify an AOC1-specific cause. | Confirm tissue identity and an intact positive detection control. Review the IHC-validated antibody's own instructions, then adjust retrieval or detection with paired controls (general IHC practice). Do not score other sections as negative until the positive control works. |
| Only nuclei appear positive. | Nuclear-only signal diverges from the reported cytoplasmic and membranous profile (HPA: tissue IHC). The supplied subcellular record lists secretion and supplies no ICC-IF images (HPA: subcellular). | Inspect matched no-primary and positive tissue sections. Recheck counterstain and chromogen exposure (general IHC practice); require the expected cellular pattern before calling AOC1 positive. |
| Strong color appears in expected-negative cells. | For example, adipocytes are Not detected in the supplied tissue profile (HPA: adipose tissue IHC). Cross-reactivity or endogenous chromogenic activity may explain unexpected color (general IHC practice). | Compare a no-primary control and a known-positive section processed together. If the control is colored, address background or endogenous activity; if it is clean, reassess antibody specificity (general IHC practice). |
| Color is diffuse or obscures cell boundaries. | Secreted AOC1 can occupy extracellular space (UniProt P19801: subcellular location), but uniform color cannot be assigned to AOC1 from that annotation alone. | Compare tissue-free areas and a no-primary control, and reduce excessive detection development if needed (general IHC practice). Score only interpretable cellular staining against the HPA profile (HPA: cytoplasmic and membranous). |
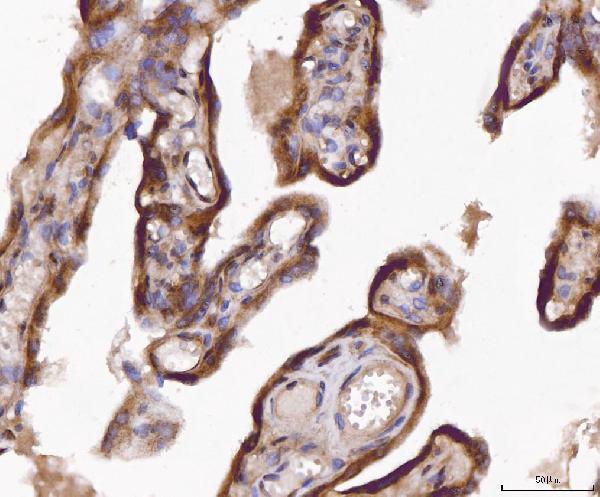
| A placenta section looks weaker than a colon section. | That difference can match the supplied examples: trophoblastic cells are Medium, while colon glandular cells are High (HPA: tissue IHC). It does not by itself show assay failure. | Check the relevant cell populations and compare sections run under the same conditions (general IHC practice). Use the reported tissue-specific levels when judging whether the signal is plausible (HPA: tissue IHC). |
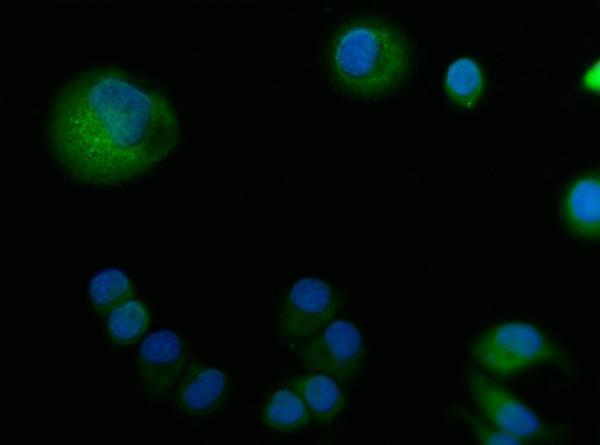
| Can the IHC pattern serve as an IF/ICC expectation? | The supplied HPA subcellular record has no ICC-IF image-bearing cell lines, and the listed antibodies have no ICC status (HPA: subcellular; antibody validation). | Use the separate IF/ICC guide for that application. Treat cytoplasmic and membranous tissue IHC as context only (HPA: tissue IHC); do not infer an IF/ICC protocol or validated fluorescent pattern from these records. |


Comprehensive Human Protein Atlas IHC scoring per tissue (reliability: Approved — Low consistency between antibody staining and RNA expression data. Secreted protein, tissue location of RNA and protein is expected to differ.). Rows are taken directly from the HPA tissue chart — click any row's HPA link to view the source.
| Tissue | Cell type | Level | Evidence | Source |
|---|---|---|---|---|
| Colon | Glandular cells | High | Protein (IHC) | HPA → |
| Kidney | Cells in tubules | High | Protein (IHC) | HPA → |
| Appendix | Lymphoid tissue | Medium | Protein (IHC) | HPA → |
| Duodenum | Glandular cells | Medium | Protein (IHC) | HPA → |
| Placenta | Trophoblastic cells | Medium | Protein (IHC) | HPA → |
| Tissue | Cell type | Level | Evidence | Source |
|---|---|---|---|---|
| Adipose tissue | Adipocytes | Not detected | Protein (IHC) | HPA → |
| Adrenal gland | Glandular cells | Not detected | Protein (IHC) | HPA → |
| Breast | Adipocytes | Not detected | Protein (IHC) | HPA → |
| Bronchus | Respiratory epithelial cells | Not detected | Protein (IHC) | HPA → |
| Caudate | Glial cells | Not detected | Protein (IHC) | HPA → |
Troubleshoot AOC1 staining in paraffin sections by checking retrieval, tissue controls, compartment patterns, and scoring before interpreting chromogenic signal.
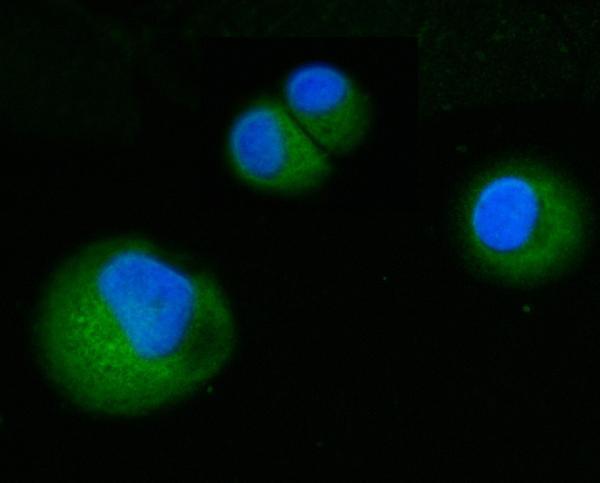
Two anti-AOC1 antibodies have human paraffin-section IHC images and T-47D IF/ICC images (catalog image captions); both list Human and Monkey reactivity (catalog applications/reactivity).
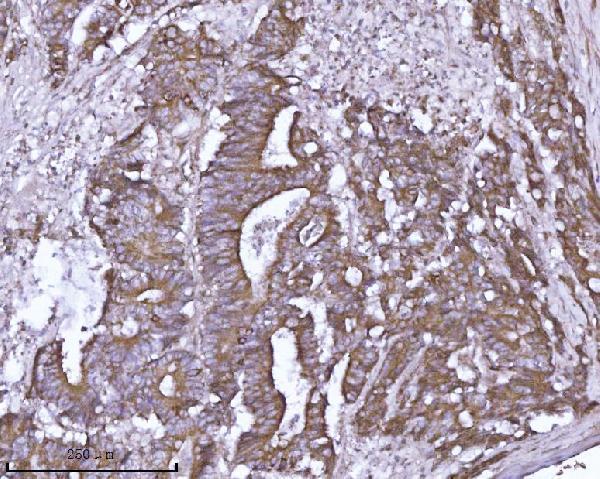
PB10040 has IHC images from human colonic adenoma, placenta and renal cell carcinoma paraffin sections, plus an IF/ICC image from T-47D cells (PB10040 image captions). A08386-1 has an IHC image from a human colorectal adenocarcinoma paraffin section and an IF/ICC image from T-47D cells (A08386-1 image captions).
Which to pick: For tissue IHC, choose PB10040 when its colonic adenoma, placenta or renal cell carcinoma examples match the planned tissue, or A08386-1 for its colorectal adenocarcinoma example; each caption documents a paraffin section, with the fixative unreported (respective IHC image captions). For IF/ICC, A08386-1 lists 5 μg/ml and has a T-47D image; PB10040 also has a T-47D IF/ICC image, though its catalog IF dilution field is unreported (respective catalog dilution fields and IF image captions). For cross-species work, both list Human and Monkey reactivity, while the supplied images document human samples only; clonality is unreported for both (catalog reactivity, image captions and clone fields).