This website uses cookies to ensure you get the best experience on our website.


- Table of Contents
Plan APLP2 IHC-P using granular cytoplasmic staining and high staining in adipocytes as tissue benchmarks (HPA tissue IHC). This guide pairs those benchmarks with the catalog antibody’s 2–5 μg/ml IHC range (datasheet A01232-1).

Expected localisation, validated protocols, controls and antibodies — the at-a-glance facts below, then the full design guide.
| Expected localisation | Granular cytoplasm (HPA tissue IHC); membrane and nucleus annotated (UniProt) | |
| Staining pattern | Granular cytoplasm in most tissues; high in adipocytes (HPA tissue IHC) | |
| Antigen retrieval | EDTA pH 8.0 HIER, heat-mediated (datasheet A01232-1) | |
| Positive control | Adipose tissue+4 more · see all | |
| Negative control | None in HPA (detected in all 45 tissues); use no-primary + isotype controls |
| Fixation | Matched tissue-IHC evidence does not establish the fixation claim. Validate the specimen-specific method before use. (selected-SKU IHC image A01232-1) | |
| Caveat | Staining and RNA show medium consistency (HPA tissue IHC) | |
| Regulation | Stimulus regulation unreported (UniProt) | |
| Isoform / epitope | 6 isoforms; map the epitope to the extracellular or cytoplasmic region (UniProt) |
Compare the catalog antibody’s paraffin-section IHC protocol (datasheet A01232-1) with published retinal and tumor microarray staining protocols (PMC4897877; PMC4385836).
| Sample | Paraffin-embedded human colorectal adenocarcinoma tissue; fixative not specified (datasheet A01232-1) |
| Fixation | Image fixative and duration unreported (datasheet A01232-1); verify before use. |
| Sectioning | 4–5 µm sections on charged slides (standard) |
| Deparaffinisation | Xylene, graded ethanol series to water (standard) |
| Antigen retrieval | Heat retrieval: EDTA pH 8.0 (datasheet A01232-1); 20 min, 95–100 °C (standard) |
| Peroxidase block | 3% H2O2, 10 min, room temperature (standard) |
| Blocking | 10% goat serum (datasheet A01232-1) |
| Primary antibody | Rabbit anti-APLP2, 2-5 μg/ml (datasheet A01232-1) |
| Primary incubation | Overnight at 4 °C (datasheet A01232-1) |
| Detection | HRP-conjugated secondary, DAB chromogen (datasheet A01232-1) |
| Counterstain | Hematoxylin, blue, dehydrate and mount (standard) |
| Expected result | APLP2-positive staining in adipocytes of adipose tissue (HPA tissue IHC: High). HPA tissue profile: Granular cytoplasmic expression in most tissues. No signal in the no-primary control. |
APLP2 should most often appear as granular cytoplasmic staining in tissue IHC (HPA: tissue profile). Strong staining is reported in adipocytes, respiratory epithelial cells, neuronal cells, and several glandular and hematopoietic cell populations (HPA: High in listed cells). APLP2 also has a cell membrane location and one transmembrane segment (UniProt Q06481: subcellular location and topology). HPA rates the tissue profile Approved, with medium consistency between staining and RNA data (HPA: reliability).
| Granular cytoplasmic staining in the expected cells, with stronger signal in a listed high-staining population. | This fits the reported tissue IHC profile (HPA: granular cytoplasmic expression; High in listed cells). Judge the pattern within the relevant cell population rather than requiring every cell in a section to stain equally. |
| Predominantly membrane or nuclear staining, with little granular cytoplasmic signal. | This differs from the usual tissue IHC profile (HPA: granular cytoplasmic expression). Membrane and nucleus are reported APLP2 locations (UniProt Q06481: subcellular location), so treat the finding as uncertain and check controls before calling it an artefact. |
| Strong staining in a cell population expected to show low signal, such as cholangiocytes or ovarian stroma cells. | These populations are listed as Low, rather than negative (HPA: Liver cholangiocytes Low; Ovary ovarian stroma cells Low). Disproportionately strong signal warrants review for cross-reactivity or endogenous detection activity; it does not establish either cause. |
| Broad, diffuse chromogen deposits obscure cell borders or tissue structure. | A diffuse deposit cannot be scored confidently against the reported granular cytoplasmic pattern (HPA: tissue profile). In general IHC practice, inspect background controls and the detection workflow before assigning that signal to APLP2. |
| No convincing signal in a tissue containing a listed high-staining cell population. | Check that the relevant cells are present: HPA reports High staining in bronchial respiratory epithelial cells, adipocytes, and caudate neuronal cells, among others (HPA: tissue IHC). A blank result in those cells calls for assay troubleshooting, not an immediate biological negative. |
| Cell compartment and epitope location | APLP2 has an extracellular region at residues 32–692 and a cytoplasmic region at 717–763 (UniProt Q06481: topology). Antibody epitope location is not supplied, so the record cannot predict whether this reagent favors either region. |
| Tissue and cell population | The HPA tissue profile is broad, with low RNA tissue specificity, but named populations span High and Low IHC staining (HPA: RNA specificity; tissue IHC). Select and score a documented cell population within each section. |
| Antibody evidence | The listed antibody, HPA039319, is Approved for IHC and ICC (HPA: antibody validation). The tissue profile has medium staining–RNA consistency (HPA: reliability); these ratings do not establish identical performance in every specimen. |
| Isoforms and soluble APLP2 | Six isoforms are listed, and a soluble form is described (UniProt Q06481: isoforms and function). Without an antibody epitope or specimen-specific evidence, this record cannot assign an IHC pattern to a particular isoform or soluble product. |
| IF/ICC Q&A: where is APLP2 seen? | The separate ICC-IF evidence reports approved Golgi apparatus and vesicle locations (HPA: subcellular summary). That observation informs IF interpretation; the paraffin-section decision here follows the granular cytoplasmic tissue IHC profile (HPA: tissue profile). |
| Situation | Likely cause | Next action |
|---|---|---|
| A documented high-staining cell population has no visible chromogen. | The result conflicts with the listed High IHC observation, though HPA reports only medium staining–RNA consistency (HPA: tissue IHC; reliability). | Confirm the cells are present, then review the IHC-validated antibody's documented dilution, retrieval, detection, and positive-control performance. Retrieval review is general IHC troubleshooting, not a reported APLP2 fixation effect. |
| Chromogen covers much of the section without a readable cellular pattern. | The result cannot be matched to granular cytoplasmic expression (HPA: tissue profile). Background can also arise from general IHC detection steps. | Compare negative detection controls and inspect blocking, washes, and chromogen development under the laboratory's standard IHC workflow; score only signal that remains cell-associated. |
| Cholangiocytes or ovarian stroma cells stain as strongly as the chosen high-staining reference cells. | Those populations are listed as Low (HPA: tissue IHC), so consider cross-reactivity or endogenous detection activity as possible explanations. | Compare matched controls and cell populations on the same run. Check endogenous enzyme blocking when relevant to the chromogen system; do not label these Low populations as biological negatives. |
| A section shows mainly nuclear or surface signal. | This departs from the usual granular cytoplasmic tissue IHC profile (HPA: tissue profile), although nucleus and cell membrane are reported locations (UniProt Q06481: subcellular location). | Review morphology, control staining, and the antibody's documented target region if available. Describe the observed compartment without calling it specific solely from topology. |
| Signal differs sharply between two tissues or between cell populations in one tissue. | HPA reports broad expression with distinct High and Low cell-level IHC observations (HPA: RNA specificity; tissue IHC). | Identify the cells being compared and score each population separately. Use the reported level for that population as context rather than treating a whole tissue as uniformly positive. |
| ICC-IF shows punctate signal that seems unlike the paraffin IHC result. | Golgi apparatus and vesicles are approved ICC-IF locations, while tissue IHC is described as granular cytoplasmic (HPA: subcellular summary; tissue profile). | Interpret each result against its application-specific HPA pattern. Use the separate IF/ICC guide for imaging decisions; this IHC section does not supply an IF protocol. |
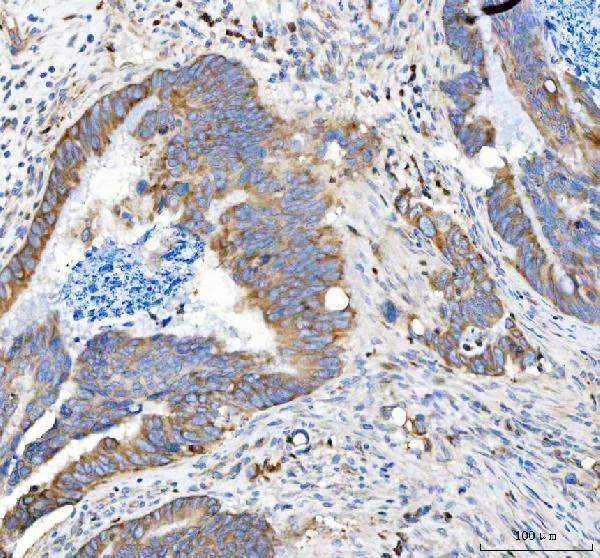
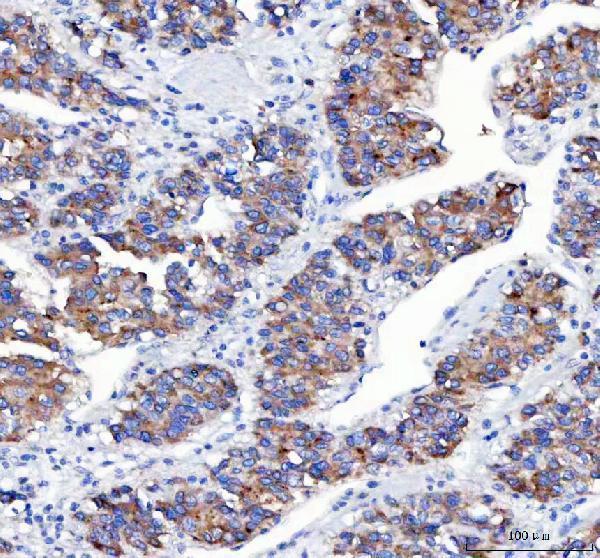
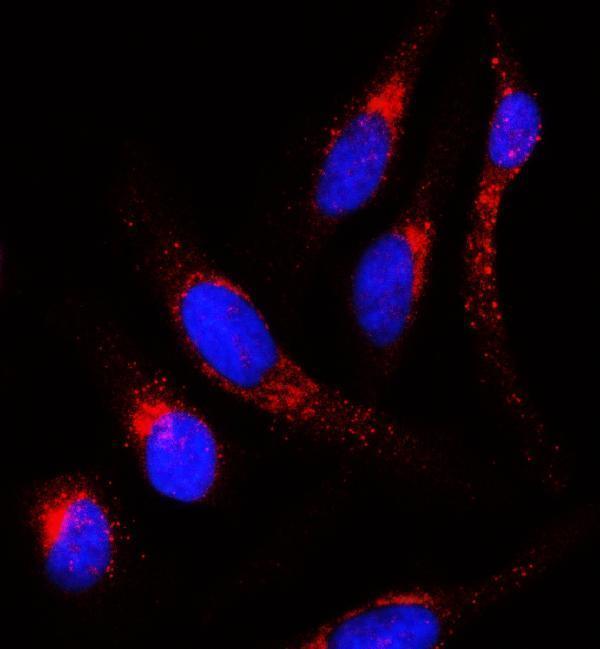


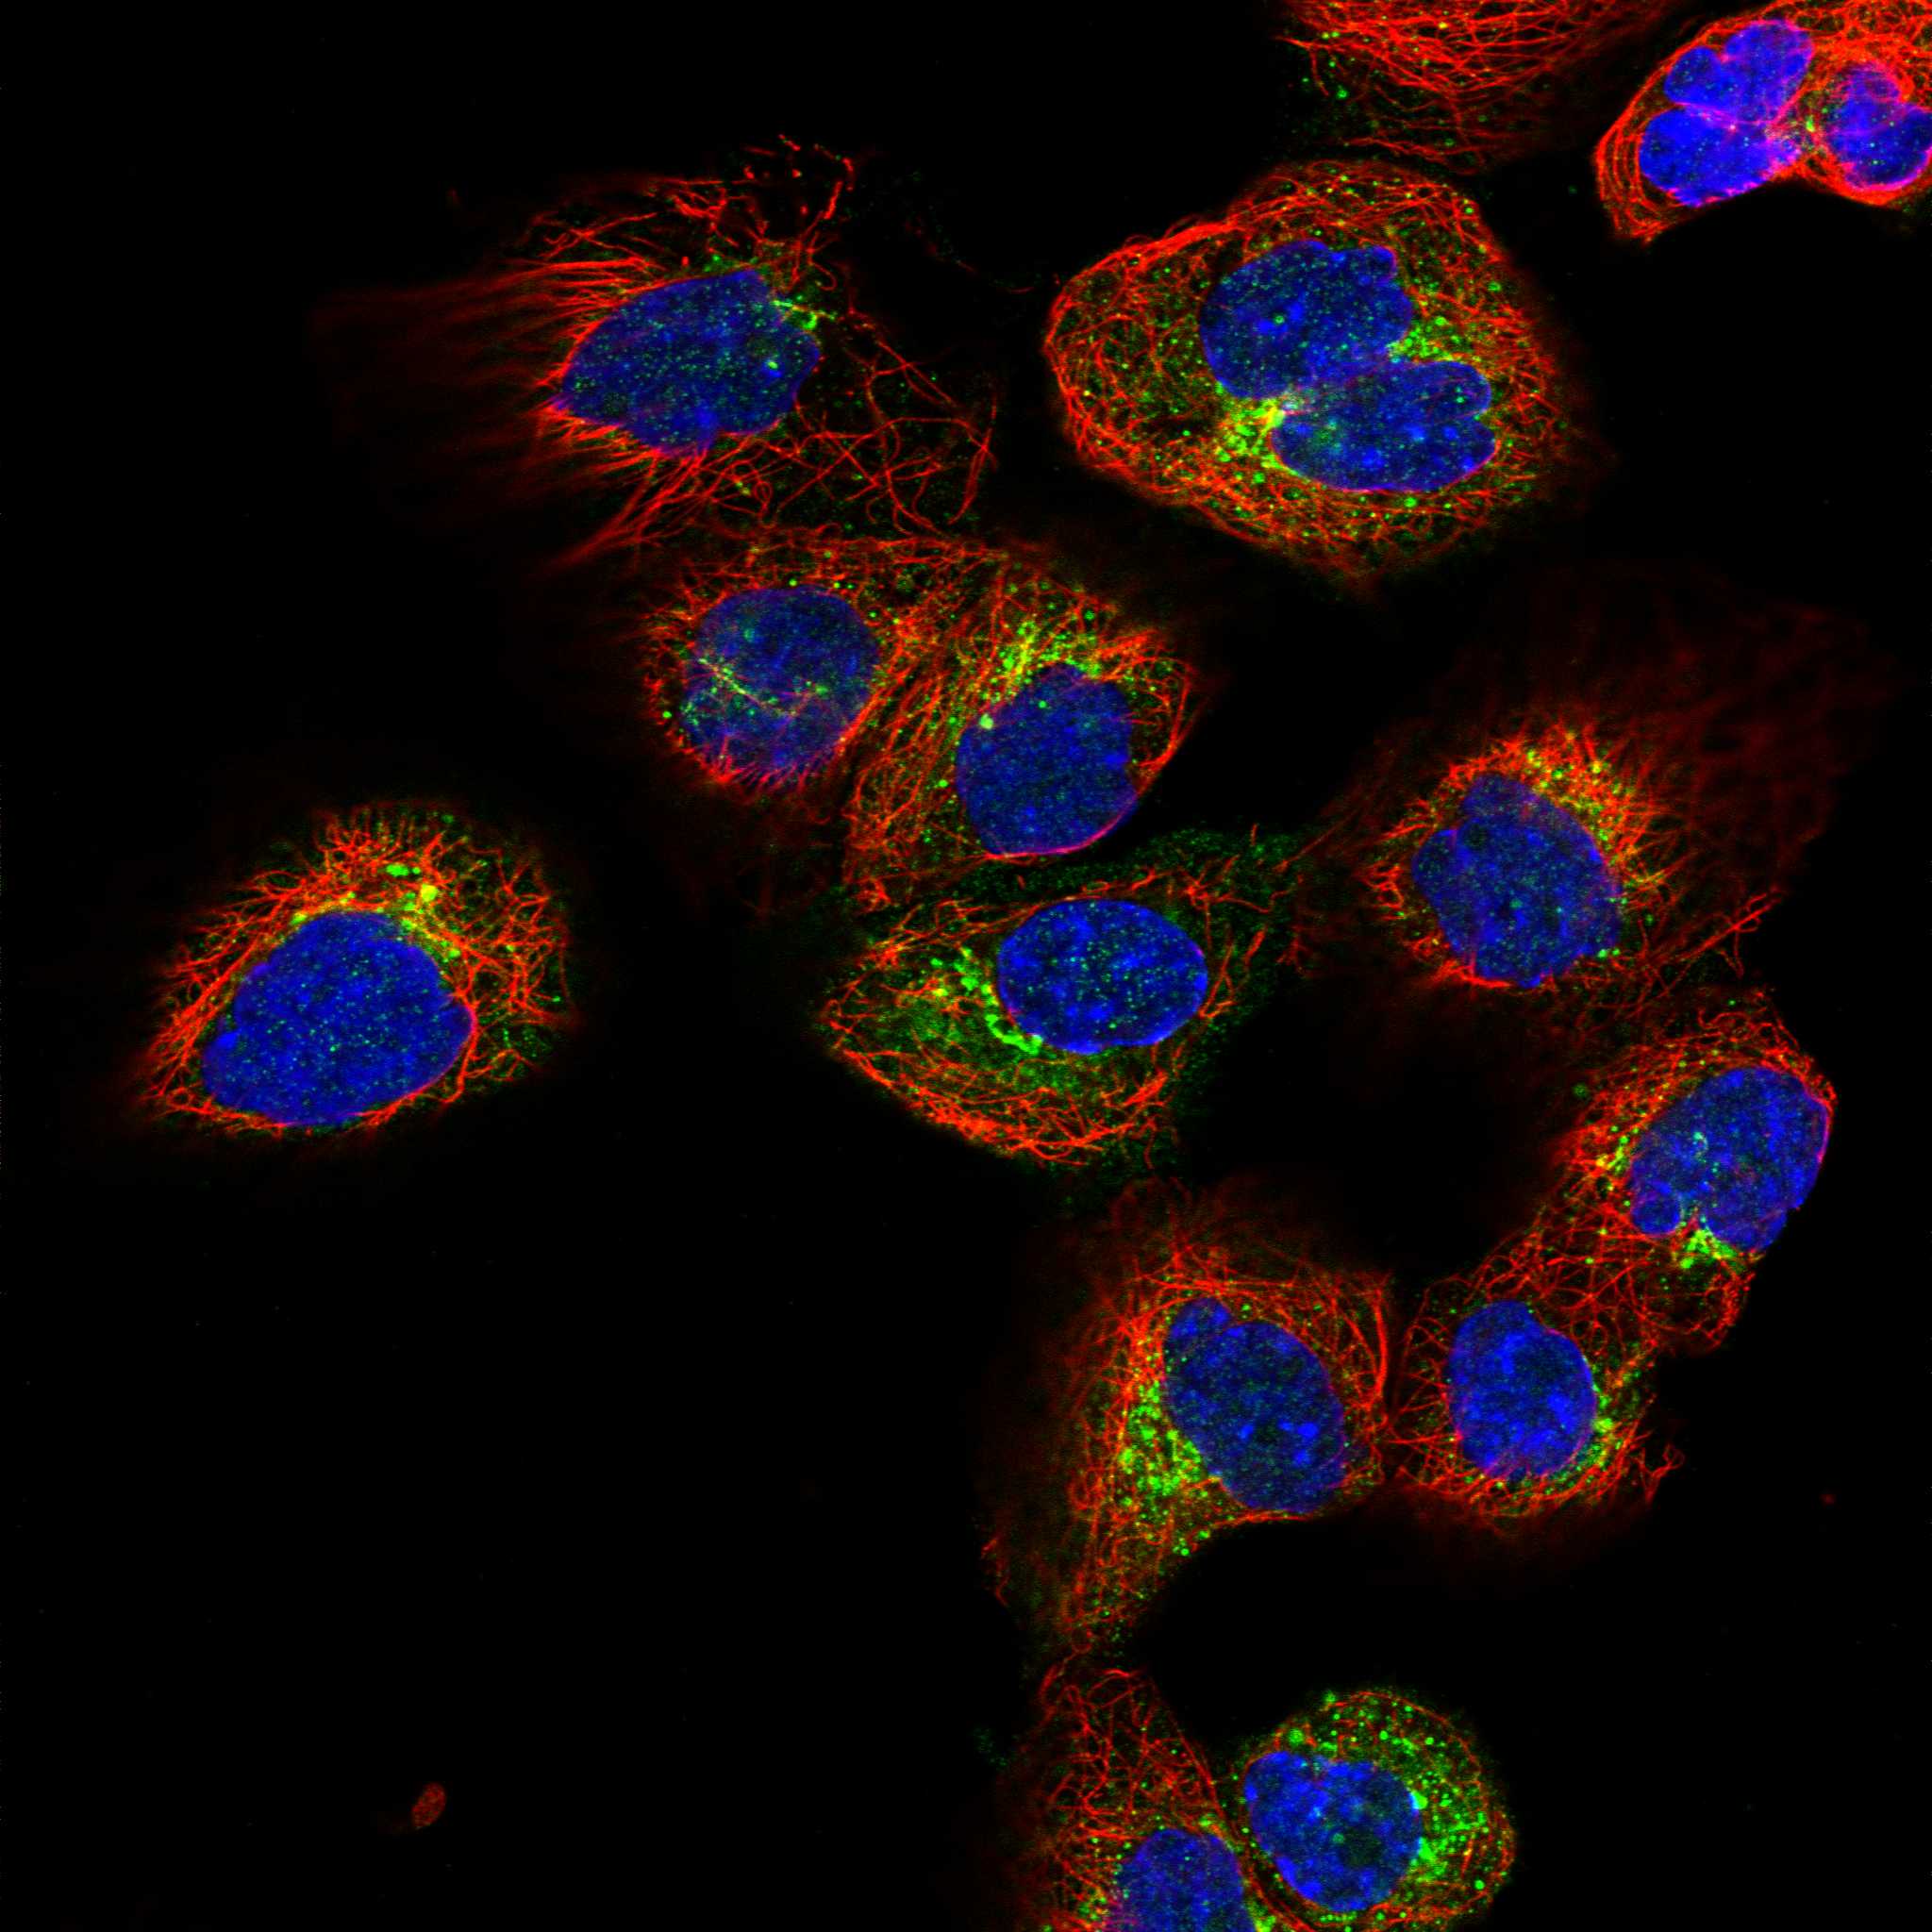
Comprehensive Human Protein Atlas IHC scoring per tissue (reliability: Approved — Medium consistency between antibody staining and RNA expression data.). Rows are taken directly from the HPA tissue chart — click any row's HPA link to view the source.
| Tissue | Cell type | Level | Evidence | Source |
|---|---|---|---|---|
| Adipose tissue | Adipocytes | High | Protein (IHC) | HPA → |
| Adrenal gland | Glandular cells | High | Protein (IHC) | HPA → |
| Appendix | Glandular cells | High | Protein (IHC) | HPA → |
| Bone marrow | Hematopoietic cells | High | Protein (IHC) | HPA → |
| Breast | Adipocytes | High | Protein (IHC) | HPA → |
| Tissue | Cell type | Level | Evidence | Source |
|---|---|---|---|---|
| None in HPA: APLP2 is detected in all 45 scored tissues. Use a no-primary (secondary-only) and an isotype control instead. | ||||
Troubleshoot APLP2 staining in paraffin sections by checking retrieval, tissue preparation, expected localisation and controls before interpreting chromogenic signal.
A01232-1 has paraffin-section IHC images from human tumors and an IF/ICC image from HeLa cells (catalog image captions). Both antibodies list Human, Mouse and Rat reactivity for IHC (catalog applications and reactivity).
A01232-1 has IHC images from paraffin sections of human colorectal adenocarcinoma, liver cancer, lung cancer and testicular germ cell tumors, plus an IF/ICC image from HeLa cells (catalog image captions). M01232 is listed for IHC in Human, Mouse and Rat, but has no supplied IHC or IF image (catalog applications, reactivity and image fields).
Which to pick: Choose A01232-1 for tissue IHC when an illustrated paraffin-section workflow is useful: its IHC captions report EDTA retrieval at pH 8.0, 2 μg/ml primary antibody and DAB detection; the fixative is unreported (A01232-1 IHC image captions). Choose A01232-1 for IF/ICC because it lists both applications and has a HeLa cell IF image; M01232 is a rabbit monoclonal listed for IHC, with no IF/ICC application or image supplied (catalog applications, clone and image fields). For cross-species IHC, both list Human, Mouse and Rat reactivity, while the supplied tissue images document Human samples only for A01232-1 (catalog reactivity and IHC image captions).