This website uses cookies to ensure you get the best experience on our website.


- Table of Contents
Plan ASS1 IHC around the cytoplasmic staining reported in liver, kidney and urinary bladder (HPA tissue IHC). For paraffin sections, start M02212-1 at 2–5 μg/ml and compare staining with positive and negative tissue controls (datasheet: M02212-1; standard IHC practice).

Expected localisation, validated protocols, controls and antibodies — the at-a-glance facts below, then the full design guide.
| Expected localisation | Cytoplasmic tissue staining (HPA tissue IHC) | |
| Staining pattern | Cytoplasmic staining in hepatocytes, Bowman's capsule and urothelium (HPA tissue IHC) | |
| Antigen retrieval | EDTA pH 8.0 HIER, heat-mediated (datasheet M02212-1) | |
| Positive control | Kidney+4 more · see all | |
| Negative control | Bone marrow+4 more · see all |
| Fixation | Matched tissue-IHC evidence does not establish the fixation claim. Validate the specimen-specific method before use. (selected-SKU IHC image M02212-1) | |
| Caveat | Staining and RNA have medium consistency (HPA tissue IHC) | |
| Regulation | Expression regulation unreported (UniProt) | |
| Isoform / epitope | No annotated isoforms or signal/propeptide processing (UniProt) |
The catalog antibody uses EDTA HIER (datasheet: M02212-1). The published IHC protocols below cover esophageal adenocarcinoma (PMC12650347), pancreatic ductal adenocarcinoma (PMC5302782), and ovarian carcinoma (PMC4858122).
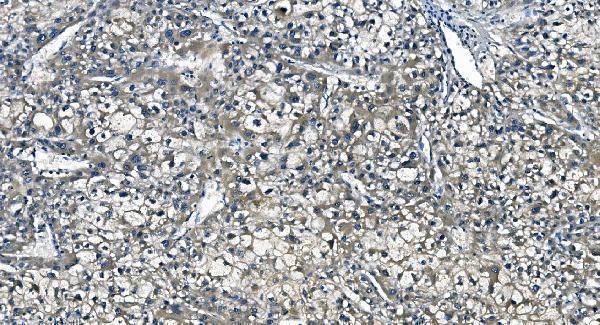
| Sample | Paraffin-embedded human prostate cancer tissue; fixative not specified (datasheet M02212-1) |
| Fixation | Image fixative and duration unreported (datasheet M02212-1); verify before use. |
| Sectioning | 4–5 µm sections on charged slides (standard) |
| Deparaffinisation | Xylene, graded ethanol series to water (standard) |
| Antigen retrieval | Heat retrieval: EDTA pH 8.0 (datasheet M02212-1); 20 min, 95–100 °C (standard) |
| Peroxidase block | 3% H2O2, 10 min, room temperature (standard) |
| Blocking | 10% goat serum (datasheet M02212-1) |
| Primary antibody | Mouse monoclonal (clone 5I5) anti-ASS1, 2μg/ml (datasheet M02212-1) |
| Primary incubation | Overnight at 4 °C (datasheet M02212-1) |
| Detection | Streptavidin-biotin complex (SABC), DAB chromogen (datasheet M02212-1) |
| Counterstain | Hematoxylin, blue, dehydrate and mount (standard) |
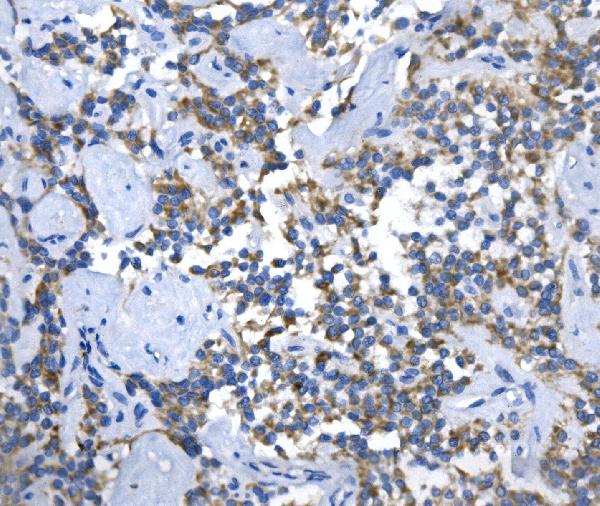
| Expected result | ASS1-positive staining in bowman's capsule of kidney (HPA tissue IHC: High). HPA tissue profile: Cytoplasmic expression in several tissues including kidney, liver and urinary bladder. No signal in the no-primary control. |
ASS1 is a cytosolic enzyme with no transmembrane segment (UniProt P00966: subcellular location and topology). In paraffin-section IHC, expect cytoplasmic staining in hepatocytes, kidney Bowman’s capsule cells, and urothelial cells, among other reported positives (HPA: tissue IHC). HPA rates the tissue profile Enhanced, while reporting medium consistency between antibody staining and RNA expression (HPA: tissue IHC reliability).
| Clear cytoplasmic staining in hepatocytes and cells of kidney Bowman’s capsule, with limited background. | This matches the expected compartment (UniProt P00966: cytosol) and two high-staining cell populations (HPA: High in hepatocytes and Bowman’s capsule). Judge the named cells, rather than treating every cell in either tissue as an expected positive. |
| Predominantly membrane-rimmed or nuclear staining replaces cytoplasmic staining in expected positive cells. | A dominant membrane pattern conflicts with the lack of a transmembrane segment (UniProt P00966: topology). Predominantly nuclear IHC also warrants checking controls: HPA supports cytosol as the main IF location but calls additional nucleoplasm localization uncertain (HPA: subcellular ICC-IF). |
| Strong staining appears in a population listed as undetected, such as bone-marrow hematopoietic cells. | That result conflicts with the reported IHC pattern (HPA: Not detected in bone-marrow hematopoietic cells). Check for antibody cross-reactivity or detection background before interpreting it as ASS1; an HPA reference pattern cannot establish that every specimen is negative. |
| Weak, diffuse color covers cells and spaces without clear cytoplasmic boundaries. | The pattern does not resolve the reported cytoplasmic signal (HPA: tissue IHC profile). Compare a no-primary control and inspect blocking, washes, and chromogen development (general chromogenic IHC practice); diffuse color alone cannot identify ASS1-positive cells. |
| No staining is visible in hepatocytes on a run intended to show ASS1. | Hepatocytes are a reported high-staining population (HPA: High in hepatocytes). Check a known-positive section processed in the same run, then inspect antibody, retrieval, and detection steps (general IHC practice). A blank slide alone cannot distinguish technical failure from specimen variation. |
| Cell population selected for scoring | Expected intensity depends on the named population: hepatocytes, Bowman’s capsule cells, and urothelial cells are High; colon glandular cells are Medium; duodenal glandular cells are Not detected (HPA: tissue IHC). Score those populations separately instead of assigning one expectation to an entire organ. |
| Compartment used to judge positivity | ASS1 is assigned to the cytosol and has no transmembrane segment (UniProt P00966: location and topology). Use resolved cytoplasmic staining as the main localization check; the additional nucleoplasm finding is uncertain in ICC-IF (HPA: subcellular ICC-IF). |
| Strength of the reference pattern | HPA labels the tissue IHC profile Enhanced but describes only medium consistency between antibody staining and RNA expression (HPA: tissue IHC reliability). Its reported High, Medium, Low, and Not detected categories guide comparison; they are not intensity thresholds for an individual slide. |
| Independent antibody evidence | Two listed rabbit polyclonal antibodies, HPA020896 and HPA020934, have Enhanced IHC validation (HPA: antibody validation). This supports the reference pattern but does not establish that a different catalog antibody will produce the same intensity or background in a given run. |
| Processing and isoform expectations | UniProt lists one chain spanning residues 1–412, no signal peptide or propeptide, and no annotated isoforms (UniProt P00966: processing and isoforms). These annotations provide no basis for predicting a separate secreted or membrane staining pattern. |
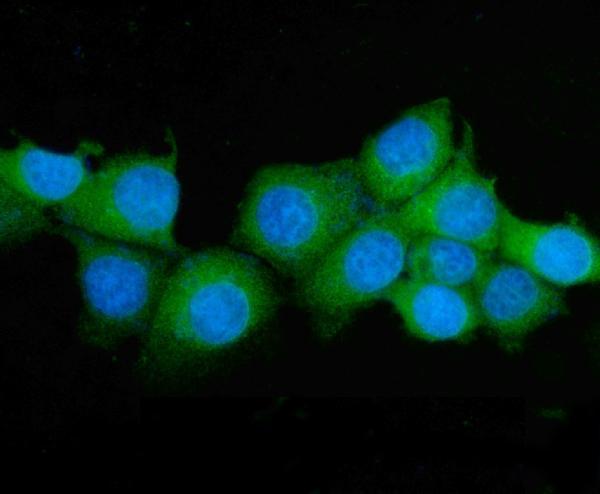
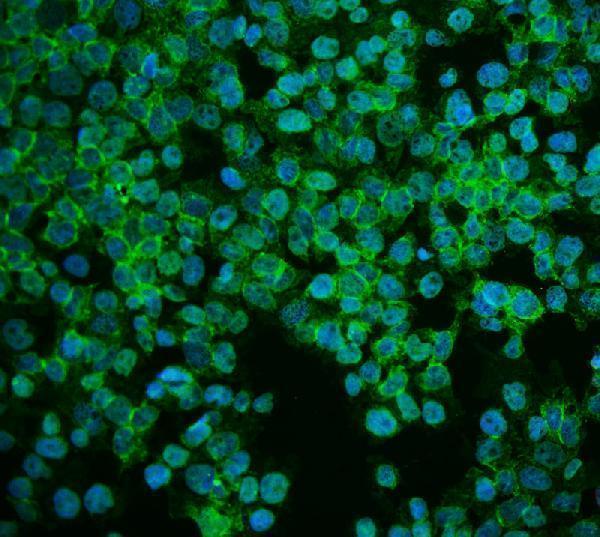
| IF/ICC: where should signal appear? | Mainly in the cytosol, with additional nucleoplasm localization marked uncertain (HPA: subcellular ICC-IF). This answers the localization question for IF/ICC; compare its images on its own guide page rather than treating the IHC tissue intensity categories as IF intensity predictions. |
| Situation | Likely cause | Next action |
|---|---|---|
| A known-positive liver section has little or no hepatocyte signal. | Hepatocytes are reported High, so the run needs a technical check (HPA: High in hepatocytes); the reference pattern alone does not identify which step failed. | Compare a known-positive section run alongside it; check the catalog antibody’s IHC-P instructions, retrieval, reagent integrity, and detection controls (general IHC practice). |
| All cell types show a similar diffuse chromogenic haze. | Uniform haze obscures the cell-resolved cytoplasmic pattern expected for ASS1 (UniProt P00966: cytosol; HPA: tissue IHC profile). | Inspect a no-primary control, washing and blocking steps, and chromogen development; address detection background before scoring tissue cells (general chromogenic IHC practice). |
| Membrane rims dominate while hepatocyte cytoplasm is faint. | A dominant membrane pattern is discordant with cytosolic ASS1 and its lack of a transmembrane segment (UniProt P00966: location and topology). | Compare positive and no-primary controls, confirm the catalog antibody used for IHC-P, and reassess whether the cytoplasm is independently resolved (general IHC practice). |
| A reported undetected population stains strongly. | Strong staining in bone-marrow hematopoietic cells, for example, differs from the HPA reference (HPA: Not detected in bone-marrow hematopoietic cells). Cross-reactivity or detection background is possible. | Review a no-primary control and a positive tissue in the same run; verify the stained cell identity before assigning the signal to ASS1 (general IHC practice). |
| Signal appears nuclear in IF/ICC or in a chromogenic section. | HPA reports mainly cytosolic ICC-IF staining and marks additional nucleoplasm localization uncertain (HPA: subcellular ICC-IF); UniProt assigns ASS1 to the cytosol (UniProt P00966: location). | Check whether cytosolic signal is also present and compare controls. Treat isolated nuclear staining cautiously; the supplied sources do not establish a nuclear IHC-positive pattern. |
| Liver and kidney sections show different apparent strengths. | HPA reports high staining in hepatocytes and kidney Bowman’s capsule cells, but that does not predict equal slide intensity or staining of every cell in either organ (HPA: tissue IHC). | Score the specified cell populations and compare sections processed together; assess counterstain and background before interpreting an apparent intensity difference (general IHC practice). |
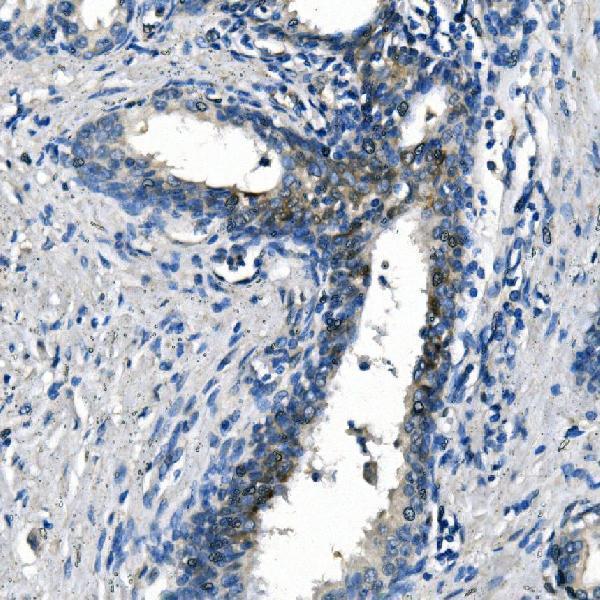
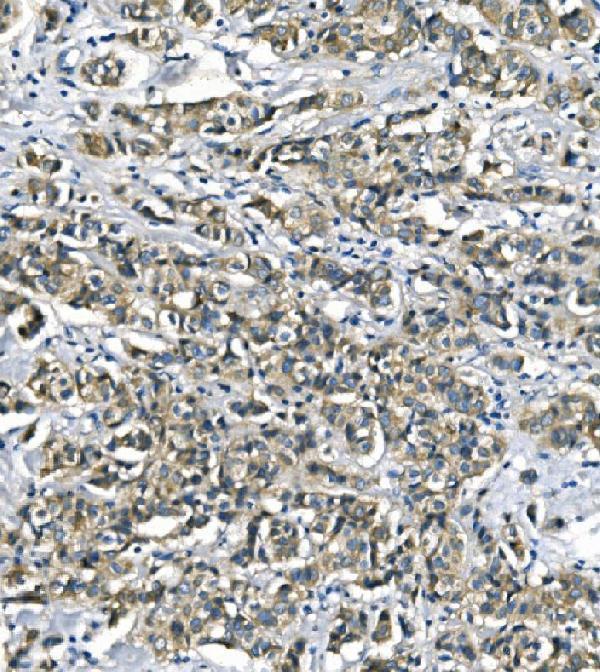
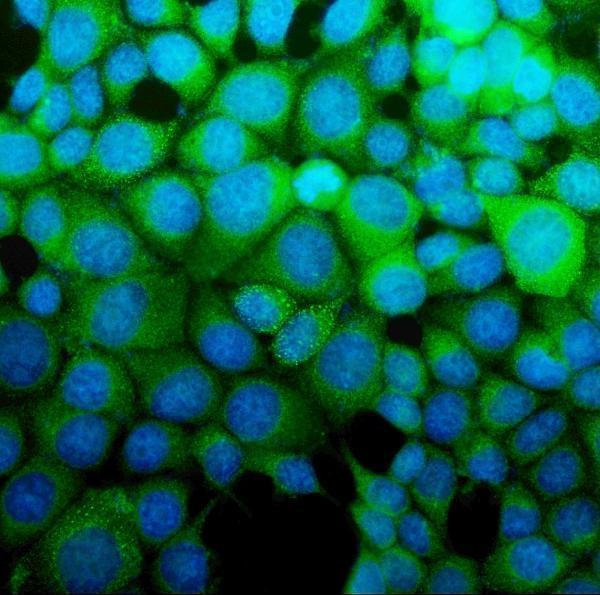
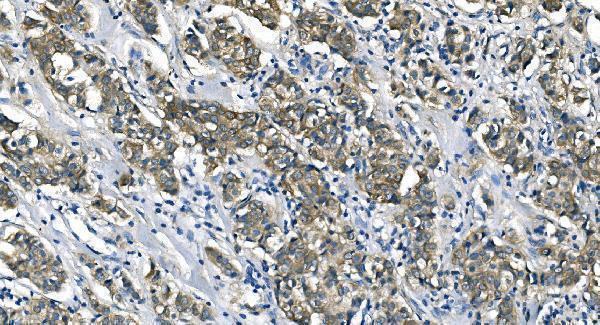
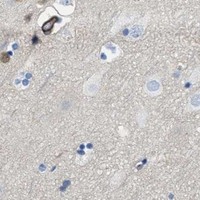


Comprehensive Human Protein Atlas IHC scoring per tissue (reliability: Enhanced — Medium consistency between antibody staining and RNA expression data.). Rows are taken directly from the HPA tissue chart — click any row's HPA link to view the source.
| Tissue | Cell type | Level | Evidence | Source |
|---|---|---|---|---|
| Kidney | Bowman's capsule | High | Protein (IHC) | HPA → |
| Liver | Hepatocytes | High | Protein (IHC) | HPA → |
| Lung | Alveolar cells type II | High | Protein (IHC) | HPA → |
| Skin | Cells in basal layer | High | Protein (IHC) | HPA → |
| Urinary bladder | Urothelial cells | High | Protein (IHC) | HPA → |
| Tissue | Cell type | Level | Evidence | Source |
|---|---|---|---|---|
| Bone marrow | Hematopoietic cells | Not detected | Protein (IHC) | HPA → |
| Cerebellum | Cells in granular layer | Not detected | Protein (IHC) | HPA → |
| Duodenum | Glandular cells | Not detected | Protein (IHC) | HPA → |
| Endometrium | Cells in endometrial stroma | Not detected | Protein (IHC) | HPA → |
| Epididymis | Glandular cells | Not detected | Protein (IHC) | HPA → |
Troubleshoot ASS1 staining by checking retrieval, cytosolic localisation, tissue context and assay controls before interpreting chromogenic signal.
Catalog antibodies have IHC images from human paraffin sections and IF/ICC images from HEPG2 or MCF-7 cells (catalog image captions). Listed reactivity covers human, mouse, rat and, for two clones, monkey (catalog applications/reactivity).
M02212-1 has IHC images from human prostate, breast and colon cancers and rat liver; M02212-2 has images from human breast, liver, prostate and colon cancers (catalog IHC captions). A02212-1 has an IHC image from human pancreatic cancer, and all three have IF/ICC images from HEPG2 or MCF-7 cells (catalog image captions).
Which to pick: For paraffin-section IHC, choose the SKU with evidence closest to your tissue: M02212-1 for prostate, breast, colon or rat liver; M02212-2 for breast, liver, prostate or colon; or A02212-1 for pancreatic cancer (each SKU’s IHC captions). For IF/ICC, A02212-1 has a HEPG2 image at 2 μg/mL, while M02212-1 and M02212-2 each have a MCF-7 image at 5 μg/mL (each SKU’s IF caption). For cross-species planning, all three list human, mouse and rat reactivity, while the two mouse monoclonals also list monkey reactivity (catalog reactivity and clone fields); the fixative is unreported in their paraffin-section IHC captions (catalog IHC captions).