This website uses cookies to ensure you get the best experience on our website.


- Table of Contents
Plan chromogenic ATP1B1 IHC in paraffin sections using the membranous tissue pattern (HPA tissue IHC). This guide highlights high staining in collecting ducts and glandular cells (HPA tissue IHC) and the catalog antibody’s 2–5 μg/ml IHC range (datasheet A03469-1).

Expected localisation, validated protocols, controls and antibodies — the at-a-glance facts below, then the full design guide.
| Expected localisation | Membranous staining in many tissues (HPA tissue IHC) | |
| Staining pattern | Membranous pattern; high in glandular cells and collecting ducts (HPA tissue IHC) | |
| Antigen retrieval | EDTA pH 8.0 HIER, heat-mediated (datasheet A03469-1) | |
| Positive control | Duodenum+4 more · see all | |
| Negative control | Adipose tissue+4 more · see all |
| Fixation | Keep fixation consistent across paraffin sections. (standard IHC practice; not target-specific) | |
| Caveat | Antibody staining and RNA show medium consistency (HPA tissue IHC) | |
| Regulation | Kidney-enhanced RNA expression (HPA tissue RNA) | |
| Isoform / epitope | 2 isoforms; epitope coverage is unknown; topology spans both sides (UniProt) |
The catalog antibody protocol is accompanied by published ATP1B1 staining methods for rat CA1 sections, lung cancer tissue microarrays, and corneas (PMC5970211; PMC7174014; PMC5379100).
| Sample | Paraffin-embedded human breast cancer tissue; fixative not specified (datasheet A03469-1) |
| Fixation | Image fixative and duration unreported (datasheet A03469-1); verify before use. |
| Sectioning | 4–5 µm sections on charged slides (standard) |
| Deparaffinisation | Xylene, graded ethanol series to water (standard) |
| Antigen retrieval | Heat retrieval: EDTA pH 8.0 (datasheet A03469-1); 20 min, 95–100 °C (standard) |
| Peroxidase block | 3% H2O2, 10 min, room temperature (standard) |
| Blocking | 10% goat serum (datasheet A03469-1) |
| Primary antibody | Rabbit anti-ATP1B1, 2-5 μg/ml (datasheet A03469-1) |
| Primary incubation | Overnight at 4 °C (datasheet A03469-1) |
| Detection | Streptavidin-biotin complex (SABC), DAB chromogen (datasheet A03469-1) |
| Counterstain | Hematoxylin, blue, dehydrate and mount (standard) |
| Expected result | ATP1B1-positive staining in glandular cells of duodenum (HPA tissue IHC: High). HPA tissue profile: Membranous expression in many tissues. No signal in the no-primary control. |
ATP1B1 is a membrane protein with one transmembrane segment and a large extracellular region (UniProt P05026 topology). In paraffin-section IHC, expect membranous staining in many tissues, including high staining in kidney collecting ducts and glandular cells of the duodenum, gallbladder, salivary gland, and small intestine (HPA: tissue IHC). HPA rates the tissue IHC pattern Enhanced, with medium consistency between staining and RNA data (HPA: tissue IHC reliability).
| Membrane outlines in kidney collecting ducts and glandular cells, with strong signal in the listed high-staining tissues (HPA: tissue IHC). | This fits ATP1B1's cell-membrane location and HPA's membranous IHC profile (UniProt P05026 subcellular location; HPA: tissue IHC). Judge the membrane pattern and the stained cell population together; tissue-wide color alone is less informative. |
| Predominantly nuclear or uniform cytoplasmic color, without a convincing membrane pattern. | That distribution conflicts with the principal membrane localization (UniProt P05026 subcellular location; HPA: tissue IHC). Treat it as possible nonspecific staining or a detection artifact, and review the controls before assigning it to ATP1B1. |
| Strong staining in a cell population HPA reports as not detected, such as adipocytes in adipose tissue (HPA: not detected in adipocytes). | The mismatch raises concern for cross-reactivity or endogenous detection activity. It does not prove either cause: HPA reports tissue and cell-specific observations, and its IHC profile has medium consistency with RNA data (HPA: tissue IHC reliability). |
| Broad, low-contrast color across cells and surrounding section areas, obscuring membrane outlines. | This is background rather than a readily interpretable membrane pattern (HPA: membranous tissue IHC profile). Compare a no-primary control and assess blocking, washes, antibody concentration, and chromogen development as general IHC checks. |
| No detectable signal in kidney collecting ducts or another listed high-staining population (HPA: tissue IHC). | The result falls short of the supplied positive reference pattern. Check a same-run positive section and reagent performance before calling the sample negative; HPA's Enhanced rating supports the reported pattern but does not guarantee every section will stain (HPA: tissue IHC reliability). |
| Topology and epitope access (UniProt P05026 topology) | ATP1B1 spans the membrane at residues 35–62, with residues 1–34 cytoplasmic and 63–303 extracellular (UniProt P05026 topology). An antibody's mapped epitope would guide interpretation of access after tissue processing; no epitope map or ATP1B1-specific retrieval effect is supplied here. |
| Tissue and cell population (HPA: tissue IHC) | HPA reports high staining in kidney collecting ducts and selected glandular cells, medium staining in appendix glandular cells and cerebral-cortex neuropil, and no detection in several specified populations (HPA: tissue IHC). Compare the same cell type when judging intensity. |
| Validation and agreement (HPA: tissue IHC reliability; HPA: HPA012911 IHC Enhanced) | The supplied antibody has an Enhanced IHC status, while the tissue profile has medium consistency between antibody staining and RNA expression (HPA: HPA012911 IHC Enhanced; HPA: tissue IHC reliability). Use the reported distribution as a reference, with section-level controls. |
| Protein variants and glycosylation (UniProt P05026) | UniProt lists two isoforms and three glycosylation sites at residues 158, 193, and 265 (UniProt P05026 isoforms and glycosylation). Their effect on this antibody's paraffin-section staining cannot be determined without an antibody epitope or assay-specific evidence. |
| Situation | Likely cause | Next action |
|---|---|---|
| No signal in a kidney collecting-duct positive reference (HPA: High in collecting ducts). | A weak IHC run or missed target remains possible; a blank reference section alone cannot distinguish them. | Review section quality, primary-antibody dilution, antigen retrieval, detection reagents, and chromogen development as general IHC checks. Run a listed high-staining section alongside the test tissue (HPA: tissue IHC). |
| Color is mainly nuclear or diffuse within cells. | The location disagrees with the reported membrane pattern (UniProt P05026 subcellular location; HPA: tissue IHC). | Check a no-primary control, inspect membrane outlines at appropriate magnification, and reassess blocking and detection conditions. Do not score nuclear color alone as ATP1B1-positive. |
| Unexpected strong color appears in an HPA not-detected cell population (HPA: tissue IHC). | Cross-reactivity or endogenous detection activity is possible; the slide does not identify which. | Compare the no-primary control and a listed positive cell population on the same run. Score the named cell population rather than treating an entire organ as uniformly positive or negative (HPA: tissue IHC). |
| Diffuse background hides cell borders. | Excess primary antibody, incomplete blocking or washing, or detection background are general IHC possibilities. | Use the no-primary control to locate detection background; then adjust blocking, washes, primary dilution, or development time one variable at a time. Reassess whether a membrane pattern emerges (HPA: tissue IHC profile). |
| Staining intensity varies across tissues or cell populations. | HPA reports high, medium, low, and not-detected levels in different named populations (HPA: tissue IHC). | Record compartment and intensity for each cell population. Compare with the corresponding HPA entry; avoid using kidney collecting-duct intensity as a required threshold for all tissues (HPA: High in collecting ducts). |
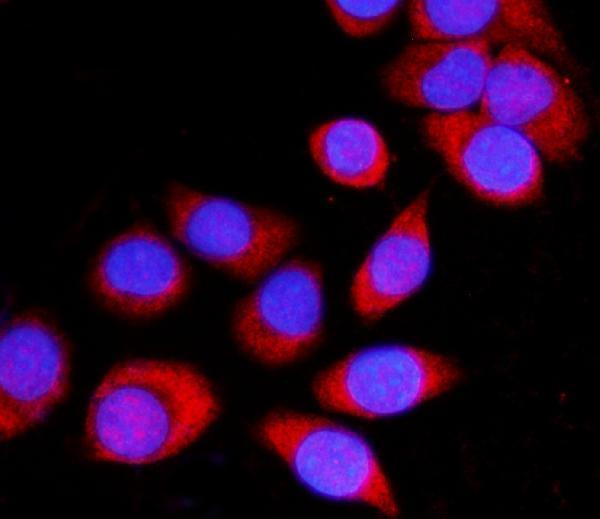
| Does the IHC pattern establish what IF/ICC should show? | HPA summarizes the IF/ICC location as membrane but supplies no ICC/IF image-bearing cell lines or detailed main location (HPA: subcellular ICC-IF). | Use membrane localization as the limited expectation (UniProt P05026 subcellular location; HPA: subcellular ICC-IF). Interpret IF/ICC with its own controls and guide; the supplied IHC evidence does not establish an IF/ICC protocol. |
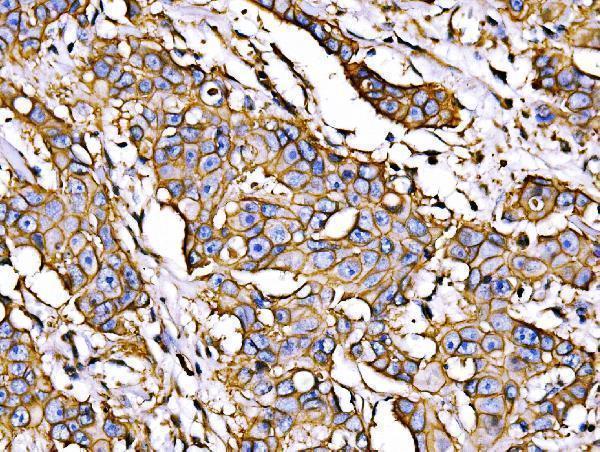
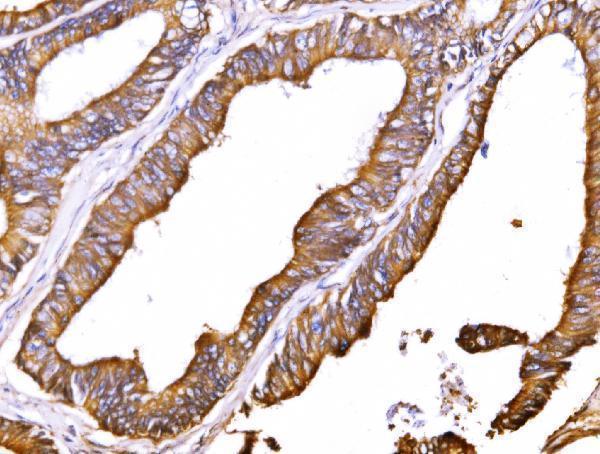


Comprehensive Human Protein Atlas IHC scoring per tissue (reliability: Enhanced — Medium consistency between antibody staining and RNA expression data.). Rows are taken directly from the HPA tissue chart — click any row's HPA link to view the source.
| Tissue | Cell type | Level | Evidence | Source |
|---|---|---|---|---|
| Duodenum | Glandular cells | High | Protein (IHC) | HPA → |
| Gallbladder | Glandular cells | High | Protein (IHC) | HPA → |
| Kidney | Collecting ducts | High | Protein (IHC) | HPA → |
| Salivary gland | Glandular cells | High | Protein (IHC) | HPA → |
| Small intestine | Glandular cells | High | Protein (IHC) | HPA → |
| Tissue | Cell type | Level | Evidence | Source |
|---|---|---|---|---|
| Adipose tissue | Adipocytes | Not detected | Protein (IHC) | HPA → |
| Caudate | Glial cells | Not detected | Protein (IHC) | HPA → |
| Cerebellum | Cells in granular layer | Not detected | Protein (IHC) | HPA → |
| Cervix | Glandular cells | Not detected | Protein (IHC) | HPA → |
| Esophagus | Squamous epithelial cells | Not detected | Protein (IHC) | HPA → |
Troubleshoot ATP1B1 staining by checking retrieval, membrane localisation and cell type before comparing signal intensity across paraffin sections.
The IHC-validated antibody has paraffin-section images from human breast, colon, gall bladder and liver cancers, plus IF images from human cells and mouse and rat kidney (A03469-1 image captions).
The rendered card is A03469-1, with its own IHC image from a human breast cancer paraffin section (A03469-1 IHC caption). Its other captions show human colon, gall bladder and liver cancer IHC, human cell ICC/IF, and mouse and rat kidney IF (A03469-1 image captions).
Which to pick: Choose A03469-1 for tissue IHC when a documented paraffin-section example is useful: its IHC caption specifies EDTA retrieval at pH 8.0 and 2 μg/ml primary antibody; the fixative is unreported (A03469-1 IHC caption). Choose A03469-1 for IF/ICC because its application list includes both and its captions show human cell ICC/IF and mouse and rat kidney IF (A03469-1 catalog; A03469-1 IF captions). For cross-species IHC, both SKUs list human, mouse and rat reactivity, but A03469-1 has an illustrated human paraffin IHC example; M03469 is a rabbit monoclonal, clone 23A21, listed for IHC without an IHC image caption (catalog).