ATP5F1A / ATP synthase F(1) complex subunit alpha, mitochondrial · IHC design guide

Design Immunohistochemistry for ATP5F1A

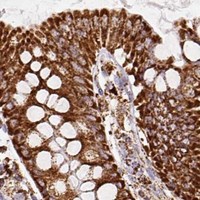
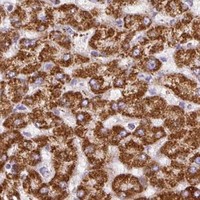
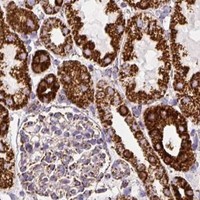
ATP5F1A shows granular cytoplasmic staining across tissues in IHC (HPA tissue IHC). For paraffin sections, start with 2–5 μg/mL of the catalog antibody (datasheet A32267-2) and assess staining by cell type and intensity (standard IHC practice).

Evidence assembled Oct 2026 · For research use; verify linked source records and product datasheet before use
Immunohistochemistry protocol sheet for ATP5F1A (IHC for ATP5F1A): expected localisation Granular cytoplasm (HPA tissue IHC); mitochondrial inner membrane (UniProt), antibody A32267-2, validated IHC image, and IHC protocol steps
Printable ATP5F1A IHC protocol sheet — expected localisation Granular cytoplasm (HPA tissue IHC); mitochondrial inner membrane (UniProt), antibody A32267-2, controls and protocol steps. Open the full ATP5F1A IHC guide →

ATP5F1A Immunohistochemistry Experimental Design Guide

Expected localisation, validated protocols, controls and antibodies — the at-a-glance facts below, then the full design guide.

Must know before staining
Expected localisation Granular cytoplasm (HPA tissue IHC); mitochondrial inner membrane (UniProt)
Staining pattern Granular cytoplasmic staining across all tissues (HPA tissue IHC)
Antigen retrieval EDTA pH 8.0 HIER, heat-mediated (datasheet A32267-2)
Positive control ⓘ Adrenal gland+4 more · see all
Negative control ⓘ None in HPA (detected in all 45 tissues); use no-primary + isotype controls
Important caveats
Reasons your staining may differ from the expected pattern.
Fixation Keep fixation consistent across sections. (standard IHC practice; not target-specific)
Caveat Widespread staining limits tissue negative controls (HPA tissue IHC)
Regulation Tongue-enhanced RNA expression (HPA tissue RNA)
Isoform / epitope 3 isoforms; mature chain starts at residue 44; epitope impact unknown (UniProt)
Section 1

Recommended ATP5F1A IHC & IF Protocols

The catalog antibody protocol uses EDTA pH 8.0 retrieval (datasheet A32267-2). The published IHC protocols below report methods for ATP5F1A staining (PMC11244755; PMC9980697; PMC6261400).

Recommended immunohistochemistry (IHC-P) protocol parameters
SampleParaffin-embedded human endometrial adenocarcinoma tissue; fixative not specified (datasheet A32267-2)
FixationImage fixative and duration unreported (datasheet A32267-2); verify before use.
Sectioning4–5 µm sections on charged slides (standard)
DeparaffinisationXylene, graded ethanol series to water (standard)
Antigen retrievalHeat retrieval: EDTA pH 8.0 (datasheet A32267-2); 20 min, 95–100 °C (standard)
Peroxidase block3% H2O2, 10 min, room temperature (standard)
Blocking10% goat serum (datasheet A32267-2)
Primary antibodyRabbit anti-ATP5F1A, 2-5 μg/ml (datasheet A32267-2)
Primary incubationOvernight at 4 °C (datasheet A32267-2)
DetectionHRP-conjugated secondary, DAB chromogen (datasheet A32267-2)
CounterstainHematoxylin, blue, dehydrate and mount (standard)
Expected resultATP5F1A-positive staining in glandular cells of adrenal gland (HPA tissue IHC: High). HPA tissue profile: Cytoplasmic expression with a granular pattern in all tissues. No signal in the no-primary control.
💡Decision noteStart with heat-mediated EDTA pH 8.0 retrieval (datasheet A32267-2); the prostate tissue protocol also specifies EDTA pH 8 (PMC6261400 methods).
Section 2

What Is the Expected ATP5F1A Staining Pattern?

ATP5F1A is a mitochondrial ATP synthase subunit associated with the inner membrane; its F1 alpha subunit has no transmembrane segment (UniProt P25705). In paraffin sections, expect granular cytoplasmic staining across tissues, with prominent signal in the listed high-staining cell populations (HPA tissue IHC). The tissue profile has Enhanced reliability, reflecting consistency between antibody staining and RNA expression (HPA tissue IHC).

What am I looking at on my slide?
Granular cytoplasmic staining is visible in glandular cells of adrenal gland, appendix, or breast.This matches the reported tissue pattern and High staining in those cell populations (HPA tissue IHC). Judge the granules against cell outlines and surrounding tissue; a brown nucleus or an even wash across the section does not reproduce the reported granular cytoplasmic pattern (HPA tissue IHC).
Signal appears chiefly nuclear, or as a continuous outline around many cells.Neither appearance matches the reported granular cytoplasmic IHC pattern (HPA tissue IHC). Reassess morphology and detection background before calling it ATP5F1A. UniProt also reports ATP5F1A at the T-cell surface with HRG, but that observation does not establish a general membranous pattern in paraffin tissue (UniProt P25705).
Strong staining appears in a cell population whose identity or distribution differs from the expected section anatomy.Confirm the cells by morphology before assigning specificity: ATP5F1A staining is widespread across tissues (HPA tissue IHC). A mismatch may reflect misidentified cells, antibody cross-reactivity, pigment, or endogenous chromogen-producing activity (standard IHC practice); tissue-wide expression alone cannot prove which explanation applies.
A faint, uniform haze covers cells and extracellular areas, obscuring individual granules.This does not resemble the granular cytoplasmic profile (HPA tissue IHC). It can arise from nonspecific antibody binding or detection background (standard IHC practice). Interpret intensity only after checking whether the haze also appears in areas where cell-associated staining cannot be resolved.
No signal is visible in a section chosen from a reported High-staining population.High staining is reported, for example, in bronchial respiratory epithelial cells and cerebral cortical neuronal cells (HPA tissue IHC). Check that the expected cells are present and that the detection run worked before inferring biological absence. A single failed section cannot distinguish sample variation from an assay problem.
💡Expected ATP5F1A appearanceCall a positive result when granular cytoplasmic signal is discernible in the expected cells, with prominent staining in a reported High population (HPA tissue IHC); diffuse haze or dominant nuclear staining is inconsistent with that profile (HPA tissue IHC).
How each factor affects the staining
Compartment and topologyThe mitochondrial F1 alpha subunit is associated with the inner membrane but has no transmembrane segment (UniProt P25705). Its reported tissue IHC appearance is granular cytoplasm (HPA tissue IHC); do not score an apparent plasma-membrane outline as the routine positive pattern.
Choice of tissue and cellsThe tissue profile describes granular cytoplasmic expression in all tissues, while named cell populations have High staining (HPA tissue IHC). Select a reported High population as a positive reference and verify its identity in the section; the supplied profile gives no negative tissue reference.
Antibody evidenceTwo listed rabbit polyclonal antibodies have Enhanced IHC validation, while the listed mouse monoclonal has Supported IHC validation (HPA antibodies). Those labels support the reported pattern at different evidence levels; they do not certify every signal in a new specimen as specific.
Isoforms and processingUniProt lists three isoforms and a processed chain spanning residues 44–553 (UniProt P25705). The supplied sources give no antibody epitope or isoform-specific IHC pattern, so staining differences cannot be assigned to a particular isoform or processing event from these data.
Why is my staining missing, weak or wrong?
SituationLikely causeNext action
Granules are weak or absent in a reported High-staining cell population.Target-specific fixation effects are not established by the supplied assay evidence. Verify with a matched IHC source before attributing a result to fixation.Verify cell identity and compare with a reported High reference in the same run (HPA tissue IHC). Review routine retrieval, antibody, and detection steps as general IHC checks; no ATP5F1A-specific retrieval condition is supplied.
Brown signal is widespread and featureless.Nonspecific binding or detection background can obscure the reported granular cytoplasmic pattern (HPA tissue IHC; standard IHC practice).Inspect a primary-omission control and the distribution outside cells; review blocking, washes, and detection reagents as general IHC checks. Reassess only after individual cell-associated granules can be distinguished.
Brown deposits resemble granules but occur over blood-rich or pigmented areas.Endogenous chromogen-producing activity or pigment can mimic positive chromogenic IHC (standard IHC practice); the HPA tissue profile alone cannot identify the deposits.Compare the primary-omission control and unstained tissue morphology. Apply routine endogenous-activity controls appropriate to the detection chemistry, then score signal only within identifiable cells.
The dominant signal is nuclear or outlines most cell surfaces.The distribution conflicts with the usual granular cytoplasmic tissue pattern (HPA tissue IHC). A reported T-cell surface interaction is a specific UniProt observation, not a general IHC scoring rule (UniProt P25705).Check counterstain, section morphology, and control staining; confirm any unusual compartmental pattern independently before interpreting it as ATP5F1A localisation.
A reported High population stains unevenly between sections.The listed High level identifies a cell population, not a guaranteed intensity in every specimen or run (HPA tissue IHC). Section composition and routine IHC variation may affect comparison.Compare like cell populations and review controls from each run. Record the distribution and intensity separately; avoid calling biological loss solely from differing whole-section darkness.
Q: What should an IF/ICC comparison show?ATP5F1A is mainly mitochondrial in ICC-IF; an additional end-piece location is reported (HPA subcellular ICC-IF). Those observations come from ICC-IF, while this guide's primary readout is chromogenic tissue IHC.A: Compare IF signal with mitochondrial localisation (HPA subcellular ICC-IF), and assess paraffin sections against granular cytoplasmic tissue staining (HPA tissue IHC). Use the separate IF/ICC guide for its method details.

Sample controls for ATP5F1A IHC & IF

🧪Run bone marrow first; hematopoietic cells should stain (HPA: High in bone marrow hematopoietic cells). HPA lists no negative tissue and detects ATP5F1A in all 45 scored tissues, so use no-primary and isotype controls for the negative comparison; no reliably negative cell population is identified within the positive slide (HPA: no negative rows).
Positive control tissue: Adrenal gland (Glandular cells, HPA High)
Negative control tissue: None in HPA: ATP5F1A is detected in all 45 scored tissues. Use a no-primary (secondary-only) and an isotype control instead.
ICC-IF cell lines (HPA subcellular resource): HPA ICC-IF images show ATP5F1A in U-251MG, U2OS, Sperm, NIH 3T3, with annotated localisation: Mitochondria (supported) (HPA subcellular).
Technical controls: Include a secondary-only slide and a concentration-matched rabbit IgG isotype control, alongside ATP5F1A knockout material processed in parallel if available (caption: rabbit primary antibody; standard IHC specificity controls). Quench endogenous peroxidase and inspect bone marrow hematopoietic cells for residual DAB background before scoring (HPA: bone marrow hematopoietic cells; standard chromogenic IHC practice).
⚠️Feasibility: No target-specific fixation window or fixation effect is reported, and the selected A32267-2 tissue-IHC caption does not state a fixative (caption: fixative unreported). Heat retrieval in EDTA at pH 8.0 was used for the reported paraffin-section stain, but its necessity for bone marrow is unreported (caption: heat-mediated EDTA retrieval in endometrial adenocarcinoma). Whether frozen sections or IF are easier is unreported; endogenous peroxidase in hematopoietic material can complicate DAB interpretation (HPA: bone marrow hematopoietic cells; standard IHC practice).

HPA tissue IHC evidence for ATP5F1A

Comprehensive Human Protein Atlas IHC scoring per tissue (reliability: Enhanced — High consistency between antibody staining and RNA expression data.). Rows are taken directly from the HPA tissue chart — click any row's HPA link to view the source.

Positive expression · recommended positive controls

TissueCell typeLevelEvidenceSource
Adrenal gland Glandular cells High Protein (IHC) HPA →
Appendix Glandular cells High Protein (IHC) HPA →
Bone marrow Hematopoietic cells High Protein (IHC) HPA →
Breast Glandular cells High Protein (IHC) HPA →
Bronchus Respiratory epithelial cells High Protein (IHC) HPA →

Undetected expression · recommended negative controls

TissueCell typeLevelEvidenceSource
None in HPA: ATP5F1A is detected in all 45 scored tissues. Use a no-primary (secondary-only) and an isotype control instead.
Section 3

Advanced ATP5F1A IHC Tips

Troubleshoot ATP5F1A staining in paraffin sections by checking retrieval, mitochondrial localisation and control tissues before interpreting staining intensity.

How should I retrieve ATP5F1A in paraffin sections when staining is weak?
Start with heat-mediated retrieval in EDTA at pH 8.0 for the catalog antibody (datasheet A32267-2). Its paraffin-section example used that retrieval before overnight incubation at 4°C with 2 μg/ml primary antibody (datasheet A32267-2). If staining remains weak, compare a cautiously extended heating step on adjacent sections while keeping the primary concentration and detection conditions fixed (standard IHC practice). Check preserved tissue morphology and the expected granular cytoplasmic pattern before accepting a stronger result; diffuse staining alone does not establish improved ATP5F1A detection (HPA tissue IHC; standard IHC practice).
Could fixation explain weak or uneven ATP5F1A staining?
The selected paraffin-section caption does not report its fixative, so ATP5F1A-specific fixation sensitivity is unknown for this antibody (datasheet A32267-2). Record the fixative, exposure time and processing history for each specimen, then compare sections processed together using identical EDTA retrieval at pH 8.0 (datasheet A32267-2; standard IHC practice). Examine tissue preservation alongside staining: damaged or unevenly processed areas can complicate interpretation of a granular cytoplasmic signal (HPA tissue IHC; standard IHC practice). Do not infer a preferred fixative or exposure time from the protein’s mitochondrial location, modified residues or tissue-staining profile (UniProt P25705; HPA tissue IHC).
Where should convincing ATP5F1A staining appear in a tissue section?
Expect a granular cytoplasmic pattern across tissues, consistent with ATP5F1A’s principal mitochondrial localisation (HPA tissue IHC; HPA subcellular). The protein belongs to the soluble F(1) head of the inner-membrane ATP synthase complex and has no annotated transmembrane segment (UniProt P25705 topology and subunit). Assess staining within intact cells against their cytoplasmic boundaries and compare adjacent cells under the same chromogenic development conditions (standard IHC practice). A cell-surface interaction has been reported on T cells, but prominent nuclear or uniformly diffuse staining in an ordinary tissue section needs independent confirmation before assignment to ATP5F1A (UniProt P25705 subcellular and interaction; standard IHC practice).
How can epitope choice affect interpretation of ATP5F1A IHC?
ATP5F1A has 3 annotated isoforms, and its mature mitochondrial chain spans residues 44–553 (UniProt P25705 processing and isoforms). The selected caption gives no epitope sequence, so its staining cannot establish which isoforms the catalog antibody detects (datasheet A32267-2; UniProt P25705 isoforms). When comparing antibodies, obtain each documented immunogen or epitope and check whether it falls within shared sequence before interpreting discordant staining as biological variation (standard IHC practice; UniProt P25705 isoforms). Modification sites, including the annotated site at residue 76, warrant epitope-level scrutiny only when antibody-binding information supports a specific concern (UniProt P25705 modified residues; standard IHC practice).
How would I check the IHC pattern with multiplex immunofluorescence?
On the separate IF/ICC workflow, pair ATP5F1A with an appropriate cell-type marker, such as a glandular epithelial marker when examining glandular cells (HPA tissue IHC; standard IF practice). Choose spectrally separated fluorophores and place the weaker signal in a channel with less tissue autofluorescence; inspect single-stain and unstained controls before interpreting overlap (standard IF practice). Because the F(1) head is associated with the mitochondrial inner membrane, optimise permeabilisation for access to the matrix-facing epitope while checking mitochondrial morphology (UniProt P25705 subunit and topology; standard mitochondrial biology and IF practice). Compare the resulting pattern with mitochondrial localisation, without transferring the paraffin-section retrieval conditions to IF/ICC (HPA subcellular; datasheet A32267-2).
What should I check when ATP5F1A IHC has heavy background?
Begin with a no-primary control and inspect whether colour persists in the same structures; residual signal can indicate detection-system background or endogenous peroxidase activity (standard IHC practice). The selected paraffin-section example used 10% goat serum blocking, a peroxidase-conjugated secondary antibody and DAB development (datasheet A32267-2). Peroxidase blocking and careful DAB development are general chromogenic workflow checks, rather than evidence of an ATP5F1A-specific background mechanism (standard IHC practice). Review primary-antibody concentration against the caption’s 2 μg/ml condition, then judge any improvement by preserved granular cytoplasmic staining and clean control sections (datasheet A32267-2; HPA tissue IHC; standard IHC practice).
How should I quantify ATP5F1A staining across sections? ⚠ ANSWER MARKED FOR VERIFICATION
Define the cell population and tissue region before scoring, then apply the same inclusion rules to every paraffin section (standard IHC practice). An H-score combines the percentage of cells at each intensity and ranges from 0–300; alternatively, report percentage-positive cells or positive-cell density per mm² when those measures fit the question (standard IHC practice). Score granular cytoplasmic staining within intact cells, using the same threshold and chromogenic development settings across comparison groups (HPA tissue IHC; standard IHC practice). Normalise counts to the relevant cell population or measured viable tissue area, and report both staining extent and intensity when tissue composition differs (standard IHC practice).
How can I distinguish true ATP5F1A signal from staining artefact?
A credible result shows granular cytoplasmic staining in intact cells, matching the reported tissue pattern and principal mitochondrial location (HPA tissue IHC; HPA subcellular). Compare suspicious regions with nearby well-preserved cells and a no-primary control before assigning signal to ATP5F1A (standard IHC practice). Strong nuclear staining, signal confined to section edges or necrotic areas, and colour persisting without primary antibody each require an artefact check (standard IHC practice; UniProt P25705 subcellular). Because ATP5F1A is broadly detected across tissues, judge the expected cell population and compartment alongside control staining; chromogenic intensity alone does not identify a specific ATP synthase change (HPA tissue IHC; UniProt P25705 function; standard IHC practice).
Boster reagents

Best ATP5F1A / ATP synthase F(1) complex subunit alpha, mitochondrial IHC Antibodies

ATP5F1A antibody A32267-2 has IHC images from human paraffin sections and IF images from human cells and paraffin sections (catalog image captions); listed reactivity includes human, mouse and rat (catalog reactivity).

Real IHC data IHC analysis of ATP5F1A using anti-ATP5F1A antibody (A32267-2). ATP5F1A was detected in a paraffin-embedded section of human endometrial adenocarcinoma tissue. Heat mediated antigen retrieval was performed in EDTA buffer (pH 8.0, epitope retrieval solution). The tissue section was blocked with 10% goat serum. The tissue section was then incubated with 2 μg/ml rabbit anti-ATP5F1A Antibody (A32267-2) overnight at 4°C. Peroxidase Conjugated Goat Anti-rabbit IgG was used as secondary antibody and incubated for 30 minutes at 37°C. The tissue section was developed using HRP Conjugated Rabbit IgG Super Vision Assay Kit (Catalog # SV0002) with DAB as the chromogen.
Anti-ATP5F1A Antibody ®
Cat # A32267-2

A32267-2 is the sole card; its IHC captions show human endometrial adenocarcinoma, placenta, rectal cancer and thyroid cancer paraffin sections (catalog IHC image captions). Its IF captions show HepG2 cells and human placenta and colon cancer paraffin sections (catalog IF image captions).

Which to pick: Choose A32267-2 for paraffin section IHC: its captions document EDTA pH 8.0 retrieval and 2 μg/ml primary antibody in human sections; the fixative is unreported (catalog IHC image captions). The same SKU supports IF/ICC in the listed human samples at 5 μg/ml (catalog IF image captions). For mouse or rat work, A32267-2 lists reactivity with both species, but its supplied IHC and IF images show human samples only (catalog reactivity; catalog image captions).

Each figure is that product's own IHC / IF validation image from its datasheet.

References

  1. UniProt Consortium. UniProt entry P25705 (ATPA_HUMAN, ATP synthase F(1) complex subunit alpha, mitochondrial).
  2. Human Protein Atlas. ATP5F1A tissue IHC expression (reliability: Enhanced).
  3. Human Protein Atlas. ATP5F1A subcellular location (ICC-IF): Mainly localized to the mitochondria. In addition localized to the end piece..
  4. Human Protein Atlas. ATP5F1A antibody validation summary (3 antibodies).
  5. Alpha-ketoglutarate alleviates acute pancreatitis by restoring energy metabolism. iScience 2026 — PMC13059122.
  6. Overexpression of ATP5F1A in Cardiomyocytes Promotes Cardiac Reverse Remodeling. Circulation. Heart failure 2024 — PMC11244755.
  7. TNK2/ACK1-mediated phosphorylation of ATP5F1A (ATP synthase F1 subunit alpha) selectively augments survival of prostate cancer while engendering mitochondrial vulnerability. Autophagy 2023 — PMC9980697.
  8. Reduced Levels of ATP Synthase Subunit ATP5F1A Correlate with Earlier-Onset Prostate Cancer. Oxidative medicine and cellular longevity 2018 — PMC6261400.
  9. PubMed PMID:1830491 — UniProt-cited evidence.
  10. PubMed PMID:8428659 — UniProt-cited evidence.
  11. PubMed PMID:8086450 — UniProt-cited evidence.