This website uses cookies to ensure you get the best experience on our website.


- Table of Contents
Source-linked ATRX Western blot protocol options, expected-band and isoform facts, troubleshooting for weak or shifted signal, and recommended anti-ATRX WB antibodies. Everything you need to plan the experiment before you commit precious samples.

Expected bands, source-linked protocol options, controls and antibodies — the at-a-glance facts below, then the full design guide.
| Expected band | ~282.6 kDa | |
| Observed band | 300 kDa | |
| Gel | 8% (catalog A00203-2) | |
| Positive control | Adipose tissue (IHC candidate; verify WB) +4 more | |
| Negative control | Suggested KO / knockdown lysate |
| PTM | Phosphorylated + Acetylated | |
| Caveat | Modification-state controls | |
| Gene-set association | MSigDB Hallmark membership | |
| Isoform | 6 isoform(s) |
The A00203-2 protocol combines labelled catalog values with standard starting conditions. Published comparisons retain their own sample, reagent and detection scope.
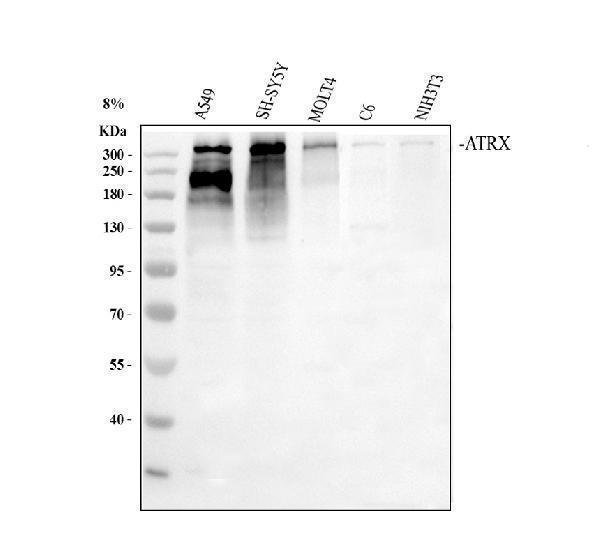
| Sample / lysate | human A549, human SH-SY5Y, human MOLT4, rat C6, mouse NIH/3T3 (catalog A00203-2) |
| Gel % | 8% (catalog A00203-2) |
| Load | 30 ug; reducing conditions (catalog A00203-2) |
| Transfer | a nitrocellulose membrane at 150 mA for 50-90 minutes (catalog A00203-2) |
| Membrane | nitrocellulose membrane (catalog A00203-2) |
| Blocking | 5% non-fat milk/TBS for 1.5 hour at RT (catalog A00203-2) |
| Primary antibody | A00203-2 · 0.5 μg/mL (catalog A00203-2) |
| Primary incubation | overnight at 4°C (catalog A00203-2) |
| Secondary antibody | goat anti-rabbit IgG-HRP, 1:5000 (catalog A00203-2) |
| Secondary incubation | 1.5 hour at RT (catalog A00203-2) |
| Wash | TBS-0.1%Tween 3 times with 5 minutes each (catalog A00203-2) |
| Detection | ECL (catalog A00203-2) |
ATRX is predicted at 282.6 kDa and observed near 300 kDa; the cause of the difference is not established.
| Band near 300 kDa | matches the observed ATRX band; confirm identity with antibody controls |
| Band near 283 kDa | aligns with the sequence-predicted mass; identity requires confirmation |
| Additional bands at different sizes | could reflect ATRX isoforms, but distinct migration has not been demonstrated |
| Weak whole-cell band with stronger nuclear signal | is consistent with ATRX nuclear localization |
| UniProt predicted mass | 282.6 kDa is the sequence-based reference; the observed band is near 300 kDa |
| Isoforms 1 and 2 | sequence differences may affect migration; their individual band sizes are unknown |
| Isoforms 3 and 4 | sequence differences may affect migration; their individual band sizes are unknown |
| Isoforms 5 and 6 | sequence differences may affect migration; their individual band sizes are unknown |
| Situation | Likely cause | Next action |
|---|---|---|
| No band in lysate | nuclear ATRX may be poorly recovered | check nuclear extraction and a known positive lysate |
| Band higher than expected | the observed ATRX band is near 300 kDa, above its 282.6 kDa predicted mass; the cause is unestablished | compare with the antibody QC band and confirm identity with an independent antibody |
| Band lower than expected | an isoform or degraded ATRX is possible, but neither is established for the band | check sample integrity and confirm identity with an independent antibody |
| Multiple bands | ATRX has six isoforms, though distinct bands are unproven | compare antibody epitopes and confirm bands with an independent antibody |
| Weak or no signal | nuclear ATRX recovery may be low | check nuclear fraction recovery and include a known positive lysate |
Comprehensive Human Protein Atlas IHC scoring per tissue. Rows are taken directly from the HPA tissue chart — click any row's HPA link to view the source.
| Tissue | Cell type | Level | Evidence | Source |
|---|---|---|---|---|
| Adipose tissue | adipocytes | High | Protein (IHC) | HPA → |
| Adrenal gland | glandular cells | High | Protein (IHC) | HPA → |
| Appendix | endocrine cells | High | Protein (IHC) | HPA → |
| Bone marrow | hematopoietic cells | High | Protein (IHC) | HPA → |
| Breast | adipocytes | High | Protein (IHC) | HPA → |
| Tissue | Cell type | Level | Evidence | Source |
|---|---|---|---|---|
| Liver | cholangiocytes | Low | Protein (IHC) | HPA → |
| Parathyroid gland | glandular cells | Low | Protein (IHC) | HPA → |
| Cervix | glandular cells | Medium | Protein (IHC) | HPA → |
| Endometrium | cells in endometrial stroma | Medium | Protein (IHC) | HPA → |
| Lymph node | non-germinal center cells | Medium | Protein (IHC) | HPA → |
Deeper troubleshooting and optimisation questions for ATRX, answered from its protein features.
Catalog antibodies with Western blot application and product-specific WB images. Evaluate suitability with the reported sample, controls and experimental conditions.
The catalog reports A00203-2 for ATRX Western blotting, with a blot image showing a reported band near 300 kDa versus the expected 283 kDa. The caption documents human, rat, and mouse cell lysates; evidence is limited to the supplied product image.
Which to pick: A00203-2 is the only listed option. Its stated reactivity covers human, mouse, and rat, and its WB image includes A549, SH-SY5Y, MOLT4, C6, and NIH/3T3 lysates. Choose it when those reported contexts fit your experiment.