This website uses cookies to ensure you get the best experience on our website.


- Table of Contents
Plan CAV2 chromogenic IHC in paraffin sections using cell type staining reported by HPA (HPA tissue IHC) and caveolar membrane localisation as a molecular expectation (UniProt). The guide covers fixation consistency, controls and scoring by cell type.

Expected localisation, validated protocols, controls and antibodies — the at-a-glance facts below, then the full design guide.
| Expected localisation | Caveolar membrane expected (UniProt); tissue compartment unreported (HPA tissue IHC) | |
| Staining pattern | Adipocytes, endothelium, pneumocytes and squamous basal cells (HPA tissue IHC) | |
| Antigen retrieval | EDTA pH 8.0 HIER, heat-mediated (datasheet A01574) | |
| Positive control | Adipose tissue+4 more · see all | |
| Negative control | Appendix+4 more · see all |
| Fixation | Keep fixation consistent across sections (standard IHC practice; not target-specific) | |
| Caveat | Adipocytes can dominate staining in mixed tissue (HPA tissue IHC) | |
| Regulation | Insulin may enrich nuclear signal (UniProt) | |
| Isoform / epitope | Three isoforms; epitope differences unreported, both termini cytoplasmic (UniProt) |
The catalog antibody’s IHC-P protocol (datasheet: A01574) is accompanied by published CAV2 protocols for breast cancer tissue microarrays (PMC2480981) and head and neck squamous cell carcinoma sections (PMC9481523).
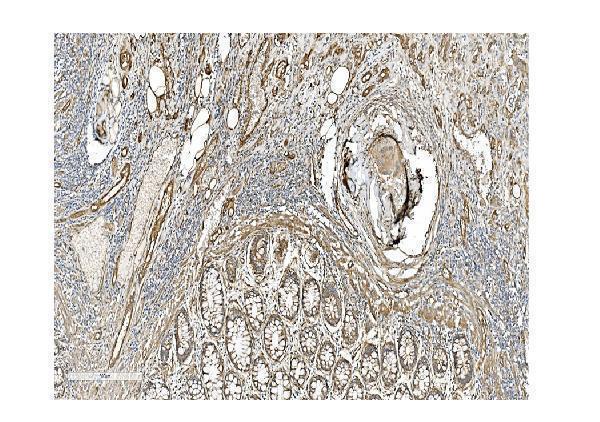
| Sample | Paraffin-embedded human rectal cancer tissue; fixative not specified (datasheet A01574) |
| Fixation | Image fixative and duration unreported (datasheet A01574); verify before use. |
| Sectioning | 4–5 µm sections on charged slides (standard) |
| Deparaffinisation | Xylene, graded ethanol series to water (standard) |
| Antigen retrieval | Heat retrieval: EDTA pH 8.0 (datasheet A01574); 20 min, 95–100 °C (standard) |
| Peroxidase block | 3% H2O2, 10 min, room temperature (standard) |
| Blocking | 10% goat serum (datasheet A01574) |
| Primary antibody | Rabbit anti-CAV2, 0.5-1μg/ml (datasheet A01574) |
| Primary incubation | Overnight at 4 °C (datasheet A01574) |
| Detection | Streptavidin-biotin complex (SABC), DAB chromogen (datasheet A01574) |
| Counterstain | Hematoxylin, blue, dehydrate and mount (standard) |
| Expected result | CAV2-positive staining in adipocytes of adipose tissue (HPA tissue IHC: High). HPA tissue profile: Distinct expression in adipocytes, endothelial cells, pneumocytes and basal cells of squamous epithelia. No signal in the no-primary control. |
CAV2 is a caveolar membrane protein with cytoplasmic-facing regions; UniProt also reports cytoplasmic, Golgi and conditional nuclear localization (UniProt P51636 topology and localization). In paraffin-section IHC, expect staining in adipocytes, endothelial cells, pneumocytes and basal cells of squamous epithelia (HPA tissue IHC: Enhanced reliability). Judge the pattern by the stained cell type as well as its compartment.
| Distinct peripheral staining in adipocytes or endothelial cells, with little surrounding background. | Consistent with CAV2 at caveolar membranes (UniProt P51636 localization) and the HPA tissue profile (HPA: adipocytes and endothelial cells). Assess intact cells and tissue architecture before scoring. |
| Predominantly nuclear staining throughout many cell types, without a convincing peripheral pattern. | Investigate nonspecific signal or an imaging artefact. Nuclear CAV2 is reported under specific phosphorylation and insulin-linked conditions (UniProt P51636); routine nuclear staining alone does not establish that state. |
| Strong signal in bone-marrow hematopoietic cells or appendix glandular cells. | These cell populations are listed as not detected (HPA tissue IHC). Consider antibody cross-reactivity or endogenous chromogenic activity; inspect a secondary-only control and the expected positive cell population. |
| Uniform haze across cells, stroma and empty slide areas. | This lacks the cell-selective pattern in the HPA profile (HPA tissue IHC). Check blocking, washes and detection controls as general IHC practice before assigning the haze to CAV2. |
| No signal in adipocytes of an otherwise interpretable adipose section. | HPA reports high staining in adipocytes (HPA: adipose tissue). Review the catalog antibody's IHC-P instructions, antigen retrieval and detection controls as general IHC troubleshooting; absence alone does not identify the failed step. |
| Compartment and topology | CAV2 has cytoplasmic-facing regions and no annotated transmembrane segment (UniProt P51636 topology). Expect membrane-associated staining, while allowing reported cytoplasmic or Golgi signal (UniProt P51636 localization); a peripheral pattern need not outline every cell continuously. |
| Cell population within a section | HPA reports high staining in adipocytes in adipose tissue and breast, and in Bowman's capsule cells in kidney (HPA tissue IHC). Its negative calls name specific cell populations; they do not make the entire organ a negative control. |
| Phosphorylation-dependent location | UniProt places Tyr-27-phosphorylated CAV2 in cytoplasm and plasma membrane, Ser-36-phosphorylated CAV2 in intracellular compartments, and Tyr-19-phosphorylated CAV2 in the nucleus after insulin-linked signaling (UniProt P51636). Total-CAV2 staining cannot identify a modification. |
| Antibody evidence | HPA lists IHC as Supported for HPA044810 and Enhanced for CAB013488 (HPA antibodies). The tissue profile also has Enhanced reliability (HPA tissue IHC). Apply the validation status to the antibody used; it does not validate every unexpected compartment. |
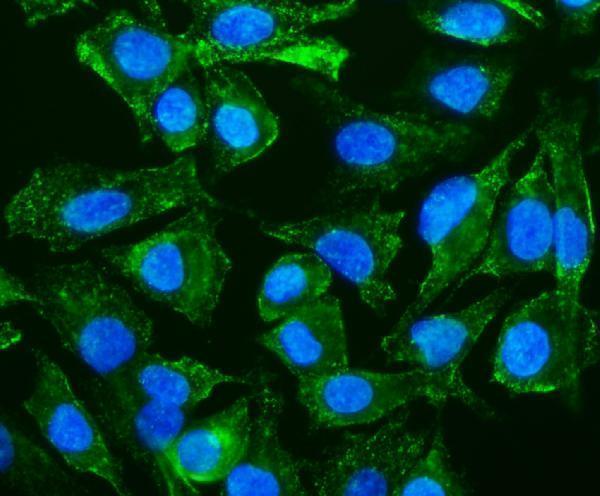
| IF/ICC Q&A: should vesicles appear? | Yes: vesicles are the approved ICC-IF main location (HPA subcellular). This is a microscopy comparison, not an IHC-P protocol option. The paraffin-section interpretation should still use tissue-specific IHC evidence (HPA tissue IHC). |
| Situation | Likely cause | Next action |
|---|---|---|
| Adipose positive control is blank. | The missing signal could arise at retrieval, primary incubation or detection; HPA staining does not establish CAV2-specific fixation sensitivity (HPA: adipocytes High). | Follow the catalog antibody's IHC-P instructions and check retrieval and detection with an established control (general IHC practice). |
| Only the nuclear compartment is strongly stained. | Nuclear localization is conditional in the UniProt account (UniProt P51636); an isolated nuclear result cannot confirm the reported signaling state. | Compare with a positive cell population and a secondary-only control; review nuclear counterstain and morphology (general IHC practice). |
| Hematopoietic or glandular cells stain strongly. | HPA lists bone-marrow hematopoietic cells and appendix glandular cells as not detected (HPA tissue IHC); cross-reactivity or endogenous detection activity is possible. | Check a secondary-only section and the detection-system block, then compare the suspect cells with an HPA-positive cell population (general IHC practice). |
| All regions have brown haze. | Diffuse staining does not match the distinct cellular profile (HPA tissue IHC); excess detection background is possible. | Inspect no-primary controls, blocking and washes; adjust the IHC workflow only against a retained positive control (general IHC practice). |
| A kidney or breast section appears partly negative. | HPA's high calls apply to Bowman's capsule cells in kidney and adipocytes in breast, not every cell in those sections (HPA tissue IHC). | Score the named cell population separately using morphology; avoid calling the whole section positive or negative (HPA tissue IHC). |
| IHC and ICC-IF show different-looking patterns. | HPA reports vesicles in ICC-IF and distinct positive tissue cell populations in IHC (HPA subcellular; HPA tissue IHC); the observations use different preparations. | Interpret the paraffin section against its IHC cell profile; use the separate IF/ICC guide for fluorescence workflow (HPA tissue IHC; HPA subcellular). |


Comprehensive Human Protein Atlas IHC scoring per tissue (reliability: Enhanced — High consistency between antibody staining and RNA expression data.). Rows are taken directly from the HPA tissue chart — click any row's HPA link to view the source.
| Tissue | Cell type | Level | Evidence | Source |
|---|---|---|---|---|
| Adipose tissue | Adipocytes | High | Protein (IHC) | HPA → |
| Breast | Adipocytes | High | Protein (IHC) | HPA → |
| Bronchus | Respiratory epithelial cells | High | Protein (IHC) | HPA → |
| Cervix | Squamous epithelial cells | High | Protein (IHC) | HPA → |
| Endometrium | Cells in endometrial stroma | High | Protein (IHC) | HPA → |
| Tissue | Cell type | Level | Evidence | Source |
|---|---|---|---|---|
| Appendix | Glandular cells | Not detected | Protein (IHC) | HPA → |
| Bone marrow | Hematopoietic cells | Not detected | Protein (IHC) | HPA → |
| Caudate | Glial cells | Not detected | Protein (IHC) | HPA → |
| Cerebellum | Cells in granular layer | Not detected | Protein (IHC) | HPA → |
| Duodenum | Glandular cells | Not detected | Protein (IHC) | HPA → |
Troubleshoot CAV2 staining in paraffin sections by checking retrieval, cell identity and subcellular pattern before interpreting chromogenic signal.
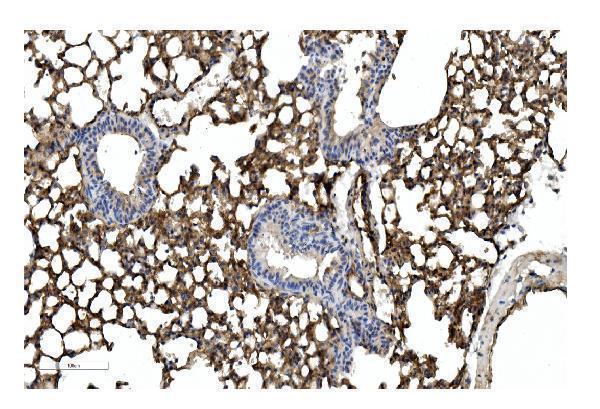
Catalog anti-CAV2 antibodies have IHC images from human, mouse and rat paraffin sections, plus IF images from human tissue and A549 cells (catalog image captions).
A01574 has IHC images from human rectal cancer and mouse and rat lung, plus IF images from human intestinal cancer and A549 cells; PB9166 has IHC images from human rectal cancer and rat lung, plus IF images from human rectal cancer and A549 cells (catalog image captions). PA1540 has IHC images from human lung cancer and rat cardiac muscle; M01574 has an IHC image from human colon (catalog image captions).
Which to pick: For paraffin-section IHC, A01574 or PB9166 has a documented starting workflow: EDTA retrieval at pH 8.0, 10% goat-serum block and 1 μg/ml primary overnight at 4°C, followed by biotin–streptavidin/DAB detection (A01574 and PB9166 IHC image captions); the fixative is unreported in both captions. For IF/ICC, PB9166 has human tissue and A549 images at 2 μg/ml, while A01574 has corresponding images at 5 μg/ml despite a catalog IF dilution of 4 μg/ml (PB9166 and A01574 IF image captions; A01574 catalog dilution). For IHC across human, mouse and rat, choose A01574 because its IHC images cover all three species; M01574 is a rabbit monoclonal option limited to human reactivity, with a human-colon IHC image (A01574 IHC image captions; M01574 catalog applications and reactivity; M01574 IHC image caption).