This website uses cookies to ensure you get the best experience on our website.


- Table of Contents
Plan CCNB2 IHC-P around cytoplasmic staining in subsets of tissue cells (HPA tissue IHC). Use bone marrow hematopoietic cells as a positive reference and adipocytes as a negative reference (HPA tissue IHC), then compare staining with consistent fixation and scoring.

Expected localisation, validated protocols, controls and antibodies — the at-a-glance facts below, then the full design guide.
| Expected localisation | Cytoplasmic staining in a subset of tissue cells (HPA tissue IHC) | |
| Staining pattern | Subset-positive cytoplasmic cells across several tissues (HPA tissue IHC) | |
| Antigen retrieval | EDTA pH 8.0 HIER, heat-mediated (datasheet M02040) | |
| Positive control | Appendix+4 more · see all | |
| Negative control | Adipose tissue+4 more · see all |
| Fixation | Keep fixation consistent across sections (standard IHC practice; not target-specific) | |
| Caveat | Subset staining can make bulk tissue appear weak (HPA tissue IHC) | |
| Regulation | G2/mitotic-specific expression (UniProt) | |
| Isoform / epitope | No annotated isoforms, signal peptide or propeptide (UniProt) |
Compare the catalog antibody’s EDTA pH 8.0 IHC protocol (datasheet M02040) with four published CCNB2 IHC protocols (PMC8728388; PMC11832750; PMC3545739; PMC8331305).
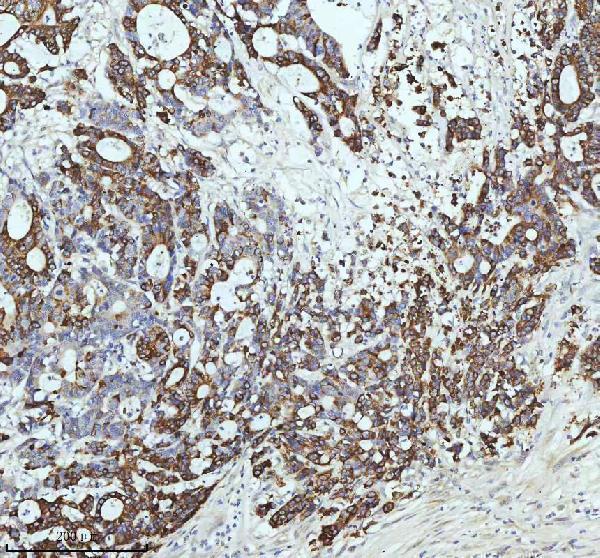
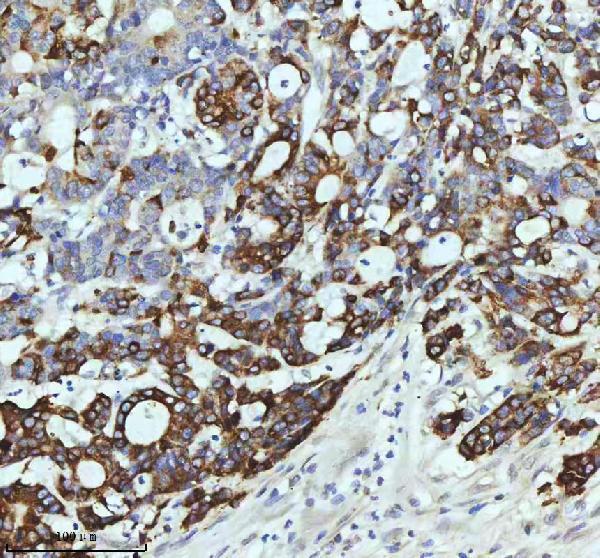
| Sample | Paraffin-embedded human colon adenocarcinoma tissue; fixative not specified (datasheet M02040) |
| Fixation | Image fixative and duration unreported (datasheet M02040); verify before use. |
| Sectioning | 4–5 µm sections on charged slides (standard) |
| Deparaffinisation | Xylene, graded ethanol series to water (standard) |
| Antigen retrieval | Heat retrieval: EDTA pH 8.0 (datasheet M02040); 20 min, 95–100 °C (standard) |
| Peroxidase block | 3% H2O2, 10 min, room temperature (standard) |
| Blocking | 10% goat serum (datasheet M02040) |
| Primary antibody | Rabbit monoclonal (clone GIG-3) anti-CCNB2, 1:50 (datasheet M02040) |
| Primary incubation | Overnight at 4 °C (datasheet M02040) |
| Detection | HRP-conjugated secondary, DAB chromogen (datasheet M02040) |
| Counterstain | Hematoxylin, blue, dehydrate and mount (standard) |
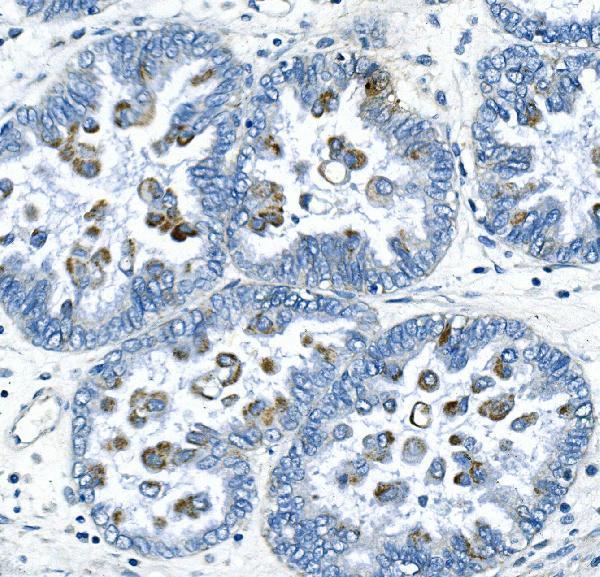
| Expected result | CCNB2-positive staining in endocrine cells of appendix (HPA tissue IHC: High). HPA tissue profile: Cytoplasmic expression in a subset of cells in several tissues. No signal in the no-primary control. |
In paraffin-section IHC, expect CCNB2 staining in the cytoplasm of a subset of cells, rather than uniform staining across a tissue (HPA tissue IHC). Reported high-staining cells include bone-marrow hematopoietic cells, appendix and intestinal endocrine cells, and testis Leydig cells (HPA tissue IHC). HPA rates the tissue pattern Enhanced but notes medium consistency with RNA data (HPA tissue IHC). CCNB2 has no transmembrane segment (UniProt O95067 topology).
| Distinct cytoplasmic staining in some hematopoietic cells in bone marrow or endocrine cells in appendix. | This matches reported high staining in those cell populations and the subset pattern across tissues (HPA tissue IHC). Score the identified cells and compartment; a whole-section average can conceal a restricted positive population (standard IHC practice). |
| Strong nuclear-only or sharply membranous staining, with little cytoplasmic signal. | That differs from the reported cytoplasmic tissue pattern (HPA tissue IHC). Recheck cell identity and controls before interpreting it as CCNB2; tissue IHC alone does not establish every possible cell-cycle-dependent location (UniProt O95067 function; HPA tissue IHC). |
| Prominent staining in adipocytes, cardiomyocytes, or lung alveolar cells. | Those cells are reported as not detected (HPA tissue IHC). Check whether the signal follows tissue structures or appears in reagent controls; cross-reactivity or endogenous chromogenic activity are possible explanations (standard IHC practice). |
| Diffuse color across several compartments, including areas without identifiable positive cells. | This obscures the reported subset-specific cytoplasmic pattern (HPA tissue IHC). Compare a primary-antibody omission control and inspect the counterstain before scoring; diffuse background alone cannot establish CCNB2 expression (standard IHC practice). |
| No signal in bone-marrow hematopoietic cells or testis Leydig cells. | Both are reported high-staining populations, so a blank result warrants a run-level check (HPA tissue IHC). Absence in one section is not proof of target absence: assess tissue preservation, controls, and detection before drawing that conclusion (standard IHC practice). |
| Cell population and sampling | HPA describes expression in a subset of cells; bone-marrow hematopoietic cells, several intestinal endocrine populations, and testis Leydig cells are reported high, whereas adipocytes are not detected (HPA tissue IHC). Choose and score the relevant cells rather than treating every cell in a named tissue as equivalent. |
| Cell-cycle context | CCNB2 controls the G2/M transition and forms a complex with CDK1 (UniProt O95067 function and subunit). Differences between individual cells can be biologically plausible, but morphology and staining alone cannot assign a cell-cycle phase (standard IHC practice). |
| Evidence strength | HPA lists tissue-IHC reliability as Enhanced while describing medium consistency with RNA expression data; two listed antibodies have Enhanced IHC validation (HPA tissue IHC; HPA antibodies). Use that support for pattern selection without treating every unexpected stain as validated. |
| Compartment evidence across applications | Tissue IHC reports cytoplasmic expression (HPA tissue IHC). ICC-IF reports mainly cytosolic localization with additional Golgi localization (HPA subcellular). The Golgi observation can inform an IF/ICC readout but does not require a resolvable Golgi pattern in chromogenic paraffin sections. |
| Situation | Likely cause | Next action |
|---|---|---|
| A reported high-staining population is blank. | The relevant cells may be absent from the examined area, or the IHC run may have failed; HPA reports high staining in bone-marrow hematopoietic cells and testis Leydig cells (HPA tissue IHC). | Confirm cell identity and tissue quality, then review the run's positive control and detection steps before changing conditions (standard IHC practice). |
| Only nuclear or membrane staining is apparent. | The compartment conflicts with HPA's cytoplasmic tissue-IHC profile (HPA tissue IHC); the observation alone does not identify the cause. | Inspect morphology, controls, and staining distribution. Repeat with an independently validated antibody if the unexpected pattern persists (standard IHC practice; HPA antibodies). |
| Unexpectedly strong staining appears in a reported negative cell type. | HPA reports adipocytes, cardiomyocytes, and alveolar cells as not detected (HPA tissue IHC). Cross-reactivity or endogenous detection activity may contribute (standard IHC practice). | Check cell identity and a primary-antibody omission control; assess endogenous activity according to the chosen chromogenic detection system (standard IHC practice). |
| The section has diffuse background that hides cell boundaries. | Background from blocking, washing, or detection can prevent assessment of the expected subset pattern (standard IHC practice; HPA tissue IHC). | Compare the omission control, check reagent and wash steps, and score only signal localized to identifiable cells after the background is resolved (standard IHC practice). |
| The pattern varies between sections of the same tissue. | The reported expression is restricted to subsets, and HPA notes medium consistency between antibody staining and RNA data (HPA tissue IHC). Sampling may change which relevant cells are present. | Compare the same identified cell population across sections and record its cytoplasmic staining separately from the surrounding tissue (HPA tissue IHC; standard IHC practice). |
| In IF/ICC, where should CCNB2 signal be expected? | HPA reports mainly cytosolic localization, with additional Golgi localization, from ICC-IF evidence (HPA subcellular). | Interpret signal against those compartments and suitable IF/ICC controls; use the separate IF/ICC guide for that application's procedure (HPA subcellular; standard IF practice). |
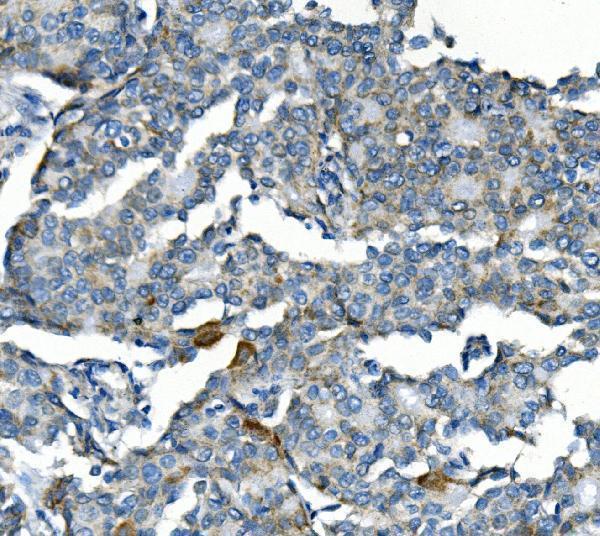
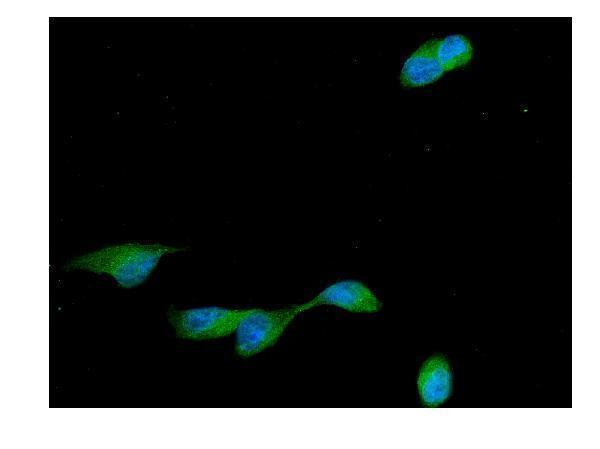


Comprehensive Human Protein Atlas IHC scoring per tissue (reliability: Enhanced — Medium consistency between antibody staining and RNA expression data.). Rows are taken directly from the HPA tissue chart — click any row's HPA link to view the source.
| Tissue | Cell type | Level | Evidence | Source |
|---|---|---|---|---|
| Appendix | Endocrine cells | High | Protein (IHC) | HPA → |
| Bone marrow | Hematopoietic cells | High | Protein (IHC) | HPA → |
| Colon | Endocrine cells | High | Protein (IHC) | HPA → |
| Duodenum | Endocrine cells | High | Protein (IHC) | HPA → |
| Rectum | Endocrine cells | High | Protein (IHC) | HPA → |
| Tissue | Cell type | Level | Evidence | Source |
|---|---|---|---|---|
| Adipose tissue | Adipocytes | Not detected | Protein (IHC) | HPA → |
| Cerebellum | Cells in granular layer | Not detected | Protein (IHC) | HPA → |
| Heart muscle | Cardiomyocytes | Not detected | Protein (IHC) | HPA → |
| Liver | Cholangiocytes | Not detected | Protein (IHC) | HPA → |
| Lung | Alveolar cells | Not detected | Protein (IHC) | HPA → |
Troubleshoot CCNB2 staining in paraffin sections by checking retrieval, cell-specific localisation and assay controls before interpreting chromogenic signal.
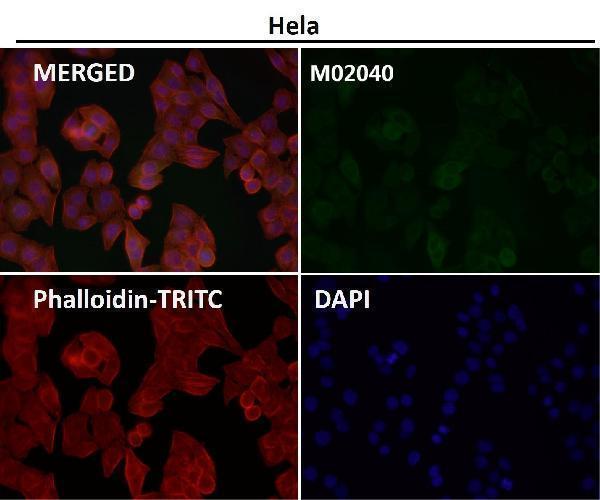
Both catalog antibodies have human paraffin-section IHC images; A02040-1 also has a cell-based IF image (catalog image captions). Both list human, mouse, and rat reactivity (catalog applications/reactivity).
M02040 will render with a human colon adenocarcinoma paraffin-section IHC figure and lists IHC and IF/ICC applications (M02040 image caption; catalog applications). A02040-1 will render with a human ovarian cancer paraffin-section IHC figure and also has a cell-based IF image (A02040-1 image captions).
Which to pick: For tissue IHC, choose M02040 for a rabbit monoclonal tested at 1:50 on a human paraffin section, or A02040-1 for a rabbit antibody tested at 1 μg/ml on a human paraffin section (catalog antibody details; respective IHC image captions). For IF/ICC, A02040-1 has a cell-based IF image at 2 μg/ml; M02040 lists IF/ICC and has IF images with limited sample details (catalog applications; respective IF image captions). Both list human, mouse, and rat reactivity, but the supplied IHC captions show human tissue only; neither IHC caption reports the fixative (catalog reactivity; respective IHC image captions).