This website uses cookies to ensure you get the best experience on our website.
- Table of Contents
16 Q&As
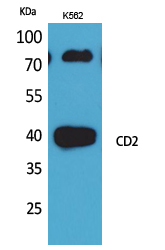
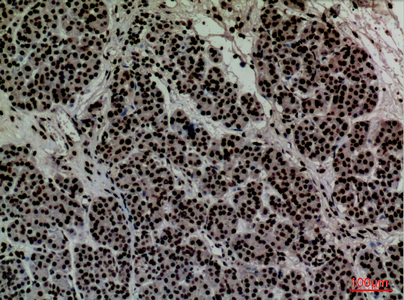
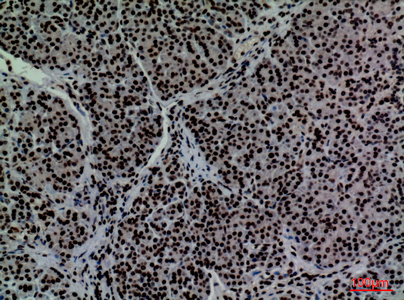
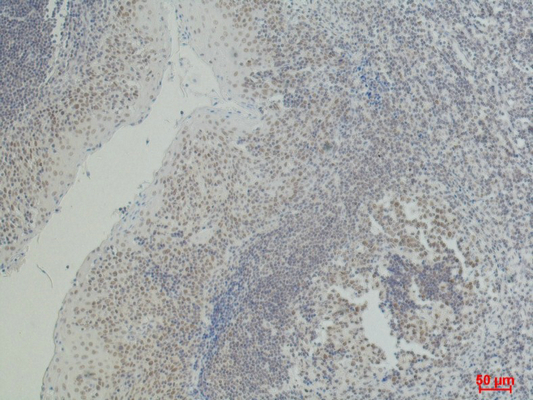
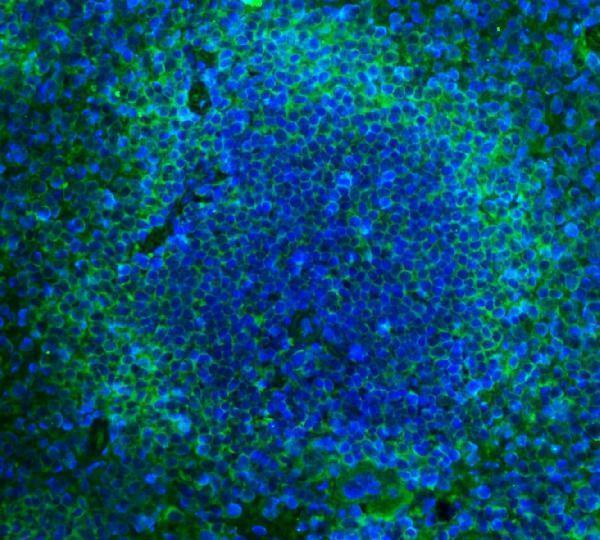
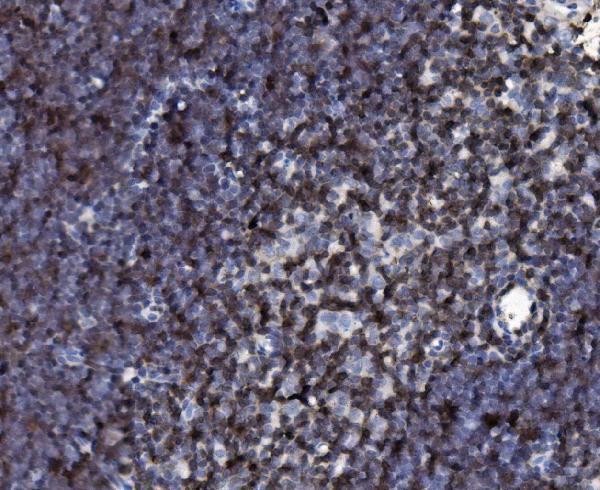
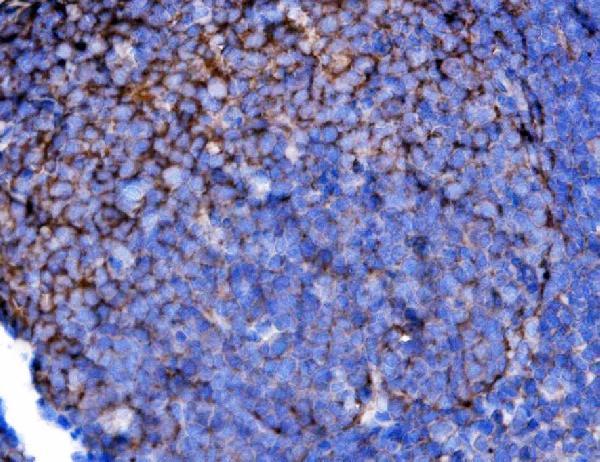
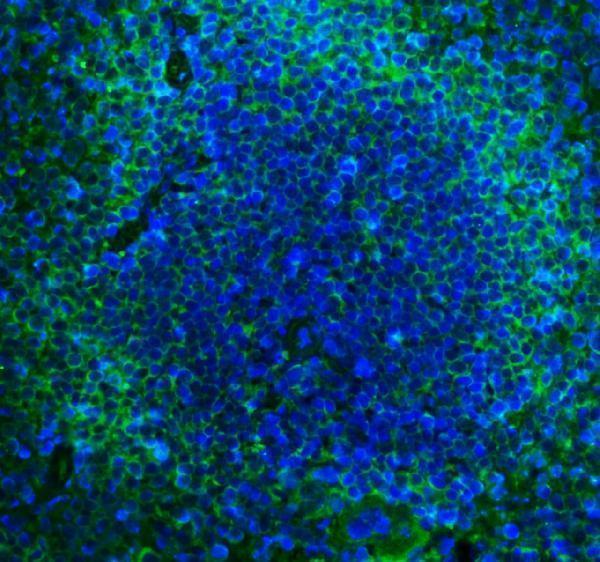
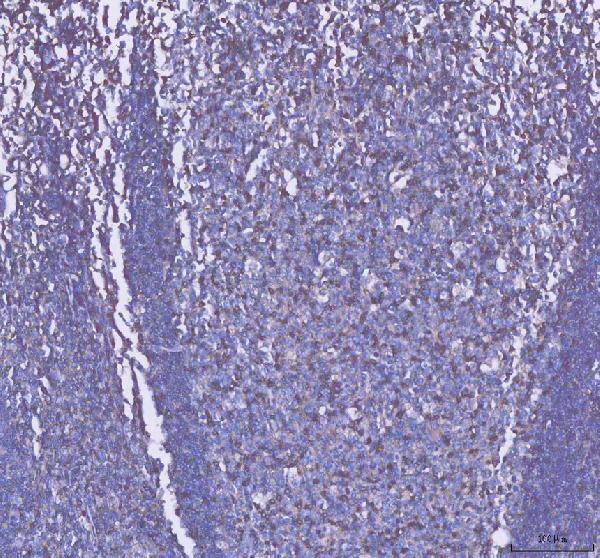
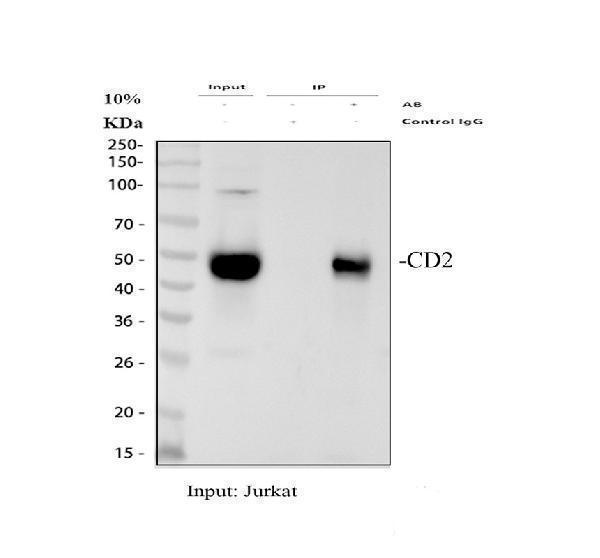
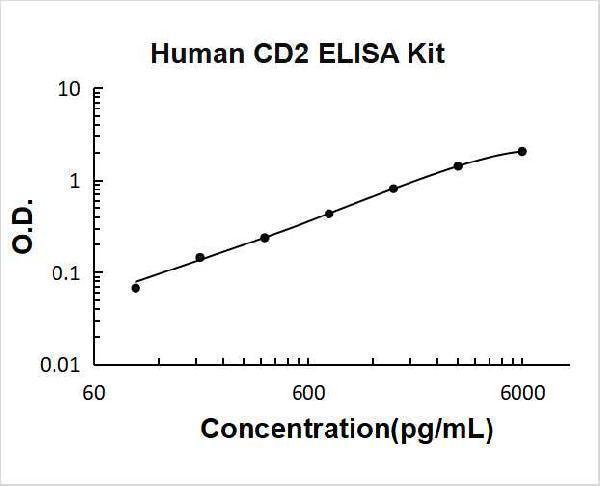
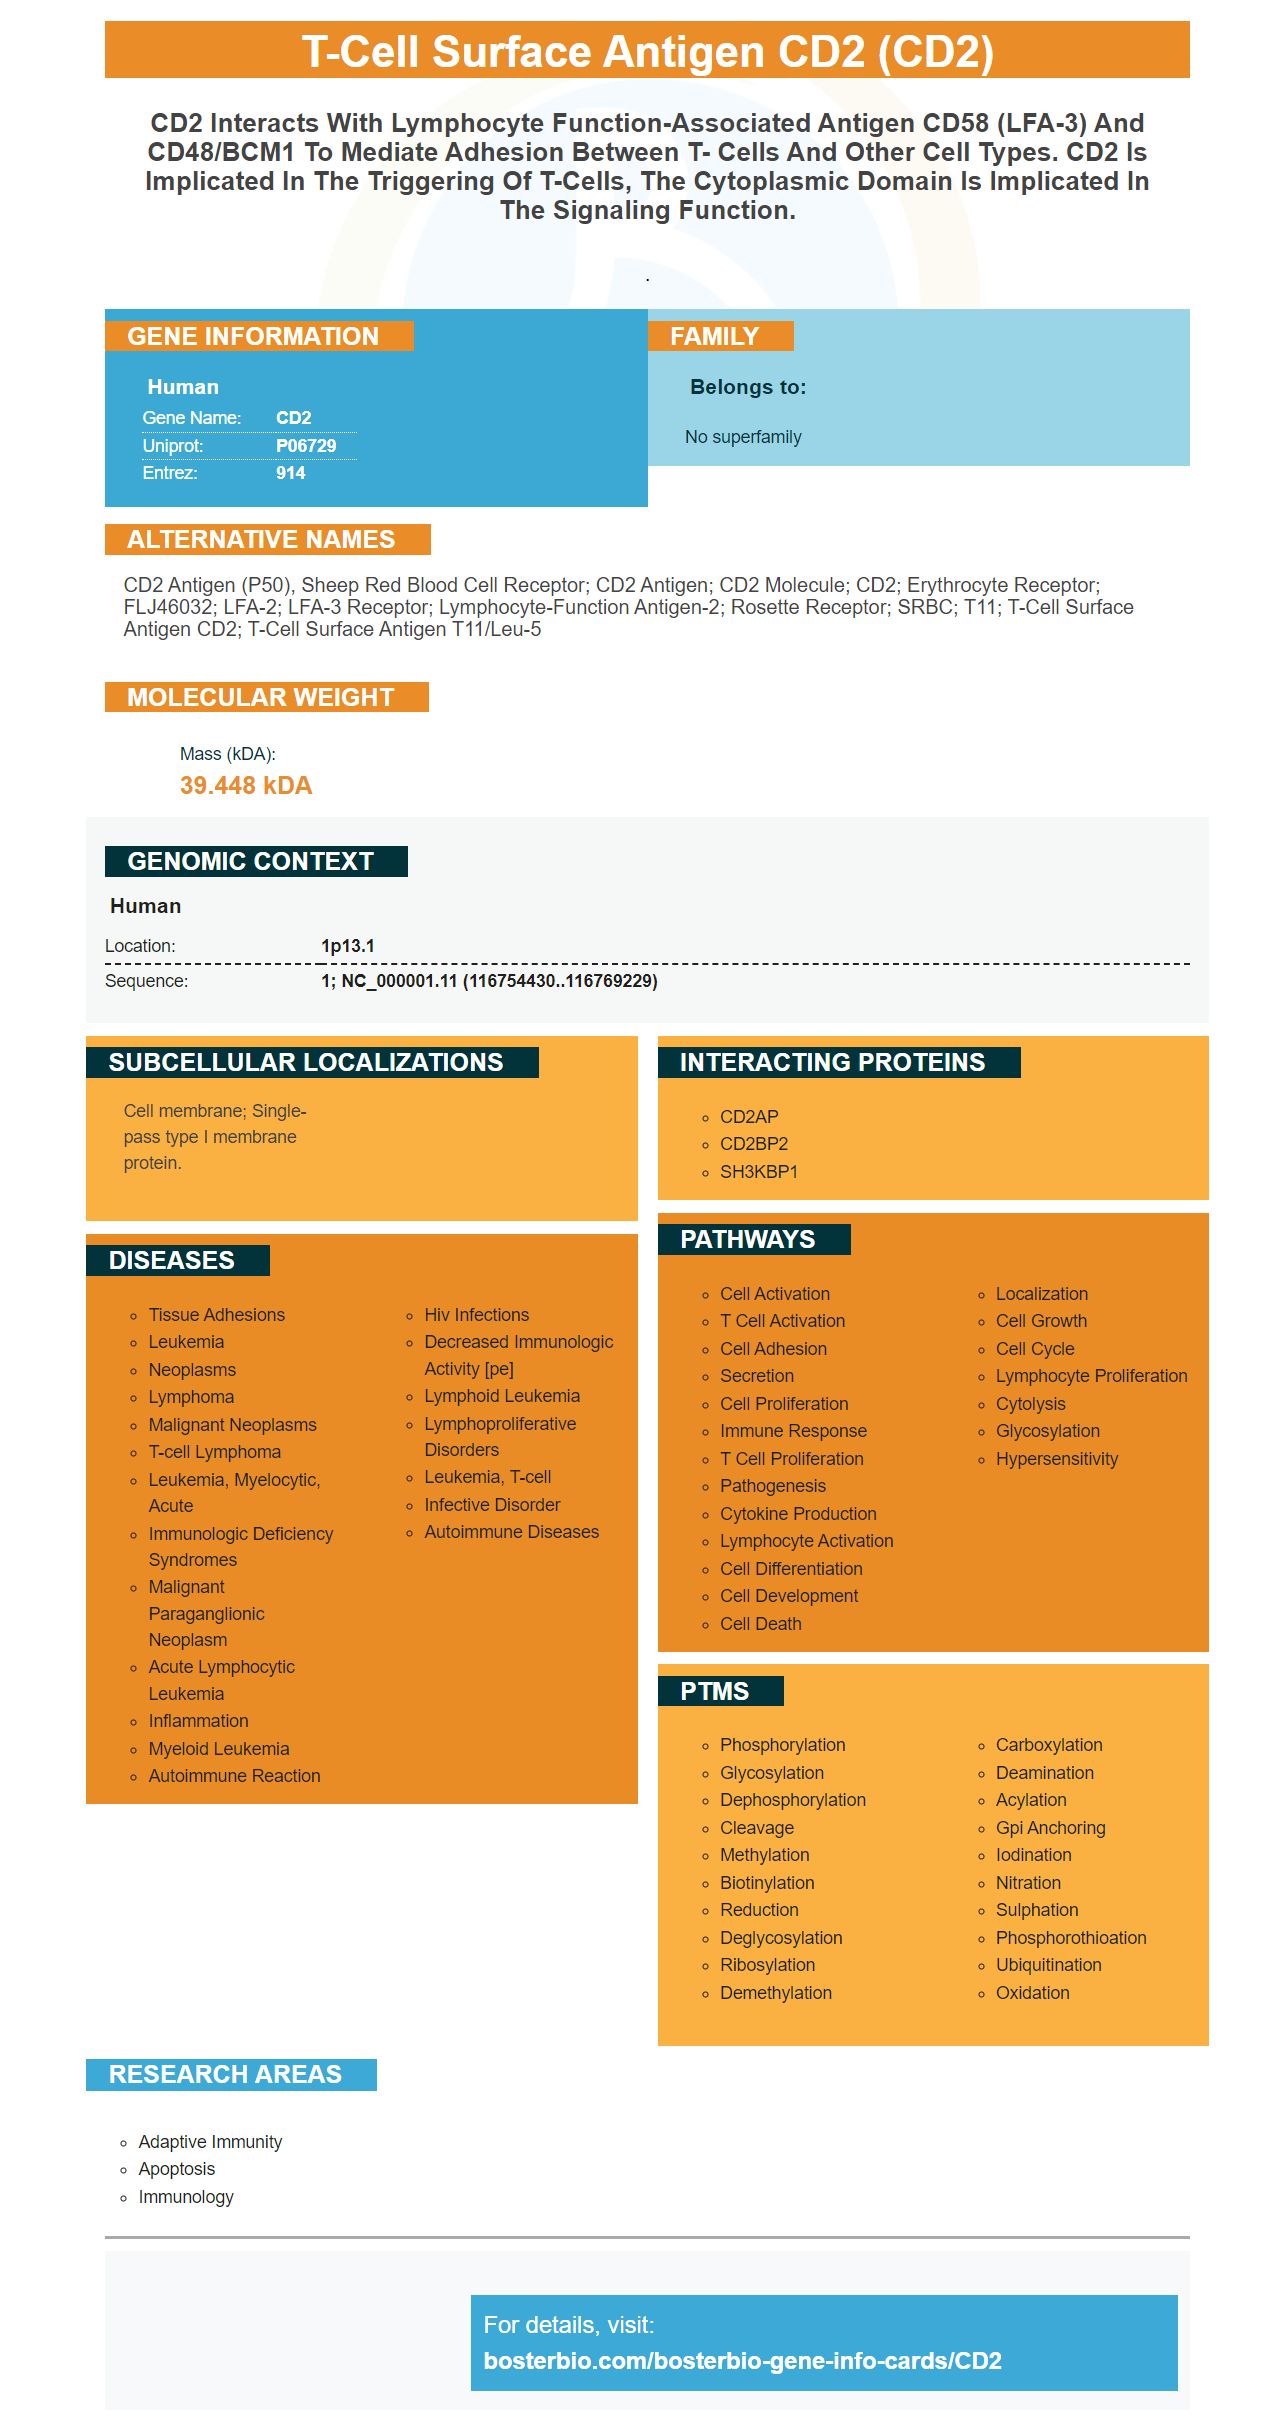
Facts about T-cell surface antigen CD2.
.
Human | |
---|---|
Gene Name: | CD2 |
Uniprot: | P06729 |
Entrez: | 914 |
Belongs to: |
---|
No superfamily |
CD2 antigen (p50), sheep red blood cell receptor; CD2 antigen; CD2 molecule; CD2; Erythrocyte receptor; FLJ46032; LFA-2; LFA-3 receptor; lymphocyte-function antigen-2; Rosette receptor; SRBC; T11; T-cell surface antigen CD2; T-cell surface antigen T11/Leu-5
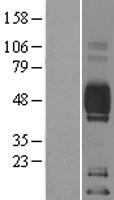
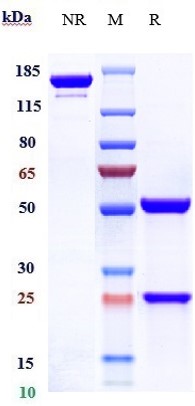
Mass (kDA):
39.448 kDA
Human | |
---|---|
Location: | 1p13.1 |
Sequence: | 1; NC_000001.11 (116754430..116769229) |
Cell membrane; Single-pass type I membrane protein.
If you've ever wondered how to get most out of your UCSC Genome Browser You've found the right resource. This article will help you understand how to utilize Boster Bio and its CD2 marker to get the most out of your research. There may be questions about the flow processes. Utilize the optimization guides and tricks below to get the most of your experiments.
The CD2 marker is one of the most common and effective pan-T-cell markers. It is located just after CD7 and prior to CD1. It is not present on all T cells. This is due to the fact that CD2 is expressed on certain peripheral T-cell lymphomas but not on all. CD2 can also be seen in some cases of acute myeloidleukemia (AML).
The CD2 marker is created by the immune system and can be useful in assessing the severity of an infection. It is among the most essential components of the immune system and assists in targeting pathogens responsible for disease. It also activates killer T cells known as CD8 T cells, which are special white blood cells. By determining the CD2 marker scientists can determine if an individual is infected and how strong their immune system is.
The UCSC Genome browser provides an innovative way to study human genetics. This interactive tool displays chromosome maps with vertical orientation as well as gene clusters in a vertical format. You can drill down to discover more information about genes, such as their function or expression. It also lets you make custom tracks for display in the UCSC genome browser. The new tool is easy to use.
UCSC Genome Browser allows users to search for gene sequences in a database. You can look through the genome of an organism or species to find gene sequences. A single species genome can be mapped to its distinct regions. This allows researchers to identify the genes that cause diseases such as hypertension and diabetes. The Genome browser from UCSC allows researchers to analyze the expression of thousands of genes within the genome of a single animal.
The liftOver tool of the UCSC Genome Browser allows users to browse through data from multiple sources of genomic data. The tool is a closed coordinate system that is 1 start. This is because data stored in the UCSC Genome Browser Database is half-open and zero-start. The liftOver tool of the UCSC Genome Database accepts two different types of coordinate formatting: BED and position.
CD2 determines the expression of genes in humans, but not in every species. Each gene may have multiple transcripts, and different start codons. The "reverse" button flips the view so that you can see the opposite side of the codon. For instance, if the gene has different AAs, the left side of the screen will contain more than one transcript. The two transcripts that have the same start codon belong to the identical gene, however the right side is different frame.
You can also create a session to find the CD2 marker in your genome. This allows you to store various tracks and compare them. Once you have a session, you are able to share it with others. This will make your job easier and save you time. If you employ the tool to conduct your research, make sure to add verbose in order to ensure that the diagnostics are printed in full.
The callback function is called using three arguments that are a genome range, the chromosome's prefix, and the gene. The function performs interpolation and stores results in a dataframe that includes the gene, number markers, and the base pair range. The genotype matrix is comprised of the kernel burden as well as the p-values of each marker. It is available in binary IMPUTE2 BGEN format file.
Tracks are grouped in the 900 kb window which puts all browser tracks to similar levels of detection. The tracks are further classified according to their respective levels of detection. The browser shows a DNaseI Hypersensitivity Cluster track that is the sum of multiple individual tests. You can see each track individually within the browser. You can also view the DNaseI Hypersensitivity Clusters track in an entirely separate window.
PMID: 2894031 by Diamond D.J., et al. Exon-intron organization and sequence comparison of human and murine T11 (CD2) genes.
PMID: 2437578 by Seed B., et al. Molecular cloning of the CD2 antigen, the T-cell erythrocyte receptor, by a rapid immunoselection procedure.