CES1 / Liver carboxylesterase 1 · IHC design guide

Design Immunohistochemistry for CES1

Plan CES1 staining in paraffin sections using the cytoplasmic tissue pattern observed in hepatocytes and lung macrophages (HPA tissue IHC). Use that cell-level pattern to guide interpretation, and check epitope coverage across the 3 annotated isoforms (UniProt).

Evidence assembled Oct 2026 · For research use; verify linked source records and product datasheet before use
Immunohistochemistry protocol sheet for CES1 (IHC for CES1): expected localisation Cytoplasmic staining (HPA tissue IHC), antibody M01741-1, validated IHC image, and IHC protocol steps
Printable CES1 IHC protocol sheet — expected localisation Cytoplasmic staining (HPA tissue IHC), antibody M01741-1, controls and protocol steps. Open the full CES1 IHC guide →

CES1 Immunohistochemistry Experimental Design Guide

Expected localisation, validated protocols, controls and antibodies — the at-a-glance facts below, then the full design guide.

Must know before staining
Expected localisation Cytoplasmic staining (HPA tissue IHC)
Staining pattern Hepatocytes and lung macrophages show cytoplasmic staining (HPA tissue IHC)
Antigen retrieval EDTA pH 8.0 HIER, heat-mediated (datasheet M01741-1)
Positive control ⓘ Appendix+4 more · see all
Negative control ⓘ Bone marrow+4 more · see all
Important caveats
Reasons your staining may differ from the expected pattern.
Fixation Matched tissue-IHC evidence does not establish the fixation claim. Validate the specimen-specific method before use. (selected-SKU IHC image M01741-1)
Caveat Lung macrophages may complicate epithelial scoring (HPA tissue IHC)
Regulation Liver-enriched expression (HPA tissue IHC)
Isoform / epitope 3 isoforms; signal peptide 1–17 is cleaved; verify epitope (UniProt)
Section 1

Recommended CES1 IHC & IF Protocols

Compare the catalog antibody’s IHC-P protocol (datasheet M01741-1) with published CES1 staining in monkey cortex (PMC12879735) and mouse tissues (PMC9978993).

Recommended immunohistochemistry (IHC-P) protocol parameters
SampleParaffin-embedded human liver cancer tissue; fixative not specified (datasheet M01741-1)
FixationImage fixative and duration unreported (datasheet M01741-1); verify before use.
Sectioning4–5 µm sections on charged slides (standard)
DeparaffinisationXylene, graded ethanol series to water (standard)
Antigen retrievalHeat retrieval: EDTA pH 8.0 (datasheet M01741-1); 20 min, 95–100 °C (standard)
Peroxidase block3% H2O2, 10 min, room temperature (standard)
Blocking10% goat serum (datasheet M01741-1)
Primary antibodyMouse monoclonal (clone 3F10) anti-CES1, 2μg/ml (datasheet M01741-1)
Primary incubationOvernight at 4 °C (datasheet M01741-1)
DetectionStreptavidin-biotin complex (SABC), DAB chromogen (datasheet M01741-1)
CounterstainHematoxylin, blue, dehydrate and mount (standard)
Expected resultCES1-positive staining in endocrine cells of appendix (HPA tissue IHC: High). HPA tissue profile: Distinct cytoplasmic expression in liver and gall bladder as well as in lung and subsets of cells in gastrointestinal tract. No signal in the no-primary control.
💡Decision noteStart with heat-mediated EDTA pH 8.0 retrieval (datasheet M01741-1), then assess CES1 signal and background with appropriate controls (standard IHC practice).
Section 2

What Is the Expected CES1 Staining Pattern?

CES1 should show predominantly cytoplasmic staining in hepatocytes, gallbladder glandular cells, lung macrophages and selected respiratory or gastrointestinal cells (HPA tissue IHC: Enhanced; HPA: High in these cell types). Its main supported IF location is the endoplasmic reticulum (HPA subcellular ICC-IF), consistent with an ER luminal protein lacking a transmembrane segment (UniProt P23141 topology). Interpret focal lipid droplet association in the context of lipid loading (UniProt P23141 subcellular location).

What am I looking at on my slide?
Strong cytoplasmic chromogen in hepatocytes, with recognizable cell boundaries and little staining outside the expected cells.This is the clearest positive reference: liver hepatocytes are High, and the tissue IHC profile is Enhanced (HPA tissue IHC). Compare cell type and distribution as well as intensity; color alone cannot identify CES1 (general IHC practice).
Cytoplasmic staining in gallbladder glands, lung macrophages or selected respiratory and gastrointestinal cells.These are plausible additional positives, but staining should follow the named cell population: gallbladder glandular cells, lung macrophages, respiratory epithelial cells and gastrointestinal endocrine cells are High (HPA tissue IHC). A positive gland or immune cell does not imply every adjacent cell should stain (HPA tissue IHC).
Predominantly nuclear, sharply membranous or widespread extracellular staining replaces the expected cytoplasmic pattern.Treat this as a localisation mismatch and investigate artefact or antibody specificity (HPA tissue IHC; UniProt P23141 subcellular location; general IHC practice). CES1 is reported in the ER lumen, cytoplasm and lipid droplets, with no transmembrane segment (UniProt P23141 topology); a nuclear or surface pattern is not the expected positive call.
Prominent staining appears in cells recorded as not detected, such as bone marrow hematopoietic cells or heart cardiomyocytes.Check cell identification and detection controls before calling CES1 positive: these specific populations are Not detected by HPA tissue IHC. Cross-reactivity or endogenous chromogenic activity is possible (general IHC practice); HPA's observation is a reference pattern, not proof that every specimen must be negative.
A diffuse haze covers cells and extracellular spaces, or a liver positive control shows no convincing hepatocyte signal.Haze obscures the cell-specific pattern and may reflect nonspecific binding or detection background (general IHC practice). A blank liver control is discordant with High hepatocyte staining (HPA tissue IHC); review the staining run before interpreting other tissues as CES1-negative.
💡Expected CES1 appearanceCall a section positive when discrete, predominantly cytoplasmic staining is strong in hepatocytes or another HPA High cell population (HPA tissue IHC); broad extracellular, nuclear or wrong-cell staining is a warning pattern (UniProt P23141 subcellular location; HPA tissue IHC; general IHC practice).
How each factor affects the staining
Cell type and tissueLiver hepatocytes are High, as are gallbladder glandular cells and lung macrophages; gastrointestinal positives are specified endocrine-cell subsets (HPA tissue IHC). Score the relevant cells rather than averaging an entire section (general IHC practice).
Compartment and lipid stateER lumen and cytoplasm are reported locations; CES1 moves from cytoplasm to lipid droplets upon lipid loading (UniProt P23141 subcellular location). Lipid-associated signal can therefore vary with cell state, but that annotation does not predict a particular paraffin-section appearance.
Antibody evidenceThe HPA tissue profile is Enhanced, with high consistency between staining and RNA expression; HPA012023 and HPA046717 each have Enhanced IHC status (HPA tissue IHC; HPA antibodies). This supports the reference distribution, not every staining condition or a new antibody's specificity.
Processing and isoformsCES1 has a signal peptide at residues 1–17, a mature chain at 18–567, and 3 annotated isoforms (UniProt P23141 processing; isoforms). Epitope coverage cannot be inferred without the antibody's epitope, so do not assign a weak stain to processing or isoform choice alone.
IF/ICC comparisonThe separate IF/ICC question is: should CES1 fluorescence mark ER? Yes: ER is the supported main ICC-IF location, and HPA046717 has Supported ICC status (HPA subcellular ICC-IF; HPA antibodies). This informs localisation comparisons; it does not establish an IF protocol or an IHC retrieval condition.
Why is my staining missing, weak or wrong?
SituationLikely causeNext action
Liver hepatocytes are blank or unexpectedly faint.The result conflicts with High hepatocyte staining (HPA tissue IHC); an unsuccessful staining run or insufficient detection is possible (general IHC practice).Confirm tissue identity and inspect a known-positive liver control. Review the catalog antibody's IHC-P conditions, retrieval, reagent performance and chromogen development as general IHC checks; no CES1-specific retrieval effect is established here.
The whole section has brown haze, including spaces between cells.Diffuse signal can arise from nonspecific binding, residual detection reagent or chromogen background (general IHC practice). It does not match distinct cytoplasmic expression (HPA tissue IHC).Compare an appropriate no-primary control, review blocking and washes, and shorten excessive chromogen development if indicated (general IHC practice). Reassess only after cell boundaries and the positive-control pattern are readable.
Lung shows strong signal in many cells, but macrophages cannot be distinguished.HPA identifies lung macrophages as High; its profile also describes lung cytoplasmic expression (HPA tissue IHC). Unresolved cell identity prevents a confident cell-specific interpretation.Use section morphology and an appropriate cell-identification control to determine which cells carry signal (general IHC practice). Report the stained compartment and identified cell population, rather than calling the whole lung uniformly positive.
Bone marrow hematopoietic cells stain strongly.Those cells are Not detected in the supplied HPA tissue IHC record. Cross-reactivity or endogenous detection activity is possible (general IHC practice), but the stain alone cannot distinguish them.Check the no-primary and detection controls, then compare localisation and cell identity with a positive liver section (general IHC practice; HPA tissue IHC: High in hepatocytes). Treat the finding as unresolved if controls do not explain it.
Signal appears chiefly nuclear or along the plasma membrane.That distribution conflicts with HPA's cytoplasmic tissue profile and the reported ER-luminal, cytoplasmic and lipid-droplet locations (HPA tissue IHC; UniProt P23141 subcellular location).Recheck morphology, counterstain and control sections; compare a validated antibody's pattern if available (general IHC practice). Do not score the unexpected compartment as CES1 on location alone.
IF fluorescence appears punctate while paraffin IHC looks broadly cytoplasmic.CES1 can associate with lipid droplets after lipid loading, while ER is the supported main ICC-IF location (UniProt P23141 subcellular location; HPA subcellular ICC-IF). Different images need cell-state and compartment context.Evaluate the puncta against ER and lipid-droplet localisation with suitable reference markers as a general IF interpretation step. Use the separate IF/ICC guide for assay design; this comparison supplies no IF protocol or CES1-specific fixation claim.

Sample controls for CES1 IHC & IF

🧪Run gallbladder first: glandular cells should stain strongly (HPA: High in gallbladder glandular cells). Use cerebellum as the negative tissue, focusing on granular-layer cells (HPA: Not detected in cerebellar granular-layer cells); on the gallbladder slide, non-glandular stroma should show only background staining, but macrophages should not be treated as negative cells (UniProt P23141: macrophage expression).
Positive control tissue: Appendix (Endocrine cells, HPA High)
Negative control tissue: Bone marrow (HPA Not detected)
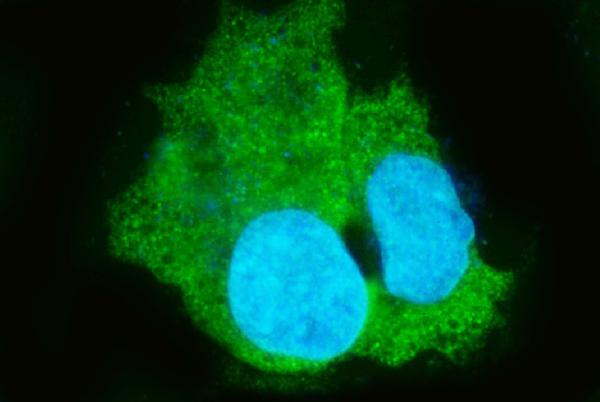
ICC-IF cell lines (HPA subcellular resource): HPA ICC-IF images show CES1 in A-549, Hep-G2, U2OS, with annotated localisation: Endoplasmic reticulum (supported) (HPA subcellular).
Technical controls: Include no-primary (secondary-only) and concentration-matched mouse IgG isotype controls for the mouse primary used in the selected protocol (caption: mouse primary antibody), plus CES1-knockout material as a biological negative where available. For chromogenic detection, quench endogenous peroxidase and assess endogenous biotin background because the selected protocol uses biotinylated secondary antibody, streptavidin–biotin complex and DAB (caption: SABC/DAB).
⚠️Feasibility: No target-specific fixation window or fixation effect is reported in the supplied evidence, and the selected M01741-1 paraffin-section caption does not state the fixative (caption: fixative unreported). Heat retrieval with EDTA at pH 8.0 was used in that liver-cancer example (caption: EDTA retrieval); whether retrieval is required for gallbladder or whether frozen sections or IF are easier is unreported. In gallbladder, distinguish endogenous bile pigment from brown DAB signal using morphology and the no-primary control (standard IHC practice).

HPA tissue IHC evidence for CES1

Comprehensive Human Protein Atlas IHC scoring per tissue (reliability: Enhanced — High consistency between antibody staining and RNA expression data.). Rows are taken directly from the HPA tissue chart — click any row's HPA link to view the source.

Positive expression · recommended positive controls

TissueCell typeLevelEvidenceSource
Appendix Endocrine cells High Protein (IHC) HPA →
Bronchus Respiratory epithelial cells High Protein (IHC) HPA →
Colon Endocrine cells High Protein (IHC) HPA →
Duodenum Endocrine cells High Protein (IHC) HPA →
Gallbladder Glandular cells High Protein (IHC) HPA →

Undetected expression · recommended negative controls

TissueCell typeLevelEvidenceSource
Bone marrow Hematopoietic cells Not detected Protein (IHC) HPA →
Caudate Glial cells Not detected Protein (IHC) HPA →
Cerebellum Cells in granular layer Not detected Protein (IHC) HPA →
Cerebral cortex Endothelial cells Not detected Protein (IHC) HPA →
Endometrium Cells in endometrial stroma Not detected Protein (IHC) HPA →
Section 3

Advanced CES1 IHC Tips

Troubleshoot CES1 staining in paraffin sections by checking retrieval, cell identity, intracellular pattern and controls before comparing chromogenic signal across samples.

Which retrieval condition should I try first for CES1 in paraffin sections?
Start with heat-mediated antigen retrieval in EDTA, pH 8.0, for the catalog antibody M01741-1 (datasheet M01741-1). The reported paraffin-section stain used that retrieval condition before incubation with 2 μg/mL primary antibody overnight at 4°C (datasheet M01741-1). If staining is weak, vary heating time on adjacent sections while holding antibody concentration and DAB development constant, and include a known positive liver section in each run (standard IHC practice; HPA: high in liver hepatocytes). If the documented condition still fails, compare another retrieval buffer on matched sections and assess both signal and tissue damage (standard IHC practice).
How should I assess whether fixation is affecting CES1 staining?
Target-specific fixation sensitivity is unknown: the selected paraffin-section caption does not state a fixative or fixation time (datasheet M01741-1). Record the fixative, processing interval and section thickness for every specimen, then compare matched sections under the same EDTA, pH 8.0 retrieval condition (standard IHC practice; datasheet M01741-1). Include a liver positive control and a no-primary control to distinguish weak staining from background introduced during processing (HPA: high in liver hepatocytes; standard IHC practice). If staining varies between batches, change one processing variable at a time while keeping the 2 μg/mL antibody condition fixed (datasheet M01741-1; standard IHC practice).
What intracellular CES1 pattern should I expect in chromogenic IHC?
Expect predominantly cytoplasmic staining in appropriate cells: tissue IHC reports distinct cytoplasmic expression, while subcellular evidence supports an endoplasmic-reticulum location (HPA: tissue IHC and subcellular). CES1 is described in the ER lumen and can associate with lipid droplets after lipid loading, so a granular or droplet-associated pattern may be biologically plausible when morphology supports it (UniProt P23141 localisation). Chromogenic sections generally cannot resolve the ER membrane from its lumen; assess the distribution across intact cells rather than assigning a precise membrane side from DAB alone (standard IHC practice). Compare hepatocytes and lung macrophages with their surrounding cells, using morphology to identify the stained population (HPA: high in liver hepatocytes and lung macrophages).
Could CES1 processing or isoforms explain discordant section staining?
CES1 has 3 reported isoforms, but the supplied catalog caption does not map this antibody’s epitope, so isoform coverage cannot be assigned from its staining image (UniProt P23141 isoforms; datasheet M01741-1). The precursor has a 1–17 signal peptide and a mature 18–567 chain; confirm whether any proposed epitope lies in retained sequence before comparing antibodies (UniProt P23141 processing). A glycosylation site at residue 79 and a reported phosphoserine at 380 are annotated, but their effect on this antibody’s tissue staining is unknown (UniProt P23141 modifications). Compare antibodies against documented distinct epitopes on adjacent sections, with identical retrieval and controls, if discordance persists (standard IHC practice).
How can IF help verify a disputed CES1 IHC pattern?
On the separate IF/ICC guide, multiplex CES1 with a marker identifying the expected cell population, such as hepatocytes in liver or macrophages in lung, and compare cell-level overlap (HPA: high in liver hepatocytes and lung macrophages; standard IF practice). Favor a red or far-red CES1 fluorophore when tissue autofluorescence obscures shorter wavelengths, and check unstained and single-stain controls before interpreting overlap (standard IF practice). CES1 is reported in the ER lumen and lacks a transmembrane segment, so use fixation-compatible permeabilisation to admit antibody to intracellular epitopes and assess whether the expected ER pattern remains intact (UniProt P23141 topology and localisation; standard IF practice). IF images exist for A-549, Hep-G2 and U2OS, providing context for pattern comparison rather than validation of this catalog antibody (HPA: subcellular).
How do I separate CES1 staining from chromogenic background?
Run a no-primary section alongside each staining batch, and compare its DAB deposit with the test section before calling faint cytoplasmic signal positive (standard IHC practice). The documented M01741-1 workflow uses a biotinylated secondary, streptavidin-biotin complex and DAB, so assess endogenous biotin and include a peroxidase block when using that detection system (datasheet M01741-1; standard IHC practice). Keep the documented 10% goat-serum block as the starting condition, then adjust blocking and washing only while retaining matched positive and no-primary controls (datasheet M01741-1; standard IHC practice). Evaluate background in cells expected to lack staining, such as bone-marrow hematopoietic cells, without assuming every cell in that tissue is negative (HPA: hematopoietic cells not detected; standard IHC practice).
How should I quantify CES1 across differently composed sections? ⚠ ANSWER MARKED FOR VERIFICATION
Score morphologically defined cell populations separately, recording the percentage of positive cells and staining intensity with a prespecified H-score rubric (standard IHC practice). Normalize each result to the number of evaluable cells in that population, or report positive-cell density per mm² when tissue area is the intended denominator (standard IHC practice). This matters when comparing liver hepatocytes with lung macrophages, because both are reported as high-expressing populations but occupy different tissue compartments (HPA: high in liver hepatocytes and lung macrophages). Apply the same EDTA, pH 8.0 retrieval, imaging settings, DAB development and scoring thresholds across sections, and exclude folds and necrotic regions by a recorded rule (datasheet M01741-1; standard IHC practice).
When is a CES1-positive cell or region likely to be artefactual?
Give most weight to staining in intact cells with a cytoplasmic pattern that fits the tissue context, such as hepatocytes in liver or macrophages in lung (HPA: tissue IHC). Be cautious with isolated nuclear or crisp surface-only signal because CES1 is reported in the ER lumen, cytoplasm and lipid droplets, with no transmembrane segment annotated (UniProt P23141 topology and localisation). Compare suspicious staining at section edges, folds and necrotic areas with the adjacent intact tissue, and inspect the no-primary control for DAB deposited by the detection workflow (standard IHC practice). Strong staining in an unexpected cell population warrants morphology review and an independent antibody or orthogonal expression check before assigning CES1 identity (standard IHC practice).
Boster reagents

Best CES1 / Liver carboxylesterase 1 IHC Antibodies

Both CES1 antibodies have IHC data from paraffin sections and IF/ICC data from HepG2 cells; catalog reactivity includes human, mouse and rat (catalog images and reactivity).

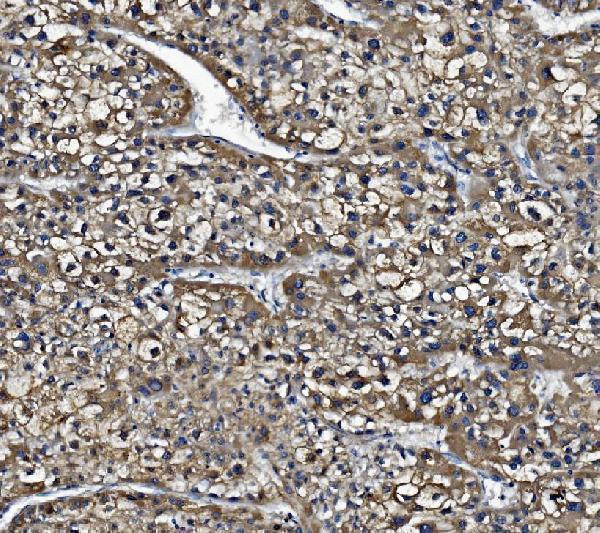
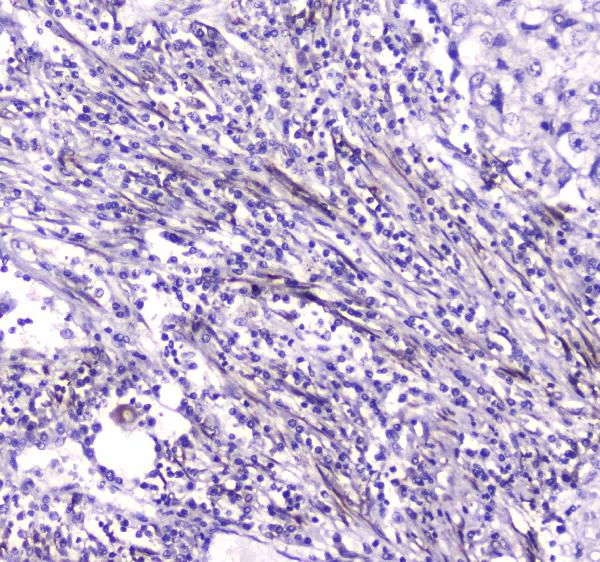
Real IHC data IHC analysis of Liver Carboxylesterase 1/CES1 using anti-Liver Carboxylesterase 1/CES1 antibody (M01741-1). Liver Carboxylesterase 1/CES1 was detected in paraffin-embedded section of human liver cancer tissue. Heat mediated antigen retrieval was performed in EDTA buffer (pH8.0, epitope retrieval solution). The tissue section was blocked with 10% goat serum. The tissue section was then incubated with 2μg/ml mouse anti-Liver Carboxylesterase 1/CES1 Antibody (M01741-1) overnight at 4°C. Biotinylated goat anti-mouse IgG was used as secondary antibody and incubated for 30 minutes at 37°C. The tissue section was developed using Strepavidin-Biotin-Complex (SABC) (Catalog # SA1021) with DAB as the chromogen.
Anti-Liver Carboxylesterase 1/CES1 Antibody ® (monoclonal, 3F10)
Cat # M01741-1
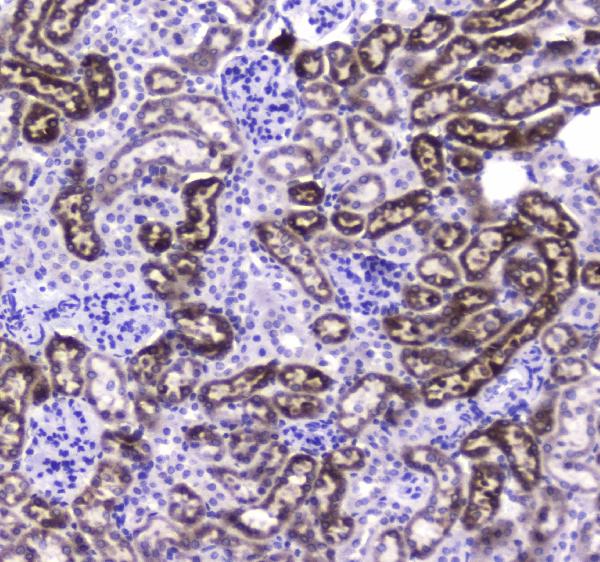
Real IHC data IHC analysis of CES1 using anti-CES1 antibody (A01741-1). CES1 was detected in paraffin-embedded section of mouse kidney tissue . Heat mediated antigen retrieval was performed in citrate buffer (pH6, epitope retrieval solution) for 20 mins. The tissue section was blocked with 10% goat serum. The tissue section was then incubated with 1μg/ml rabbit anti-CES1 Antibody (A01741-1) overnight at 4°C. Biotinylated goat anti-rabbit IgG was used as secondary antibody and incubated for 30 minutes at 37°C. The tissue section was developed using Strepavidin-Biotin-Complex (SABC)(Catalog # SA1022) with DAB as the chromogen.
Anti-Liver Carboxylesterase 1/CES1 Antibody ®
Cat # A01741-1

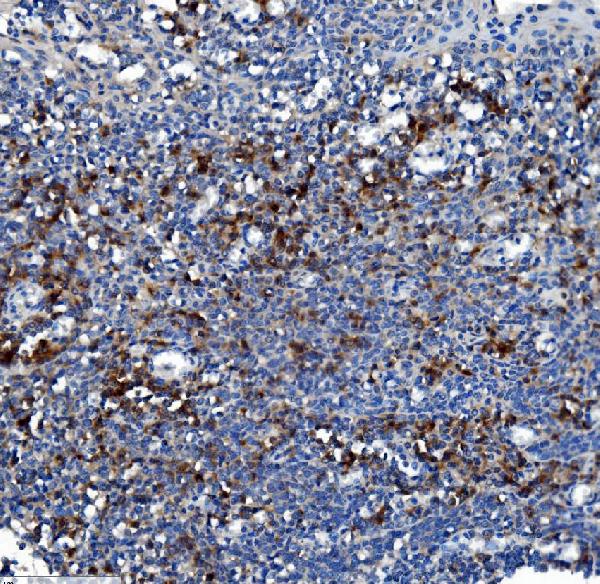
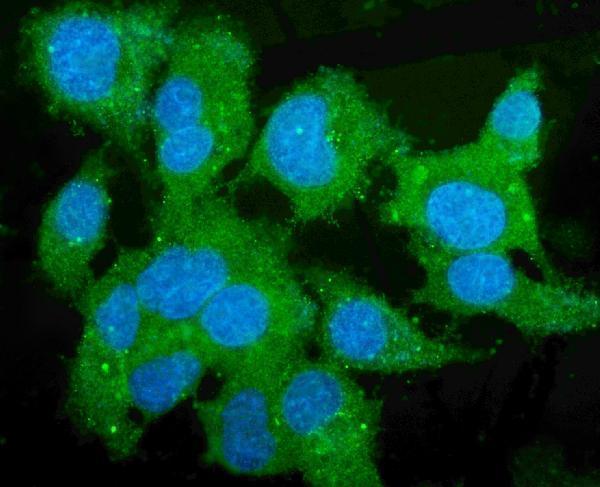
M01741-1 has IHC images from human liver cancer, tonsil and prostate cancer sections and mouse lung sections, plus IF/ICC data from HepG2 cells (M01741-1 image captions). A01741-1 has IHC images from mouse kidney, human lung cancer, mouse lung and rat lung sections, plus IF/ICC data from HepG2 cells (A01741-1 image captions).

Which to pick: For tissue IHC, M01741-1 is a monoclonal option shown on paraffin sections after EDTA retrieval at pH 8.0; A01741-1 is shown on paraffin sections after citrate retrieval at pH 6 (catalog clone; M01741-1 and A01741-1 IHC captions). For IF/ICC, either SKU has HepG2 cell data, with 5 μg/mL primary antibody used in each caption (catalog IF captions). For cross-species IHC, A01741-1 has pictured human, mouse and rat sections, while M01741-1 has pictured human and mouse sections; both list human, mouse and rat reactivity, and neither IHC caption reports the fixative (catalog IHC captions and reactivity).

Each figure is that product's own IHC / IF validation image from its datasheet.

References

  1. UniProt Consortium. UniProt entry P23141 (EST1_HUMAN, Liver carboxylesterase 1).
  2. Human Protein Atlas. CES1 tissue IHC expression (reliability: Enhanced).
  3. Human Protein Atlas. CES1 subcellular location (ICC-IF): Localized to the endoplasmic reticulum..
  4. Human Protein Atlas. CES1 antibody validation summary (2 antibodies).
  5. CCL17-neutralizing and esterase-responsive core-shell microgels for endogenous Tregs recruitment and functional enhancement in myocardial infarction. Bioactive materials 2026 — PMC13292248.
  6. Ester Prodrug NLRP3 Inflammasome Inhibitor NT-0796 is Brain Active due to Activation by Local Expression of Carboxylesterase-1. ACS chemical neuroscience 2026 — PMC12879735.
  7. Nicotine-induced CHRNA5 activation modulates CES1 expression, impacting head and neck squamous cell carcinoma recurrence and metastasis via MEK/ERK pathway. Cell death & disease 2024 — PMC11522702.
  8. Carboxylesterase 1 family knockout alters drug disposition and lipid metabolism. Acta pharmaceutica Sinica. B 2023 — PMC9978993.
  9. PubMed PMID:1918003 — UniProt-cited evidence.
  10. PubMed PMID:8218228 — UniProt-cited evidence.
  11. PubMed PMID:8406473 — UniProt-cited evidence.