CES2 / Cocaine esterase · IHC design guide

Design Immunohistochemistry for CES2

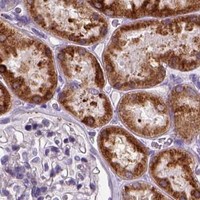
CES2 IHC shows granular cytoplasmic staining in hepatocytes, renal tubules and gastrointestinal tissue (HPA tissue IHC). This guide covers the catalog antibody’s IHC-P conditions (datasheet A02868-2) and cell-specific scoring (standard IHC practice).

Evidence assembled Oct 2026 · For research use; verify linked source records and product datasheet before use
Immunohistochemistry protocol sheet for CES2 (IHC for CES2): expected localisation Granular cytoplasmic staining (HPA tissue IHC), antibody A02868-2, validated IHC image, and IHC protocol steps
Printable CES2 IHC protocol sheet — expected localisation Granular cytoplasmic staining (HPA tissue IHC), antibody A02868-2, controls and protocol steps. Open the full CES2 IHC guide →

CES2 Immunohistochemistry Experimental Design Guide

Expected localisation, validated protocols, controls and antibodies — the at-a-glance facts below, then the full design guide.

Must know before staining
Expected localisation Granular cytoplasmic staining (HPA tissue IHC)
Staining pattern Granular cytoplasm in hepatocytes and gut endocrine cells (HPA tissue IHC)
Antigen retrieval EDTA pH 8.0 HIER, heat-mediated (datasheet A02868-2)
Positive control ⓘ Colon+4 more · see all
Negative control ⓘ Adipose tissue+4 more · see all
Important caveats
Reasons your staining may differ from the expected pattern.
Fixation Keep fixation consistent across sections (standard IHC practice; not target-specific)
Caveat Hepatic endogenous peroxidase may mimic DAB signal (standard IHC practice)
Regulation Intestine enriched; liver moderate (UniProt)
Isoform / epitope 4 isoforms; signal peptide 1–26 is removed (UniProt)
Section 1

Recommended CES2 IHC & IF Protocols

Compare the catalog antibody’s paraffin IHC protocol (datasheet A02868-2) with three published CES2 IHC methods (PMC6416336; PMC4200864; PMC11845761).

Recommended immunohistochemistry (IHC-P) protocol parameters
SampleParaffin-embedded human liver cancer tissue; fixative not specified (datasheet A02868-2)
FixationImage fixative and duration unreported (datasheet A02868-2); verify before use.
Sectioning4–5 µm sections on charged slides (standard)
DeparaffinisationXylene, graded ethanol series to water (standard)
Antigen retrievalHeat retrieval: EDTA pH 8.0 (datasheet A02868-2); 20 min, 95–100 °C (standard)
Peroxidase block3% H2O2, 10 min, room temperature (standard)
Blocking10% goat serum (datasheet A02868-2)
Primary antibodyRabbit anti-CES2, 2-5 μg/ml (datasheet A02868-2)
Primary incubationOvernight at 4 °C (datasheet A02868-2)
DetectionHRP-conjugated secondary, DAB chromogen (datasheet A02868-2)
CounterstainHematoxylin, blue, dehydrate and mount (standard)
Expected resultCES2-positive staining in endocrine cells of colon (HPA tissue IHC: High). HPA tissue profile: Granular cytoplasmic expression in several tissues including liver, renal tubules and gastrointestinal tract. No signal in the no-primary control.
💡Decision noteStart with heat-mediated EDTA pH 8.0 retrieval (datasheet A02868-2). For the colorectal protocol, evaluate 0.01 M citrate pH 6.0 in a water bath (PMC4200864).
Section 2

What Is the Expected CES2 Staining Pattern?

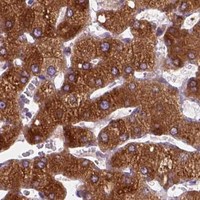
CES2 is an endoplasmic reticulum lumen protein with no transmembrane segment (UniProt O00748 topology). In paraffin section IHC, expect granular cytoplasmic staining in hepatocytes, renal tubular cells and gastrointestinal endocrine cells (HPA: tissue IHC profile; High in these cells). HPA rates the tissue pattern Enhanced, citing agreement between antibody staining and RNA expression (HPA: tissue IHC reliability).

What am I looking at on my slide?
Granular cytoplasmic chromogen appears in hepatocytes, renal tubular cells or intestinal endocrine cells.This matches the reported CES2 tissue pattern (HPA: granular cytoplasmic profile; High in liver hepatocytes, kidney tubular cells and intestinal endocrine cells). Score the relevant cell population separately from surrounding tissue; a whole-section average can obscure cell-restricted staining (general IHC practice).
The dominant signal is confined to nuclei, cell borders or extracellular material.That compartment conflicts with the granular cytoplasmic tissue pattern (HPA: tissue IHC profile) and the annotated ER lumen location (UniProt O00748 subcellular location). Treat it as suspect; inspect a known-positive section and the detection-only control before assigning it to CES2 (general IHC practice).
Strong staining occurs chiefly in adipocytes while expected positive cells are weak.Adipocytes are reported as Not detected in adipose tissue (HPA: adipose tissue IHC), whereas hepatocytes and renal tubular cells are High (HPA: liver and kidney IHC). Cross-reactivity or endogenous detection activity is possible, not established; compare primary-omission and positive-tissue controls (general IHC practice).
A smooth chromogenic haze spans many cell types and obscures their boundaries.Widespread haze is difficult to reconcile with the reported granular, cell-associated pattern (HPA: tissue IHC profile). Check the primary-omission control, blocking, washes and detection exposure for nonspecific background (general IHC practice); the appearance alone does not identify its cause.
No stain appears in a liver or kidney section expected to contain positive cells.HPA reports High staining in hepatocytes and renal tubular cells (HPA: liver and kidney IHC). Confirm that those cells are present, then review the catalog antibody's IHC-P conditions and run the detection controls (general IHC practice). Absence alone cannot establish biological loss of CES2.
💡Expected CES2 appearanceCall a section positive when hepatocytes, renal tubular cells or intestinal endocrine cells show clearly cell-associated granular cytoplasmic staining at a level consistent with HPA's High designation (HPA: tissue IHC); dominant nuclear staining or uniform haze is suspect against that pattern (HPA: tissue IHC profile).
How each factor affects the staining
Cell population and tissue choiceSelect the cells to score before judging a section: HPA reports High staining in small-intestinal, duodenal and colonic endocrine cells, hepatocytes and renal tubular cells (HPA: tissue IHC). UniProt describes preferential intestinal expression, highest in small intestine, with moderate liver expression (UniProt O00748 tissue specificity). These descriptions use different measures; do not turn them into a fixed IHC intensity ranking.
Protein location and processingCES2 is annotated in the ER lumen, without a transmembrane segment; its signal peptide spans residues 1–26 and the annotated chain spans 27–559 (UniProt O00748 topology and processing). These facts support an intracellular interpretation, but they do not identify the catalog antibody's epitope or predict its retrieval response.
Antibody validationHPA lists IHC as Enhanced for 2 antibodies, HPA018897 and HPA074629 (HPA: antibody validation). Its tissue-level Enhanced rating reflects agreement between staining and RNA expression (HPA: tissue IHC reliability). These ratings support the reported pattern; they do not validate every antibody or every staining condition.
IF/ICC Q: Must fluorescence reproduce the paraffin-section pattern?HPA reports mainly Golgi localization in ICC-IF, with additional ER and cytosol signal (HPA: subcellular ICC-IF), while tissue IHC is described as granular cytoplasmic (HPA: tissue IHC profile). Compare results within their own application and resolution. HPA018897 has IHC Enhanced but ICC Uncertain; HPA074629 has no ICC rating listed (HPA: antibody validation).
Why is my staining missing, weak or wrong?
SituationLikely causeNext action
Known-positive hepatocytes or renal tubular cells have no visible chromogen.A failed staining or detection step is possible; those cells are reported High (HPA: liver and kidney IHC). The supplied sources do not establish CES2-specific fixation sensitivity.Check tissue identity and run an established positive section. Review the catalog antibody's IHC-P instructions for retrieval, dilution and detection, then check reagent and incubation steps (general IHC practice).
Signal is diffuse across nearly every cell and the surrounding section.Nonspecific primary or detection background is possible; the reported tissue pattern is granular cytoplasmic (HPA: tissue IHC profile). Appearance alone cannot distinguish these mechanisms.Compare a primary-omission control with the stained section. Review blocking, washes and chromogen development, adjusting only the step implicated by that comparison (general IHC practice).
A negative comparison area, such as adipocytes, stains strongly.HPA reports adipocytes as Not detected in adipose tissue (HPA: adipose tissue IHC). Cross-reactivity or endogenous detection activity could account for discordant staining.Check a primary-omission control and compare the same run with known-positive cells. If staining persists without primary antibody, investigate the detection system (general IHC practice).
Only nuclei or cell borders stain in a putative positive tissue.The dominant location disagrees with HPA's granular cytoplasmic IHC pattern (HPA: tissue IHC profile) and UniProt's ER lumen annotation (UniProt O00748 subcellular location).Recheck morphology and compartment assignment against a positive section; review primary-omission and detection controls before scoring that signal as CES2 (general IHC practice).
A gastrointestinal section looks weak despite an expected positive result.The scored area may miss endocrine cells: HPA specifies High staining in intestinal endocrine cells (HPA: small intestine, duodenum and colon IHC). A whole-mucosa estimate can dilute a cell-specific observation (general IHC practice).Locate and score the relevant cell population on the section, then compare it with a positive control from the same run (general IHC practice).
ICC-IF appears Golgi dominant while paraffin-section IHC appears granular cytoplasmic.Both descriptions occur in the supplied records: Golgi dominant with additional ER and cytosol in ICC-IF (HPA: subcellular ICC-IF), and granular cytoplasmic in tissue IHC (HPA: tissue IHC profile).Interpret each application against its own HPA reference. Check the antibody's application-specific validation before treating the difference as a staining failure (HPA: antibody validation; general IHC/IF practice).

Sample controls for CES2 IHC & IF

🧪Run liver first and expect hepatocytes to stain (HPA: High in liver hepatocytes). Use adipose tissue adipocytes as the negative tissue (HPA: Not detected in adipocytes); on the liver slide, assess background in cells without visible staining, but do not assume a particular non-hepatocyte cell type is CES2-negative from these rows alone.
Positive control tissue: Colon (Endocrine cells, HPA High)
Negative control tissue: Adipose tissue (HPA Not detected)
ICC-IF cell lines (HPA subcellular resource): HPA ICC-IF images show CES2 in A-431, SiHa, U2OS, with annotated localisation: Golgi apparatus (approved) (HPA subcellular).
Technical controls: Include no-primary (secondary-only), a concentration-matched rabbit IgG isotype control matched to the primary antibody’s clonality, and a CES2 knockout biological control if available (selected-SKU caption: rabbit anti-CES2 primary). Quench endogenous peroxidase in liver sections before HRP/DAB detection (selected-SKU caption: liver section with peroxidase secondary and DAB; standard IHC practice).
⚠️Feasibility: The selected-SKU paraffin-section caption uses heat-mediated EDTA retrieval at pH 8.0, but does not establish whether retrieval is required for CES2 across specimens (selected-SKU tissue-IHC caption). The fixative and a CES2-specific fixation window or fixation effect are unreported (selected-SKU tissue-IHC caption). HPA has ICC-IF images, but the supplied evidence does not establish that IF or frozen sections are easier; liver’s endogenous peroxidase is a practical concern for the caption’s HRP/DAB detection (HPA: CES2 subcellular ICC-IF images; selected-SKU tissue-IHC caption; standard IHC practice).

HPA tissue IHC evidence for CES2

Comprehensive Human Protein Atlas IHC scoring per tissue (reliability: Enhanced — High consistency between antibody staining and RNA expression data.). Rows are taken directly from the HPA tissue chart — click any row's HPA link to view the source.

Positive expression · recommended positive controls

TissueCell typeLevelEvidenceSource
Colon Endocrine cells High Protein (IHC) HPA →
Duodenum Endocrine cells High Protein (IHC) HPA →
Kidney Cells in tubules High Protein (IHC) HPA →
Liver Hepatocytes High Protein (IHC) HPA →
Lung Alveolar cells type I High Protein (IHC) HPA →

Undetected expression · recommended negative controls

TissueCell typeLevelEvidenceSource
Adipose tissue Adipocytes Not detected Protein (IHC) HPA →
Bone marrow Hematopoietic cells Not detected Protein (IHC) HPA →
Breast Adipocytes Not detected Protein (IHC) HPA →
Caudate Glial cells Not detected Protein (IHC) HPA →
Cerebellum Cells in granular layer Not detected Protein (IHC) HPA →
Section 3

Advanced CES2 IHC Tips

Troubleshoot CES2 staining in paraffin sections by checking retrieval, tissue preservation, cellular pattern and controls before interpreting DAB signal.

How should I optimize retrieval when CES2 staining is weak?
Start with heat-mediated retrieval in EDTA at pH 8.0 for paraffin sections (datasheet A02868-2). Compare shorter and longer heating on adjacent sections while keeping cooling and washes consistent; the caption gives no retrieval duration (datasheet A02868-2; standard IHC practice). Reproduce 2 μg/ml primary incubation overnight at 4°C before changing antibody concentration (datasheet A02868-2). If staining remains weak, test citrate at pH 6.0 as a fallback on matched sections, checking morphology and no-primary controls (standard IHC practice). Judge improvement by granular cytoplasmic signal in hepatocytes, rather than stronger staining at section edges (HPA: granular cytoplasmic profile; HPA: hepatocytes High; standard IHC practice).
What can I conclude about fixation when CES2 signal varies among paraffin blocks?
The selected human liver cancer caption describes a paraffin section but gives no fixative, so CES2-specific fixation sensitivity is unknown (datasheet A02868-2). CES2 topology, glycosylation and HPA staining patterns cannot establish whether fixation caused a weak result (UniProt O00748 topology and glycosylation; HPA tissue IHC). Compare blocks with documented fixation histories while holding EDTA retrieval at pH 8.0 and primary concentration at 2 μg/ml constant (datasheet A02868-2; standard IHC practice). Check morphology and hepatocyte staining within each section before adjusting retrieval (HPA: hepatocytes High; standard IHC practice). Record fixation duration and processing history alongside no-primary controls for the comparison (standard IHC practice).
Should CES2 appear in the ER or Golgi on chromogenic sections?
Expect a granular cytoplasmic IHC pattern in several tissues, including liver and gastrointestinal tract (HPA: tissue IHC profile). CES2 is annotated as an ER luminal protein without a transmembrane segment, while cellular imaging places it mainly in Golgi and additionally in ER and cytosol (UniProt O00748 subcellular location and topology; HPA subcellular). DAB microscopy cannot reliably assign individual granules to those compartments, so describe the visible pattern as cytoplasmic (standard IHC practice). Compare staining in hepatocytes or intestinal endocrine cells with neighboring cells and a no-primary section (HPA: hepatocytes High; HPA: intestinal endocrine cells High; standard IHC practice). Investigate predominantly nuclear staining before calling it CES2 (UniProt O00748 subcellular location; HPA subcellular; standard IHC practice).
Could CES2 isoforms or processing explain inconsistent IHC staining?
CES2 has 4 annotated isoforms, but the supplied caption does not identify the antibody epitope or establish isoform coverage (UniProt O00748 isoforms; datasheet A02868-2). The precursor has a signal peptide at residues 1–26 and a reported chain spanning 27–559, so an epitope near processing sites warrants particular scrutiny (UniProt O00748 processing). Glycosylation is annotated at residues 111 and 276; its effect on this antibody's IHC staining is unknown (UniProt O00748 glycosylation; datasheet A02868-2). Request epitope information before interpreting discordant sections as isoform differences (standard IHC practice). Compare staining with an independent antibody or RNA measurement in matched regions if available (standard IHC practice).
How can IF help investigate an ambiguous CES2 DAB pattern?
Use IF as a separate comparison to the paraffin DAB assay; the selected caption establishes a tissue IHC procedure, not IF performance (datasheet A02868-2). Multiplex CES2 with a marker identifying the expected cells, such as hepatocytes in liver, and assess the signals within the same cells (HPA: hepatocytes High; standard IF practice). Choose spectrally separated fluorophores and favor a far-red channel when tissue autofluorescence obscures shorter wavelengths (standard IF practice). Because CES2 is annotated in the ER lumen without a transmembrane segment, pilot mild detergent permeabilisation and compare it with reduced permeabilisation for the chosen antibody epitope (UniProt O00748 topology and subcellular location; standard IF practice). Include single-stain and no-primary controls when assessing overlap (standard IF practice).
What should I change when CES2 DAB staining looks diffuse or widespread?
First compare the stained section with a no-primary control and inspect whether DAB persists around damaged tissue or section edges (standard IHC practice). The selected procedure used 10% goat serum blocking, 2 μg/ml primary overnight at 4°C, and a peroxidase-linked detection system with DAB (datasheet A02868-2). Reproduce those conditions before titrating primary antibody or changing wash stringency (datasheet A02868-2; standard IHC practice). Include an endogenous peroxidase block as a general DAB workflow step, especially if the no-primary section develops color (standard IHC practice). Look for granular cytoplasmic enrichment in expected cells rather than uniform haze (HPA: tissue IHC profile; standard IHC practice).
How should I score heterogeneous CES2 staining in a paraffin section? ⚠ ANSWER MARKED FOR VERIFICATION
Define tissue regions and cell classes before scoring, since CES2 staining varies by cell type (HPA: tissue IHC profile). For hepatocytes or intestinal endocrine cells, report the percentage positive and an H-score from 0–300, using intensity grades 0–3 (HPA: hepatocytes High; HPA: intestinal endocrine cells High; standard IHC practice). Normalize positive counts or DAB area to the number of eligible cells or tissue area in mm², and use the same threshold across matched sections (standard IHC practice). Exclude folds, necrosis and section edges using rules set before scoring (standard IHC practice). Keep stromal and epithelial measurements separate, and report no-primary background alongside the score (standard IHC practice).
How do I distinguish true CES2 staining from artefact?
A credible result shows granular cytoplasmic enrichment in an expected cell population, such as hepatocytes or intestinal endocrine cells (HPA: granular cytoplasmic profile; HPA: hepatocytes High; HPA: intestinal endocrine cells High). Predominantly nuclear color conflicts with the reported ER, Golgi and cytosolic locations and needs independent confirmation (UniProt O00748 subcellular location; HPA subcellular). Compare intact tissue interiors with edges and necrotic areas, where staining artefacts can mislead interpretation (standard IHC practice). Color in a no-primary section suggests background from the detection workflow, including possible endogenous peroxidase, rather than antibody-dependent CES2 staining (standard IHC practice). A convincing change should persist across comparable sections with the same EDTA pH 8.0 retrieval (datasheet A02868-2; standard IHC practice).
Boster reagents

Best CES2 / Cocaine esterase IHC Antibodies

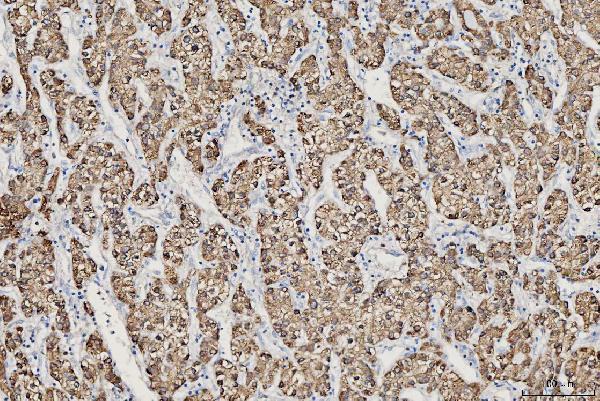
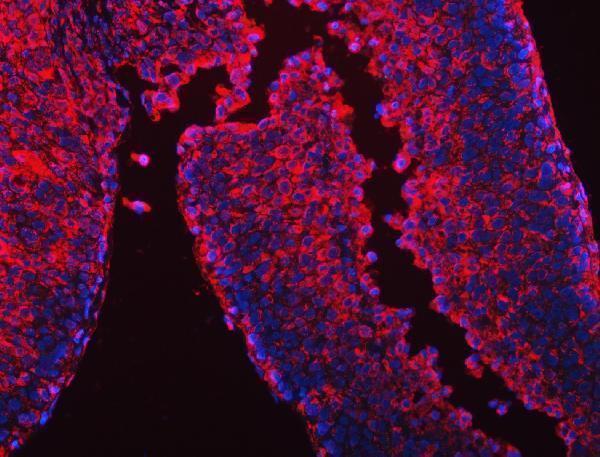
Two anti-CES2 antibodies have human paraffin-section IHC images (catalog IHC captions: A02868-1, A02868-2). A02868-2 also has human paraffin-section IF data and lists mouse reactivity (catalog IF caption and reactivity).

Real IHC data IHC analysis of CES2 using anti-CES2 antibody (A02868-2). CES2 was detected in a paraffin-embedded section of human liver cancer tissue. Heat mediated antigen retrieval was performed in EDTA buffer (pH 8.0, epitope retrieval solution). The tissue section was blocked with 10% goat serum. The tissue section was then incubated with 2 μg/ml rabbit anti-CES2 Antibody (A02868-2) overnight at 4°C. Peroxidase Conjugated Goat Anti-rabbit IgG was used as secondary antibody and incubated for 30 minutes at 37°C. The tissue section was developed using HRP Conjugated Rabbit IgG Super Vision Assay Kit (Catalog # SV0002) with DAB as the chromogen.
Anti-CES2 Antibody ®
Cat # A02868-2
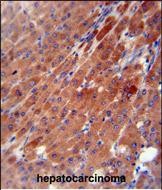
Real IHC data CES2 antibody (Center) (Cat. #A02868-1) immunohistochemistry analysis in formalin fixed and paraffin embedded human hepatocarcinoma followed by peroxidase conjugation of the secondary antibody and DAB staining. This data demonstrates the use of the CES2 antibody (Center) for immunohistochemistry. Clinical relevance has not been evaluated.
Anti-CES2 Antibody (Center)
Cat # A02868-1

A02868-1 has an IHC image from formalin-fixed, paraffin-embedded human hepatocarcinoma (A02868-1 IHC caption). A02868-2 has IHC and IF images from paraffin-embedded human liver cancer tissue; its fixative is unreported (A02868-2 IHC and IF captions).

Which to pick: For human tissue IHC, choose A02868-1 when a paraffin-section, paraffin-embedded example is useful (A02868-1 IHC caption), or A02868-2 for an example using EDTA retrieval at pH 8.0 and 2 μg/ml primary antibody; its fixative is unreported (A02868-2 IHC caption). For IF, choose A02868-2, which has a human paraffin-section IF image at 5 μg/ml; ICC validation is unreported (A02868-2 IF caption and applications). For mouse work, A02868-2 lists mouse reactivity, but its supplied IHC and IF images use human tissue (A02868-2 reactivity and image captions). The selected A02868-2 tissue-IHC caption documents paraffin sections, but does not specify the fixative (selected-SKU IHC image A02868-2).

Each figure is that product's own IHC / IF validation image from its datasheet.

References

  1. UniProt Consortium. UniProt entry O00748 (EST2_HUMAN, Cocaine esterase).
  2. Human Protein Atlas. CES2 tissue IHC expression (reliability: Enhanced).
  3. Human Protein Atlas. CES2 subcellular location (ICC-IF): Mainly localized to the Golgi apparatus. In addition localized to the endoplasmic reticulum and cytosol..
  4. Human Protein Atlas. CES2 antibody validation summary (2 antibodies).
  5. Prognostic Impact of Carboxylesterase 2 in Cholangiocarcinoma. Scientific reports 2019 — PMC6416336.
  6. CES2, ABCG2, TS and Topo-I primary and synchronous metastasis expression and clinical outcome in metastatic colorectal cancer patients treated with first-line FOLFIRI regimen. International journal of molecular sciences 2014 — PMC4200864.
  7. Efficacy and Safety of CAP7.1 as Second-Line Treatment for Advanced Biliary Tract Cancers: Data from a Randomised Phase II Study. Cancers 2020 — PMC7692271.
  8. Intestinal human carboxylesterase 2 (CES2) expression rescues drug metabolism and most metabolic syndrome phenotypes in global Ces2 cluster knockout mice. Acta pharmacologica Sinica 2025 — PMC11845761.
  9. PubMed PMID:9144407 — UniProt-cited evidence.
  10. PubMed PMID:9169443 — UniProt-cited evidence.
  11. PubMed PMID:14702039 — UniProt-cited evidence.