This website uses cookies to ensure you get the best experience on our website.


- Table of Contents
Plan CLTC IHC on paraffin sections using the catalog antibody at 1:50 (datasheet M03134) and assess cytoplasmic and membranous staining (HPA tissue IHC). Parathyroid glandular cells and placental trophoblasts provide high-staining references (HPA tissue IHC); compare cell types using a matched negative control (standard IHC practice).

Expected localisation, validated protocols, controls and antibodies — the at-a-glance facts below, then the full design guide.
| Expected localisation | Cytoplasmic and membranous tissue staining (HPA tissue IHC) | |
| Staining pattern | General cytoplasmic/membranous staining; parathyroid glandular cells high (HPA tissue IHC) | |
| Antigen retrieval | EDTA pH 8.0 HIER, heat-mediated (datasheet M03134) | |
| Positive control | Parathyroid gland+4 more · see all | |
| Negative control | Adipose tissue+3 more · see all |
| Fixation | Matched tissue-IHC evidence does not establish the fixation claim. Validate the specimen-specific method before use. (selected-SKU IHC image M03134) | |
| Caveat | Broad expression does not mean every cell stains; adipocytes are negative (HPA tissue IHC) | |
| Regulation | No expression regulator annotated (UniProt) | |
| Isoform / epitope | 2 isoforms; no extracellular domain; epitope variation unknown (UniProt) |
The catalog antibody has an IHC-P protocol (datasheet M03134). The published option below describes chromogenic CLTC staining in clinical breast cancer tissues (PMC4284514).
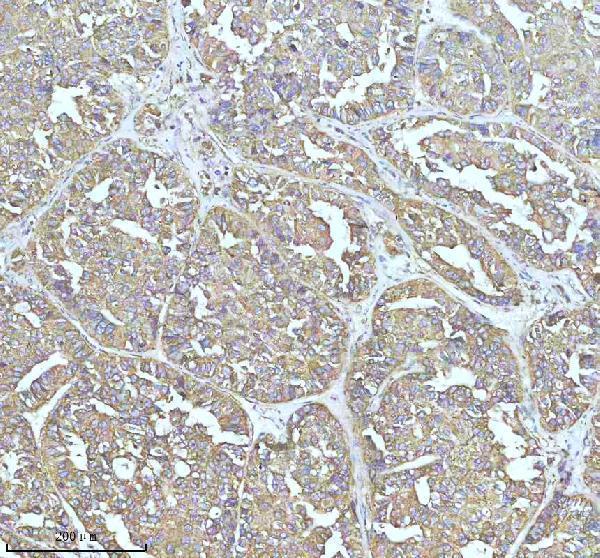
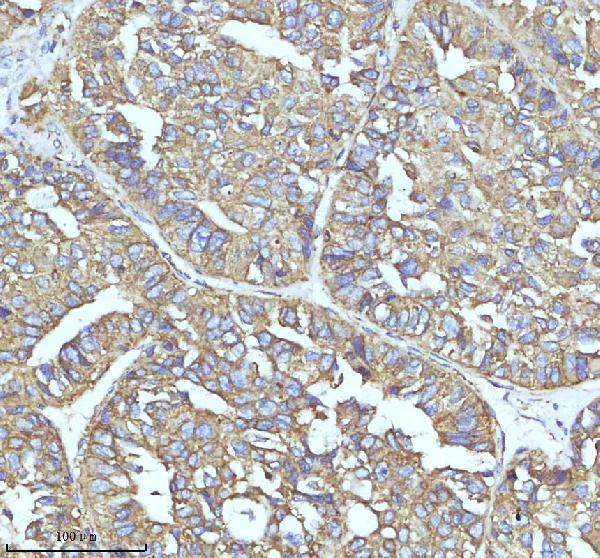
| Sample | Paraffin-embedded human liver cancer tissue; fixative not specified (datasheet M03134) |
| Fixation | Image fixative and duration unreported (datasheet M03134); verify before use. |
| Sectioning | 4–5 µm sections on charged slides (standard) |
| Deparaffinisation | Xylene, graded ethanol series to water (standard) |
| Antigen retrieval | Heat retrieval: EDTA pH 8.0 (datasheet M03134); 20 min, 95–100 °C (standard) |
| Peroxidase block | 3% H2O2, 10 min, room temperature (standard) |
| Blocking | 10% goat serum (datasheet M03134) |
| Primary antibody | Rabbit monoclonal (clone ABDH-3) anti-CLTC, 1:50 (datasheet M03134) |
| Primary incubation | Overnight at 4 °C (datasheet M03134) |
| Detection | HRP-conjugated secondary, DAB chromogen (datasheet M03134) |
| Counterstain | Hematoxylin, blue, dehydrate and mount (standard) |
| Expected result | CLTC-positive staining in glandular cells of parathyroid gland (HPA tissue IHC: High). HPA tissue profile: General cytoplasmic and membranous expression. No signal in the no-primary control. |
CLTC should show cytoplasmic and membranous staining, especially in parathyroid glandular cells and placental trophoblasts, where HPA reports high staining (HPA: tissue IHC). CLTC sits on the cytoplasmic face of coated pits and vesicles and has no transmembrane segment (UniProt Q00610: localization, topology). The HPA tissue profile is Approved, with medium consistency between staining and RNA expression (HPA: reliability).
| Cytoplasmic and membranous signal in parathyroid glandular cells or placental trophoblasts. | This matches the reported high staining in these cell populations (HPA: tissue IHC). Score the signal in the named cells and its compartment, rather than treating an entire section as uniformly positive. A cytoplasmic or membrane-associated pattern is consistent with CLTC on the cytoplasmic face of coated pits and vesicles (UniProt Q00610: localization). |
| Moderate cytoplasmic or membranous staining in other listed positive cells. | Medium staining is reported in adrenal, appendix and breast glandular cells; bronchial respiratory epithelial cells; bone marrow hematopoietic cells; and caudate neuronal cells (HPA: tissue IHC). These can support interpretation, but their reported intensity is below that of the high-staining parathyroid and placental populations (HPA: tissue IHC). Compare like cell populations when scoring. |
| Predominantly nuclear staining, or another compartment that dominates the expected pattern. | Reassess specificity and slide quality before calling this CLTC: the tissue profile is generally cytoplasmic and membranous (HPA: tissue IHC). A spindle-associated signal in a mitotic cell is a possible exception because CLTC is also reported at mitotic spindle bridges (UniProt Q00610: localization). Nuclear dominance alone lacks support in the supplied localization records. |
| Strong signal in adipocytes, oral squamous epithelial cells, or muscle cells reported as unstained. | HPA reports no detection in adipocytes, oral mucosal squamous epithelial cells, skeletal myocytes and smooth muscle cells (HPA: tissue IHC). Unexpected staining there raises concern for cross-reactivity or endogenous detection activity (general IHC practice). Treat these as comparison populations, not absolute biological knockouts; the HPA tissue profile has medium staining–RNA consistency (HPA: reliability). |
| Diffuse staining across cells and surrounding tissue, or no signal in a known-positive population. | A widespread haze obscures the reported cell and compartment pattern (HPA: tissue IHC). No signal in parathyroid glandular cells or placental trophoblasts conflicts with their reported high staining (HPA: tissue IHC). Neither result alone identifies a CLTC-specific cause; assess controls, tissue preservation and the general IHC workflow before interpreting a biological difference (general IHC practice). |
| Where should the signal sit? | CLTC is associated with the cytoplasmic face of coated pits and vesicles and has no transmembrane segment (UniProt Q00610: localization, topology). Interpret a membrane-associated rim together with cytoplasmic staining; the supplied record does not support calling CLTC a transmembrane surface marker. |
| How much confidence does tissue validation provide? | The HPA tissue pattern is Approved, with medium consistency between antibody staining and RNA expression (HPA: reliability). The listed HPA antibodies have Approved IHC status (HPA: antibody validation). These ratings support comparison with the reported pattern, while leaving unexpected staining to be checked against controls. |
| Could isoforms change the expected IHC result? | UniProt lists 2 CLTC isoforms (UniProt Q00610: isoforms). The supplied record gives no antibody epitope or isoform-specific tissue pattern, so it cannot predict which isoform a particular IHC signal represents. Avoid assigning regional staining differences to isoforms from this evidence alone. |
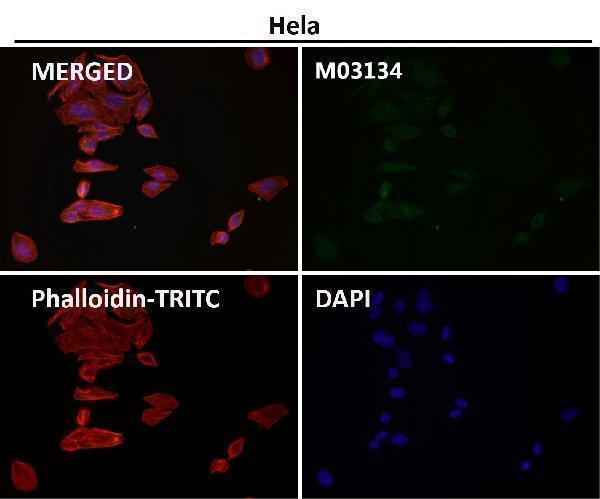
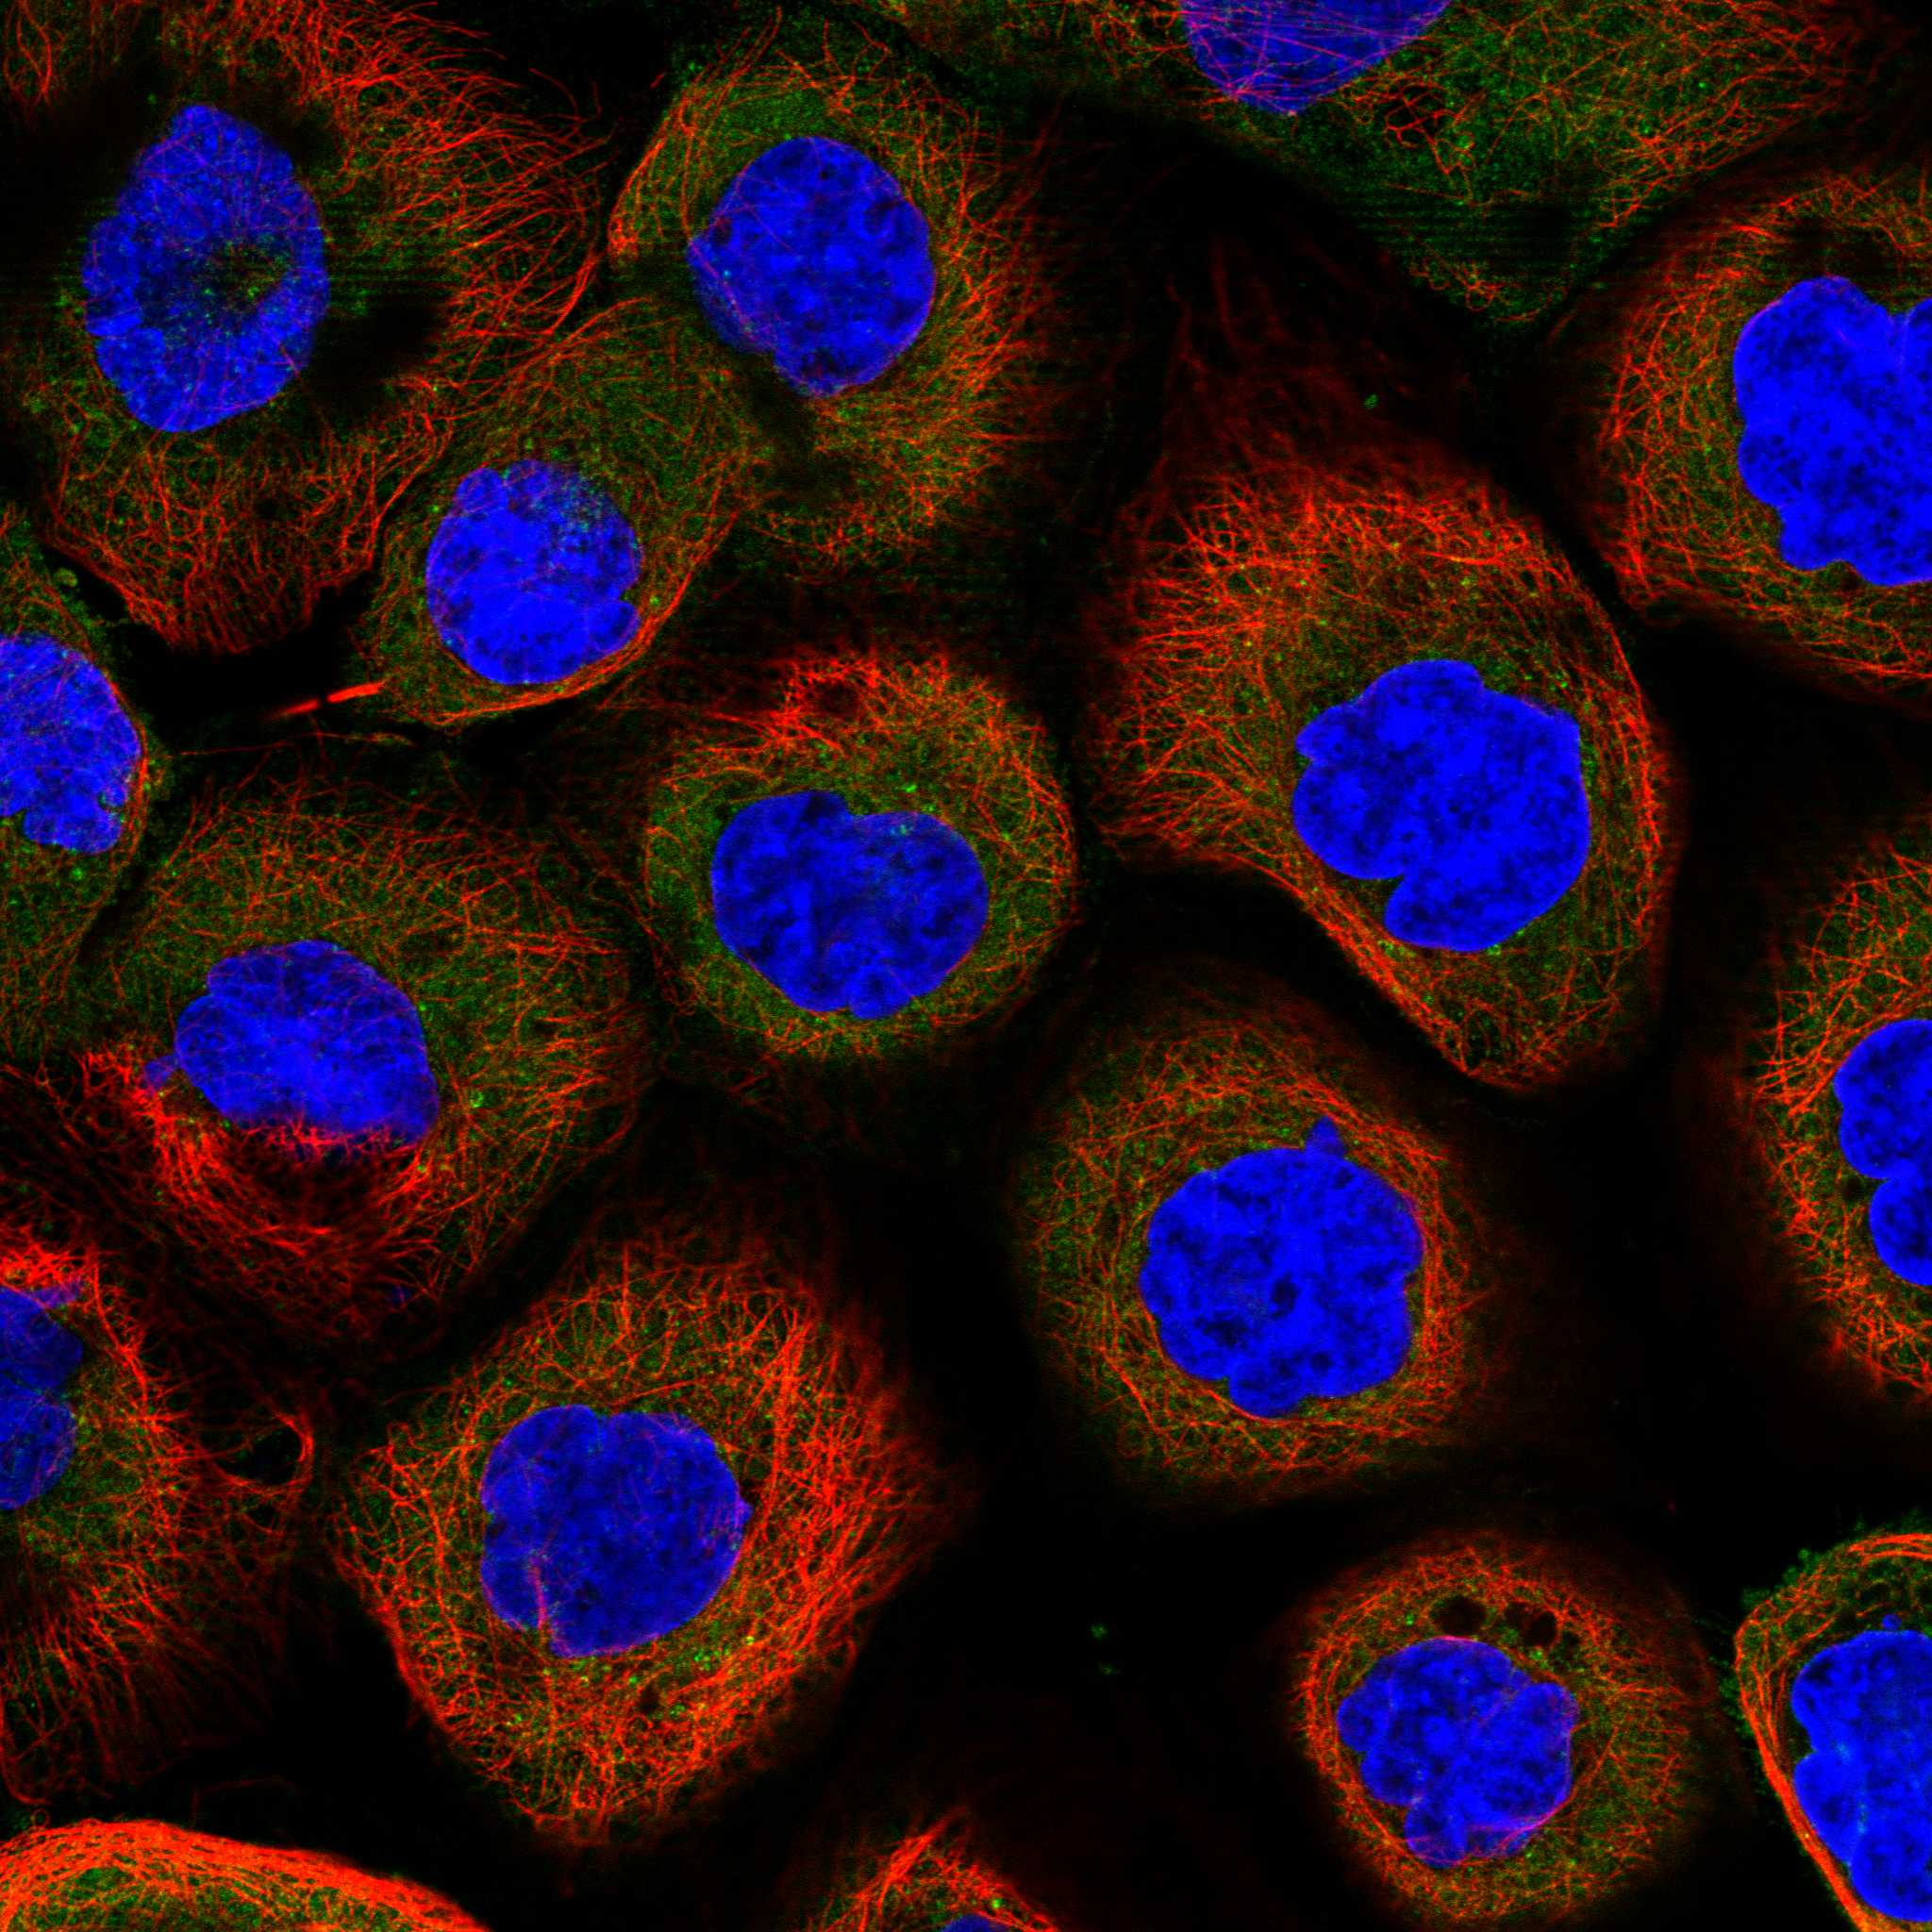
| What about IF/ICC localization? | HPA reports enhanced endosome and lysosome localization in ICC-IF, with supported mitotic spindle localization; cytosol and centriolar satellite assignments are uncertain (HPA: subcellular). Those cellular images can inform compartment interpretation, but they do not set an IHC-P staining threshold or provide an IHC protocol. |
| Situation | Likely cause | Next action |
|---|---|---|
| No signal in parathyroid glandular cells or placental trophoblasts. | This conflicts with their reported high staining (HPA: tissue IHC); the cause is unresolved. | Check the positive-control section, antibody dilution, antigen-retrieval record and detection steps (general IHC practice). |
| Only weak staining in a section expected to be strongly positive. | High HPA staining is cell-specific, so a section with few relevant cells can appear weak overall (HPA: tissue IHC). | Locate and score the named glandular or trophoblastic cells; compare a suitable positive-control section (general IHC practice). |
| Strong staining in adipocytes or HPA-undetected epithelial or muscle cells. | Cross-reactivity or endogenous detection activity is possible (HPA: tissue IHC; general IHC practice). | Review a no-primary control and the relevant endogenous-activity block before assigning CLTC positivity (general IHC practice). |
| Diffuse chromogen obscures cell boundaries. | Nonspecific background can mask the reported cytoplasmic and membranous profile (HPA: tissue IHC; general IHC practice). | Compare no-primary control staining; review blocking, washes, antibody dilution and detection time (general IHC practice). |
| Signal appears predominantly nuclear. | Nuclear dominance is unsupported by the supplied tissue and localization profiles (HPA: tissue IHC; UniProt Q00610: localization). | Check counterstain and controls, then reassess whether cytoplasmic or membrane-associated signal is present (general IHC practice). |
| A spindle-like signal appears in a dividing cell. | CLTC can localize to spindle inter-microtubule bridges (UniProt Q00610: localization). | Assess the dividing cell in context and compare the broader cytoplasmic and membranous tissue pattern before scoring (HPA: tissue IHC). |

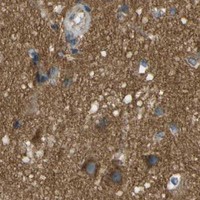



Comprehensive Human Protein Atlas IHC scoring per tissue (reliability: Approved — Medium consistency between antibody staining and RNA expression data.). Rows are taken directly from the HPA tissue chart — click any row's HPA link to view the source.
| Tissue | Cell type | Level | Evidence | Source |
|---|---|---|---|---|
| Parathyroid gland | Glandular cells | High | Protein (IHC) | HPA → |
| Placenta | Trophoblastic cells | High | Protein (IHC) | HPA → |
| Adrenal gland | Glandular cells | Medium | Protein (IHC) | HPA → |
| Appendix | Glandular cells | Medium | Protein (IHC) | HPA → |
| Bone marrow | Hematopoietic cells | Medium | Protein (IHC) | HPA → |
| Tissue | Cell type | Level | Evidence | Source |
|---|---|---|---|---|
| Adipose tissue | Adipocytes | Not detected | Protein (IHC) | HPA → |
| Oral mucosa | Squamous epithelial cells | Not detected | Protein (IHC) | HPA → |
| Skeletal muscle | Myocytes | Not detected | Protein (IHC) | HPA → |
| Smooth muscle | Smooth muscle cells | Not detected | Protein (IHC) | HPA → |
Troubleshoot CLTC staining in paraffin sections by checking retrieval, controls, and the expected cytoplasmic and membranous pattern (datasheet M03134; HPA tissue IHC).
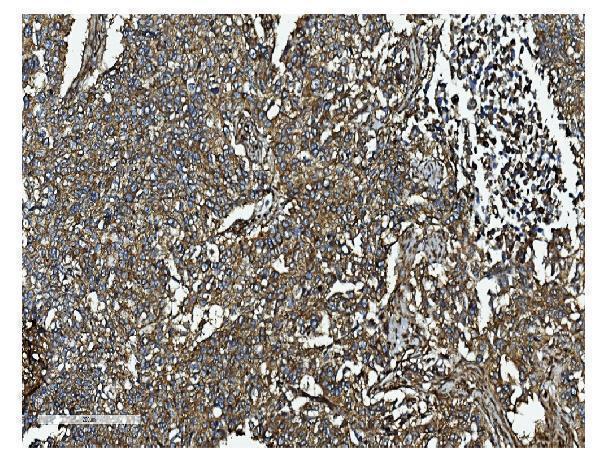
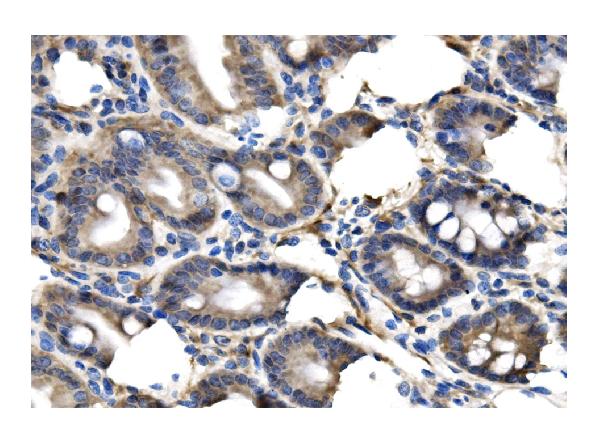
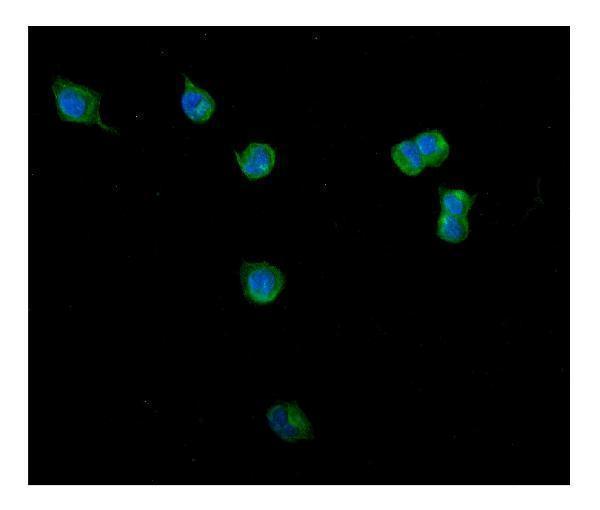
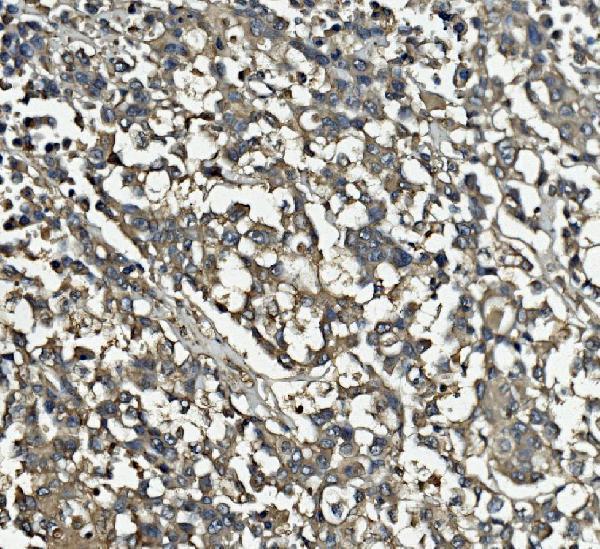
Catalog images show CLTC staining in human paraffin sections, mouse and rat intestine sections, and U20S cells by IF/ICC (catalog image captions: M03134, A03134-1, M03134-2).
M03134 shows IHC staining in human liver and lung cancer paraffin sections; A03134-1 shows IHC staining in human lung cancer and mouse and rat intestine paraffin sections, plus IF/ICC staining in U20S cells (catalog image captions: M03134, A03134-1). M03134-2 shows IHC staining in human pancreatic cancer, renal carcinoma, and tonsil paraffin sections (catalog image captions: M03134-2).
Which to pick: For tissue IHC, choose rabbit monoclonal M03134 when its human liver or lung cancer paraffin examples match the planned sample; its caption uses EDTA retrieval and 1:50 primary antibody (catalog entry and IHC image caption: M03134). For IF/ICC, choose A03134-1 because its application list includes both and its cell image documents staining at 5 μg/mL (catalog application list and IF image caption: A03134-1). For IHC across human, mouse, and rat samples, choose A03134-1 because it has a paraffin section image for each species; the cited tissue captions do not report the fixative (catalog IHC image captions: A03134-1).