This website uses cookies to ensure you get the best experience on our website.


- Table of Contents
Plan chromogenic CTBP1 IHC in paraffin sections around the observed nuclear tissue pattern (HPA tissue IHC). Use HPA’s medium-staining and low-staining tissues for comparison, while accounting for its warning that the antibody may detect proteins from more than one gene (HPA tissue IHC).

Expected localisation, validated protocols, controls and antibodies — the at-a-glance facts below, then the full design guide.
| Expected localisation | Nuclear staining in tissue; cytoplasm also annotated (HPA tissue IHC; UniProt) | |
| Staining pattern | General nuclear staining across tissue cell types (HPA tissue IHC) | |
| Antigen retrieval | Citrate pH 6 HIER, heat-mediated (datasheet PB9425) | |
| Positive control | Adrenal gland+4 more · see all | |
| Negative control | None in HPA (detected in all 45 tissues); use no-primary + isotype controls |
| Fixation | Keep fixation consistent across sections (standard IHC practice; not target-specific) | |
| Caveat | Staining may reflect proteins from more than one gene (HPA tissue IHC) | |
| Regulation | Expressed in germinal center B cells (UniProt) | |
| Isoform / epitope | Two isoforms; epitope coverage is unspecified (UniProt) |
The catalog antibody protocol uses citrate pH 6 heat retrieval (datasheet: PB9425). The published CTBP1 IHC protocols below provide additional details from melanoma, skin, and lung adenocarcinoma sections.
| Sample | Paraffin-embedded Mouse Thymus tissue; fixative not specified (datasheet PB9425) |
| Fixation | Image fixative and duration unreported (datasheet PB9425); verify before use. |
| Sectioning | 4–5 µm sections on charged slides (standard) |
| Deparaffinisation | Xylene, graded ethanol series to water (standard) |
| Antigen retrieval | Heat retrieval: Citrate pH 6, 20 min (datasheet PB9425) |
| Peroxidase block | 3% H2O2, 10 min, room temperature (standard) |
| Blocking | 10% goat serum (datasheet PB9425) |
| Primary antibody | Rabbit anti-CTBP1, 0.5-1μg/ml (datasheet PB9425) |
| Primary incubation | Overnight at 4 °C (datasheet PB9425) |
| Detection | Streptavidin-biotin complex (SABC), DAB chromogen (datasheet PB9425) |
| Counterstain | Hematoxylin, blue, dehydrate and mount (standard) |
| Expected result | CTBP1-positive staining in glandular cells of adrenal gland (HPA tissue IHC: Medium). HPA tissue profile: General nuclear expression. No signal in the no-primary control. |
CTBP1 should show mainly nuclear staining in paraffin sections, with medium staining reported in several epithelial, glandular, hematopoietic and neural cell populations (HPA tissue IHC: general nuclear expression; listed positive cells). Cytoplasmic signal is biologically possible (UniProt Q13363: nucleus and cytoplasm). CTBP1 has no transmembrane segment (UniProt Q13363 topology). HPA rates its tissue IHC evidence Approved, with medium agreement between staining and RNA data and a warning that the antibodies may detect protein from more than one gene (HPA tissue IHC: reliability description).
| Nuclear chromogen is visible in bronchial respiratory epithelial cells, appendix glandular cells or bone marrow hematopoietic cells. | This matches the reported general nuclear pattern and medium staining in those cell populations (HPA tissue IHC: profile; positive entries). Score the named cell population and its nuclear signal; do not treat every stained cell in the section as equivalent. |
| Staining is predominantly at cell borders or outside cells, with little nuclear signal in a listed positive population. | That distribution conflicts with the observed nuclear IHC pattern (HPA tissue IHC: profile). CTBP1 has no transmembrane segment (UniProt Q13363 topology). Check slide morphology, the detection reagents and a control section before interpreting the border or extracellular color as CTBP1. |
| Strong color appears in a cell population expected to stain weakly, while the listed positive population is inconspicuous. | For example, thyroid glandular cells are listed as low, whereas adrenal glandular cells are listed as medium (HPA tissue IHC: low and positive entries). This mismatch raises concern for cross-reactivity or endogenous detection activity; it does not prove either cause. HPA warns that the tissue IHC antibodies may detect protein from more than one gene (HPA tissue IHC: reliability description). |
| Color is diffuse across tissue or appears similarly in cells, stroma and empty areas. | A diffuse deposit obscures the compartment and cell population needed to judge the reported nuclear pattern (HPA tissue IHC: profile). Review a no-primary control for background from detection chemistry, and reassess blocking, washing and chromogen development as general IHC practice. |
| No nuclear signal is seen in an interpretable section containing a listed positive cell population. | A negative result is unexpected when, for example, bronchial respiratory epithelial cells or appendix glandular cells are present; both have reported medium staining (HPA tissue IHC: positive entries). Check section quality and the staining run before calling CTBP1 absent. The HPA rating is Approved, with medium staining–RNA consistency (HPA tissue IHC: reliability description). |
| Which cells provide the comparison? | Use the named HPA populations: adrenal and appendix glandular cells, bronchial respiratory epithelial cells, bone marrow hematopoietic cells, caudate or cortical glia, cerebellar granular-layer cells, and cervical squamous epithelial cells are reported at medium level (HPA tissue IHC: positive entries). Thyroid, salivary and prostate glandular cells are listed as low, so they are weaker comparators (HPA tissue IHC: low entries). |
| How secure is antibody-specific interpretation? | The tissue pattern is rated Approved, with medium agreement between antibody staining and RNA expression; HPA also cautions that the antibodies may target protein from more than one gene (HPA tissue IHC: reliability description). The listed antibodies have IHC Approved status; that status alone does not resolve a surprising cell-specific stain (HPA antibodies: HPA018987, HPA044971, CAB004217). |
| Could compartment or processing explain the signal? | UniProt places CTBP1 in the nucleus and cytoplasm and lists no transmembrane segment or signal peptide (UniProt Q13363: subcellular location, topology, processing). A predominantly nuclear IHC pattern agrees with HPA observations; a discrete cytoplasmic component is plausible, but extracellular or membrane-only staining needs independent scrutiny (HPA tissue IHC: profile; UniProt Q13363: location, topology). |
| Do isoforms change the expected pattern? | Two isoforms are listed, but the supplied record gives no isoform-specific IHC distribution or antibody epitope (UniProt Q13363: isoforms 1 and 2). Do not infer that a tissue-specific or compartment-specific difference identifies an isoform. Likewise, the listed phosphoserines do not establish a staining change in paraffin sections (UniProt Q13363: modified residues). |
| What should an IF/ICC image show? | For the separate IF/ICC application, the HPA summary identifies enhanced nucleoplasmic localization (HPA subcellular ICC-IF: main location). This supports a nuclear localization check, without supplying an IF/ICC protocol or converting ICC-IF validation into IHC validation. HPA lists ICC Enhanced for HPA018987 and Supported for CAB004217 (HPA antibodies: ICC statuses). |
| Situation | Likely cause | Next action |
|---|---|---|
| Nuclear stain is absent from a listed positive cell population. | The run or section may be uninformative; the population is reported at medium staining, which is an observation rather than a guaranteed result in every section (HPA tissue IHC: positive entries). | Confirm that the named cells are present and intact, compare a separately stained positive section, then review the IHC-validated antibody dilution, antigen retrieval and detection steps against its instructions (general IHC practice). |
| Color is widespread even where no cells are present. | A diffuse deposit can reflect detection background or excessive development (general IHC practice); it does not match general nuclear expression (HPA tissue IHC: profile). | Inspect a no-primary control, shorten chromogen development if excessive, and review washes and blocking (general IHC practice). Judge the target result only after nuclei and tissue boundaries are readable. |
| Color outlines membranes or accumulates extracellularly. | The pattern conflicts with HPA general nuclear staining and is unsupported by CTBP1 topology (HPA tissue IHC: profile; UniProt Q13363: no transmembrane segment). | Compare the suspect area with intact nuclei on the same slide and with a no-primary control. If the border or extracellular pattern persists without nuclear enrichment, treat it as nonspecific until independently validated (general IHC interpretation). |
| A low-staining cell population looks stronger than the chosen positive comparator. | The comparison may reflect cross-reactivity or endogenous detection activity; HPA specifically warns that its tissue IHC antibodies may detect protein from more than one gene (HPA tissue IHC: reliability description). | Compare cell types on sections stained in the same run, inspect a no-primary control for detection activity, and seek an independent antibody or orthogonal evidence before assigning the unexpected signal to CTBP1 (general IHC practice). |
| Only cytoplasmic stain is visible. | Cytoplasmic CTBP1 is possible, but cytoplasm-only staining differs from the general nuclear tissue pattern and enhanced nucleoplasmic ICC-IF localization (UniProt Q13363: subcellular location; HPA tissue IHC: profile; HPA subcellular ICC-IF: main location). | Check whether nuclei are preserved and assess a listed positive cell population. Record cytoplasmic staining separately; avoid scoring it as the expected IHC result without corroboration (HPA tissue IHC: profile; general IHC interpretation). |
| The stain varies sharply between comparable sections. | Section handling or run conditions may differ (general IHC practice). The supplied HPA and UniProt evidence does not establish CTBP1-specific fixation sensitivity or an antigen retrieval requirement. | Compare section quality, retrieval, antibody dilution and chromogen development across runs using the same IHC procedure and a listed positive cell population (general IHC practice; HPA tissue IHC: positive entries). Do not attribute the variation specifically to CTBP1 epitope masking from these sources. |


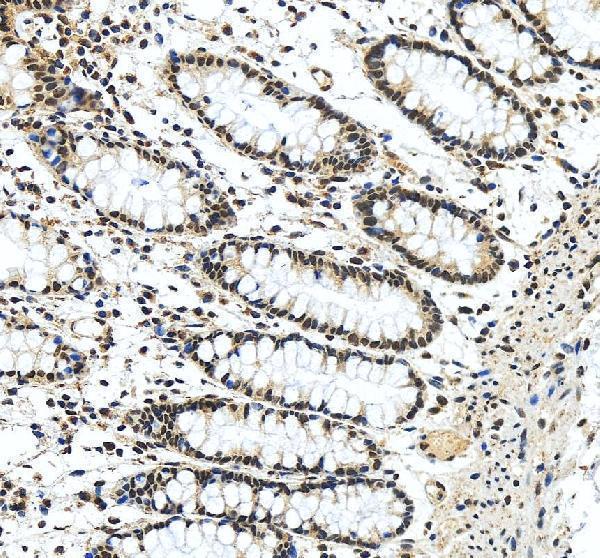
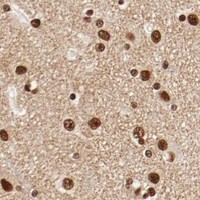
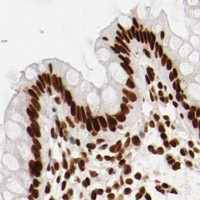


Comprehensive Human Protein Atlas IHC scoring per tissue (reliability: Approved — Medium consistency between antibody staining and RNA expression data. Caution, targets protein from more than one gene.). Rows are taken directly from the HPA tissue chart — click any row's HPA link to view the source.
| Tissue | Cell type | Level | Evidence | Source |
|---|---|---|---|---|
| Adrenal gland | Glandular cells | Medium | Protein (IHC) | HPA → |
| Appendix | Glandular cells | Medium | Protein (IHC) | HPA → |
| Bone marrow | Hematopoietic cells | Medium | Protein (IHC) | HPA → |
| Bronchus | Respiratory epithelial cells | Medium | Protein (IHC) | HPA → |
| Caudate | Glial cells | Medium | Protein (IHC) | HPA → |
| Tissue | Cell type | Level | Evidence | Source |
|---|---|---|---|---|
| None in HPA: CTBP1 is detected in all 45 scored tissues. Use a no-primary (secondary-only) and an isotype control instead. | ||||
Troubleshoot CTBP1 staining in paraffin sections by checking retrieval, nuclear localisation, antibody specificity and section artefacts before comparing signal across samples.
The catalog shows CTBP1 IHC in mouse thymus and rat brain paraffin sections (IHC image captions), plus PB9425 IF in human cells and human and rat tissue (PB9425 IF image captions).
PB9425 will render with its mouse thymus paraffin-section IHC image; its catalog also lists IF and ICC applications (PB9425 image caption and catalog). PA1570 will render with its rat brain paraffin-section IHC image and is listed for IHC in human, mouse, and rat (PA1570 image caption and catalog).
Which to pick: For tissue IHC, choose PB9425 when its mouse thymus example is relevant, or PA1570 when its rat brain example is relevant; both list human, mouse, and rat reactivity (respective IHC image captions and catalog). For IF/ICC, choose PB9425, which lists both applications and has IF images; PA1570 lists IHC without IF or ICC (respective catalog entries). Both are rabbit antibodies with no clone specified, and their rendered IHC captions describe paraffin sections without reporting the fixative (respective catalog entries and IHC image captions).