This website uses cookies to ensure you get the best experience on our website.


- Table of Contents
Plan CTNND1 paraffin IHC around the cytoplasmic and membranous staining reported in most tissues (HPA tissue IHC). Start with 2–5 μg/ml of the IHC-validated antibody (datasheet A02333-3), and score cytoplasmic and cell-contact staining separately (UniProt).

Expected localisation, validated protocols, controls and antibodies — the at-a-glance facts below, then the full design guide.
| Expected localisation | Cytoplasmic and membranous staining (HPA tissue IHC) | |
| Staining pattern | Most tissues show cytoplasmic and membranous staining (HPA tissue IHC) | |
| Antigen retrieval | EDTA pH 8.0 HIER, heat-mediated (datasheet A02333-3) | |
| Positive control | Placenta+4 more · see all | |
| Negative control | Caudate+4 more · see all |
| Fixation | Keep fixation consistent across sections (standard IHC practice; not target-specific); Matched tissue-IHC evidence does not establish the fixation claim. Validate the specimen-specific method before use. (selected-SKU IHC image A02333-3) | |
| Caveat | Isoform shifts may affect epitope recognition (UniProt) | |
| Regulation | Isoform 4A is generally lost in SCC/melanoma cells (UniProt) | |
| Isoform / epitope | 32 isoforms may alter epitope coverage; no transmembrane segment (UniProt) |
The catalog antibody’s IHC-P protocol (datasheet: A02333-3) is paired with published renal allograft and lung tumor IHC protocols (PMC10464146; PMC10758022).
| Sample | Paraffin-embedded human liver cancer tissue; fixative not specified (datasheet A02333-3) |
| Fixation | Image fixative and duration unreported (datasheet A02333-3); verify before use. |
| Sectioning | 4–5 µm sections on charged slides (standard) |
| Deparaffinisation | Xylene, graded ethanol series to water (standard) |
| Antigen retrieval | Heat retrieval: EDTA pH 8.0 (datasheet A02333-3); 20 min, 95–100 °C (standard) |
| Peroxidase block | 3% H2O2, 10 min, room temperature (standard) |
| Blocking | 10% goat serum (datasheet A02333-3) |
| Primary antibody | Rabbit anti-CTNND1, 2-5 μg/ml (datasheet A02333-3) |
| Primary incubation | Overnight at 4 °C (datasheet A02333-3) |
| Detection | Streptavidin-biotin complex (SABC), DAB chromogen (datasheet A02333-3) |
| Counterstain | Hematoxylin, blue, dehydrate and mount (standard) |
| Expected result | CTNND1-positive staining in cytotrophoblasts of placenta (HPA tissue IHC: High). HPA tissue profile: Cytoplasmic and membranous expression in most tissues. No signal in the no-primary control. |
CTNND1 is expected mainly at cell membranes and cell–cell junctions, with cytoplasmic staining also reported; nuclear localization is possible in some contexts (UniProt O60716 localization). It has no transmembrane segment (UniProt O60716 topology). In paraffin tissue sections, expect staining in the cell populations identified by HPA, including placental cytotrophoblasts and testicular Sertoli cells (HPA: High in both). HPA rates its tissue IHC evidence Enhanced, with medium consistency between staining and RNA expression (HPA tissue IHC).
| Membranous staining outlines contacts between adjacent cells, with some cytoplasmic staining in the expected population. | This fits CTNND1 at adherens junctions and in the cytoplasm (UniProt O60716 localization). HPA describes cytoplasmic and membranous expression in most tissues (HPA tissue IHC). Judge the positive result by both its compartment and its cell type; a brown signal alone is insufficient. |
| Signal is predominantly nuclear, with little staining at cell contacts or in the cytoplasm. | Recheck compartment assignment and antibody specificity before calling this the expected IHC pattern (HPA tissue IHC: cytoplasmic and membranous profile). Nuclear CTNND1 remains biologically possible: UniProt reports nuclear localization and GLIS2-associated nuclear translocation by similarity (UniProt O60716 localization). An isolated nuclear result needs contextual support. |
| Strong staining appears chiefly in an HPA-listed undetected population, such as splenic red-pulp cells. | HPA reports those cells as Not detected (HPA: spleen, cells in red pulp). Consider antibody cross-reactivity or endogenous chromogenic activity; inspect a no-primary control and compare with an expected-positive population. An HPA negative is an observed result for that cell population, not proof that every specimen must be negative. |
| Brown precipitate spreads across cells and surrounding tissue without clear cell boundaries. | The distribution does not resolve the membranous or cytoplasmic pattern described by HPA (HPA tissue IHC). Assess nonspecific antibody binding, incomplete blocking or washing, and chromogen background as general IHC possibilities. Use the no-primary section to determine whether signal persists without the primary antibody. |
| Placental cytotrophoblasts or testicular Sertoli cells show no interpretable signal. | These are useful expected-positive populations because HPA reports High staining in each (HPA: cytotrophoblasts; HPA: Sertoli cells). First check that the named cells are present and preserved in the section. Then review the catalog antibody’s IHC-P instructions, reagent performance, and detection controls before interpreting absence as biological. |
| Which compartments should guide scoring? | Prioritize cell contacts, membranes, and cytoplasm (UniProt O60716 localization; HPA tissue IHC). UniProt also lists the nucleus, so assess nuclear signal in context rather than treating every nuclear cell as an automatic false positive. |
| Does every tissue or cell type stain equally? | No. HPA reports High staining in placental cytotrophoblasts and Sertoli cells, Medium staining in colon endothelial cells, and Not detected in splenic red-pulp cells (HPA tissue IHC). Score the annotated cell population, not the whole organ. |
| How strong is the tissue-pattern evidence? | HPA labels tissue IHC Enhanced but describes only medium consistency between antibody staining and RNA expression (HPA tissue IHC). Its Enhanced IHC category reflects reproduction by independent antibodies or orthogonal data (HPA antibody validation); it does not guarantee every specimen will match. |
| Can isoforms change interpretation? | UniProt lists 32 CTNND1 isoforms and reports different isoform representation in keratinocytes, melanocytes, and melanoma cells (UniProt O60716 isoforms; tissue specificity). The supplied record gives no antibody epitope, so it cannot establish which isoforms the catalog antibody detects. |
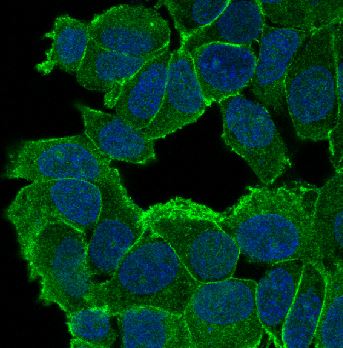
| IF/ICC Q&A: where should fluorescent CTNND1 appear? | HPA reports mainly plasma-membrane localization, with an additional basal-body location in its ICC-IF data (HPA subcellular). This answers the compartment question for IF/ICC; use the separate IF/ICC guide for its experimental workflow. |
| Situation | Likely cause | Next action |
|---|---|---|
| Expected-positive cells are present, but staining is absent. | A missed primary or detection step, weak reagents, or a mismatch with the catalog antibody’s IHC-P conditions are general workflow possibilities; HPA reports High staining in cytotrophoblasts and Sertoli cells (HPA tissue IHC). | Check an expected-positive section alongside the sample. Confirm antibody and detection steps against the catalog IHC-P instructions, then verify that the control produces a cell-localized signal. |
| All sections, including a no-primary control, develop brown signal. | Signal persisting without primary antibody points to endogenous detection activity or chromogen background as general IHC possibilities. | Check the detection chemistry and the relevant endogenous-activity block; compare the no-primary section with the test section before scoring CTNND1. |
| Signal is widespread and obscures cell borders. | Nonspecific binding, concentrated primary antibody, or inadequate washing can obscure the expected membranous and cytoplasmic profile (HPA tissue IHC). | Review blocking, primary-antibody concentration, and washes using the catalog IHC-P instructions; seek a localized pattern in the expected cells. |
| A negative cell population stains more strongly than the expected-positive cells. | Cross-reactivity or endogenous detection activity is possible. HPA reports some populations as Not detected, including splenic red-pulp cells (HPA tissue IHC). | Compare matched expected-positive and no-primary sections. Check the identity of the stained cells before assigning the signal to CTNND1. |
| Predominantly nuclear staining conflicts with the anticipated junctional pattern. | The result may reflect interpretation or specificity problems, although UniProt also lists nuclear localization and context-dependent translocation (UniProt O60716 localization). | Inspect cell boundaries and cytoplasmic signal, compare expected-positive tissue, and document the nuclear distribution rather than scoring it solely from color intensity. |
| Two tissues give different staining intensity. | That can fit the HPA record: placental cytotrophoblasts are High, colon endothelial cells are Medium, and splenic red-pulp cells are Not detected (HPA tissue IHC). | Identify and score the specific cell population in each tissue. Investigate technique only when an expected-positive population fails its control or loses interpretable localization. |
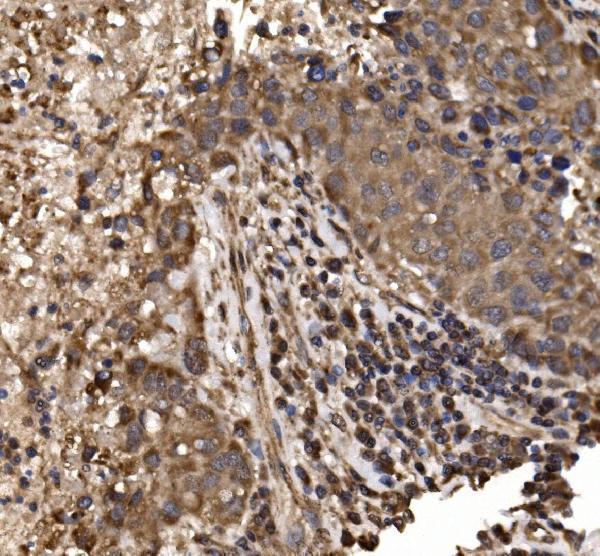
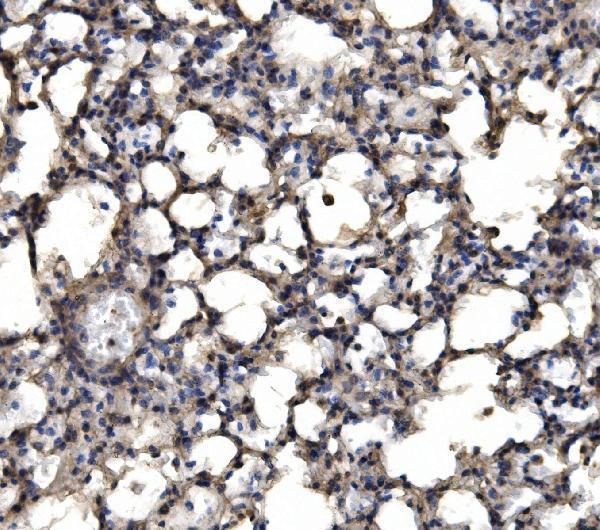
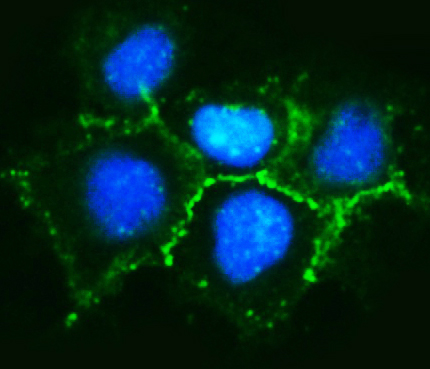
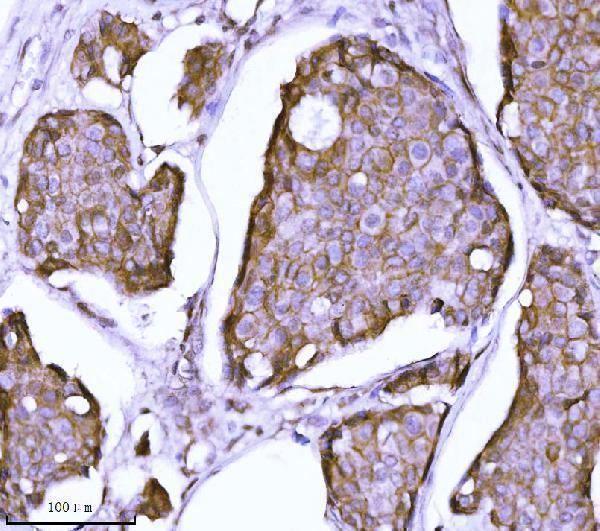

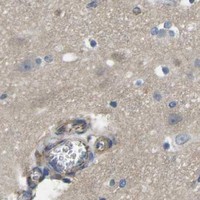

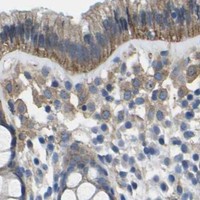
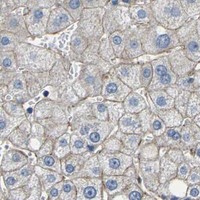


Comprehensive Human Protein Atlas IHC scoring per tissue (reliability: Enhanced — Medium consistency between antibody staining and RNA expression data.). Rows are taken directly from the HPA tissue chart — click any row's HPA link to view the source.
| Tissue | Cell type | Level | Evidence | Source |
|---|---|---|---|---|
| Placenta | Cytotrophoblasts | High | Protein (IHC) | HPA → |
| Testis | Sertoli cells | High | Protein (IHC) | HPA → |
| Adrenal gland | Glandular cells | Medium | Protein (IHC) | HPA → |
| Appendix | Glandular cells | Medium | Protein (IHC) | HPA → |
| Breast | Glandular cells | Medium | Protein (IHC) | HPA → |
| Tissue | Cell type | Level | Evidence | Source |
|---|---|---|---|---|
| Caudate | Glial cells | Not detected | Protein (IHC) | HPA → |
| Cerebellum | Cells in granular layer | Not detected | Protein (IHC) | HPA → |
| Hippocampus | Glial cells | Not detected | Protein (IHC) | HPA → |
| Spleen | Cells in red pulp | Not detected | Protein (IHC) | HPA → |
| Vagina | Squamous epithelial cells | Not detected | Protein (IHC) | HPA → |
Troubleshoot CTNND1 staining by checking retrieval, tissue handling, compartment pattern and cell identity before comparing staining intensity across paraffin sections.
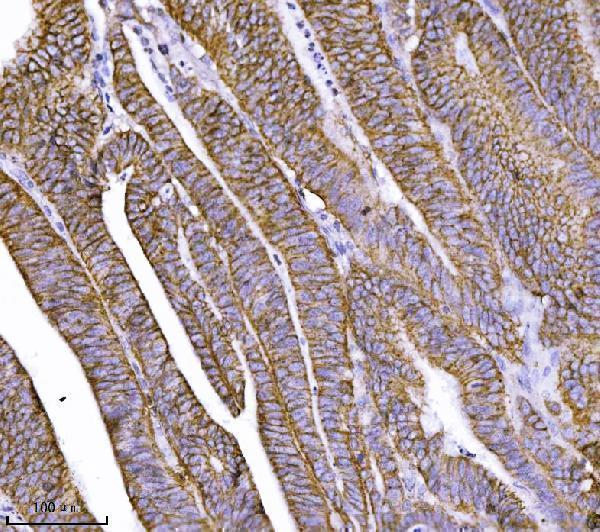
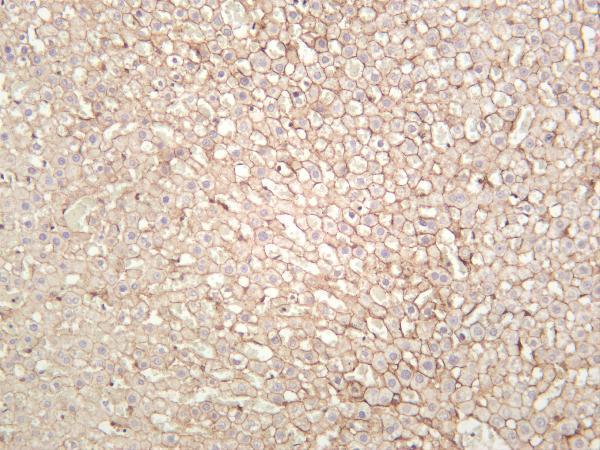
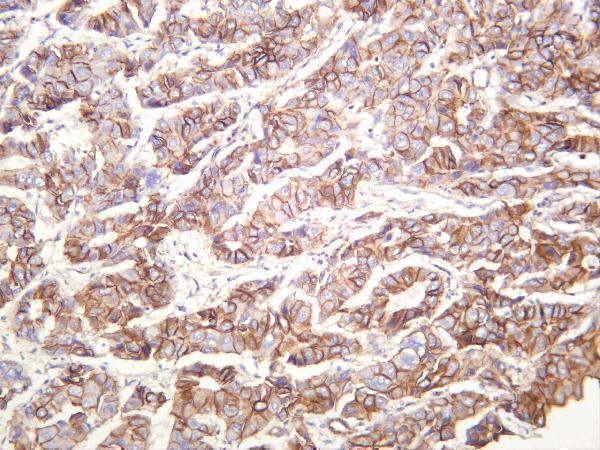
The catalog includes anti-CTNND1 antibodies with IHC images from human, mouse and rat tissues and IF images from human cells (catalog image captions).
A02333-3 shows IHC in human liver cancer, mouse lung and intestines, and rat lung; M02333-2 shows IHC in human breast, colorectal and laryngeal cancers (catalog image captions). M02333-4 shows IHC in rat liver, human cervical and liver cancers, and mouse liver; M02333 shows IF in MCF-7 cells (catalog image captions).
Which to pick: For paraffin-section IHC, choose M02333-2 when a mouse monoclonal is preferred: its breast cancer IHC caption documents EDTA retrieval at pH 8.0 and 2 μg/ml primary antibody (catalog image caption); the fixative is unreported (catalog image caption). For IF/ICC, M02333 has an MCF-7 IF image and lists both applications, with a listed IF dilution of 1:50 (catalog image caption; catalog applications and dilution). For IHC across species, A02333-3 has pictured human, mouse and rat paraffin sections prepared with EDTA retrieval at pH 8.0; its captions do not report the fixative (catalog image captions).