This website uses cookies to ensure you get the best experience on our website.


- Table of Contents
Plan chromogenic DACT2 IHC-P around its broad cytoplasmic tissue staining (HPA tissue IHC). Use hepatocytes, syncytiotrophoblasts or prostate glandular cells as positive tissue references (HPA tissue IHC), and start the catalog antibody at 2.5 μg/mL (datasheet).

Expected localisation, validated protocols, controls and antibodies — the at-a-glance facts below, then the full design guide.
| Expected localisation | Cytoplasmic staining in many tissues (HPA tissue IHC) | |
| Staining pattern | Broad cytoplasmic staining; strong in hepatocytes (HPA tissue IHC) | |
| Antigen retrieval | Citrate pH 6.0 HIER, 95–98 °C, 20 min (rule: cytoplasmic / membrane antigen) | |
| Positive control | Liver+4 more · see all | |
| Negative control | Parathyroid gland+1 more · see all |
| Fixation | Keep fixation conditions consistent across sections. (standard IHC practice; not target-specific) | |
| Caveat | Antibody staining has medium agreement with RNA data (HPA tissue IHC) | |
| Regulation | Expression regulation not annotated (UniProt) | |
| Isoform / epitope | Four isoforms; assess antibody epitope coverage (UniProt) |
The catalog antibody’s IHC-P protocol is followed by published chromogenic DACT2 protocols from HCC, myocardial, and esophageal carcinoma specimens (PMC3605395; PMC7330378; PMC5225534).
| Sample | Tissue sections; selected-image fixative not specified (standard IHC workflow) |
| Fixation | Image fixative and duration unreported (datasheet A10097); verify before use. |
| Sectioning | 4–5 µm sections on charged slides (standard) |
| Deparaffinisation | Xylene, graded ethanol series to water (standard) |
| Antigen retrieval | Heat-induced epitope retrieval in citrate buffer, pH 6.0, 20 min at 95–98 °C (standard rule: cytoplasmic / membrane antigen) |
| Peroxidase block | 3% H2O2, 10 min, room temperature (standard) |
| Blocking | 10% normal serum of the secondary host, 30 min, room temperature (standard) |
| Primary antibody | Rabbit anti-DACT2, 2.5 μg/mL (datasheet A10097) |
| Primary incubation | Overnight at 4 °C (standard) |
| Detection | HRP-polymer secondary, DAB chromogen 5–10 min (standard) |
| Counterstain | Hematoxylin, blue, dehydrate and mount (standard) |
| Expected result | DACT2-positive staining in hepatocytes of liver (HPA tissue IHC: High). HPA tissue profile: Ubiquitous cytoplasmic expression. No signal in the no-primary control. |
Expect predominantly cytoplasmic DACT2 staining in paraffin sections, with strong signal in hepatocytes, placental syncytiotrophoblasts and prostate glandular cells (HPA: ubiquitous cytoplasmic profile; High in these cells). DACT2 has no annotated transmembrane segment (UniProt Q5SW24 topology). HPA rates its IHC pattern Approved, with medium consistency against RNA data and external verification pending (HPA: reliability).
| Clear cytoplasmic signal in hepatocytes, syncytiotrophoblasts or prostate glandular cells. | This fits the reported compartment and high-staining cell populations (HPA: cytoplasmic profile; High in liver, placenta and prostate). Judge signal in the named cells, alongside a negative control, rather than treating every stained structure in the section as DACT2 (general IHC practice). |
| Predominantly crisp membrane or nuclear staining, with little cytoplasmic signal. | This conflicts with the reported cytoplasmic IHC profile (HPA: tissue IHC profile). A dominant membrane rim is also unsupported by the absence of an annotated transmembrane segment (UniProt Q5SW24 topology). Consider localization artefact or nonspecific staining; check controls before interpreting a new compartment. |
| Strong signal in cells reported as unstained, especially parathyroid or thyroid glandular cells. | HPA reports DACT2 as not detected in those glandular cells (HPA: parathyroid and thyroid gland). Cross-reactivity or endogenous detection activity is possible (general IHC practice). Compare the staining with a no-primary control and with an HPA high-staining cell population. |
| Diffuse color across cells and surrounding tissue, without discernible cytoplasmic boundaries. | A widespread haze cannot establish the reported cellular pattern (HPA: cytoplasmic profile). Background from detection reagents or inadequate blocking can obscure a specific signal (general IHC practice). Use the negative control to identify background before scoring cell-specific staining. |
| No signal in hepatocytes, placental syncytiotrophoblasts or prostate glandular cells. | Each is reported as a high-staining population (HPA: tissue IHC). Absence in an otherwise suitable positive-control section suggests an assay or specimen problem (general IHC practice). HPA's Approved rating has medium RNA agreement and awaits external verification, so a single negative result does not settle expression (HPA: reliability). |
| Tissue and cell choice | HPA reports High staining in hepatocytes, syncytiotrophoblasts and prostate glandular cells; it reports Not detected in parathyroid and thyroid glandular cells (HPA: tissue IHC). Those named populations provide more interpretable comparisons than a whole-section positive or negative label. |
| Strength of localization evidence | The cytoplasmic pattern comes from HPA tissue IHC, rated Approved with medium RNA consistency and pending external verification (HPA: profile and reliability). UniProt supplies no subcellular annotation, and HPA lists no ICC-IF images or main IF location (UniProt Q5SW24; HPA: subcellular). An IF result therefore needs its own controls. |
| Topology and processing | DACT2 has no annotated transmembrane segment or signal peptide, and UniProt lists one chain spanning residues 1–774 (UniProt Q5SW24 topology and processing). These annotations support checking a dominant membrane-only pattern; they do not identify the antibody epitope or establish a retrieval condition. |
| Isoform coverage | UniProt lists four DACT2 isoforms (UniProt Q5SW24 isoforms). The supplied record gives no antibody epitope, so coverage across isoforms cannot be inferred. If staining differs between samples, keep that uncertainty in mind before attributing the difference to expression. |
| Detection activity | For a peroxidase-based chromogenic assay, endogenous activity can create color independent of primary-antibody binding (general IHC practice). A no-primary control and an appropriate enzyme-blocking step help distinguish that background from the cell-resolved HPA pattern (HPA: cytoplasmic profile). |
| Situation | Likely cause | Next action |
|---|---|---|
| Expected high-staining cells are blank. | The assay may have failed, or the section may not contain an interpretable positive population (general IHC practice; HPA: High in hepatocytes, syncytiotrophoblasts and prostate glandular cells). | Confirm the named cells are present, inspect the counterstain and detection controls, then review retrieval and antibody incubation using the assay's validated instructions (general IHC practice). No DACT2-specific retrieval setting is supplied. |
| The entire section develops color, including a no-primary control. | Primary-antibody binding cannot explain color in that control; endogenous enzyme activity or detection-reagent background is possible (general IHC practice). | Check the detection system's blocking and wash steps, and compare control and test sections before scoring cytoplasmic staining (general IHC practice; HPA: cytoplasmic profile). |
| Parathyroid or thyroid glandular cells stain strongly. | That finding conflicts with HPA's Not detected calls for these cells; cross-reactivity or endogenous detection activity is possible (HPA: tissue IHC; general IHC practice). | Compare a no-primary control and an HPA high-staining population on the same run; interpret persistent unexpected staining cautiously (general IHC practice; HPA: tissue IHC). |
| Staining appears mainly as a membrane rim or nuclear focus. | This differs from the HPA cytoplasmic profile; a membrane-only result also lacks support from UniProt topology (HPA: tissue IHC profile; UniProt Q5SW24 topology). | Inspect cell boundaries and the negative control, then check whether detection background or section artefact explains the pattern before assigning DACT2 localization (general IHC practice). |
| Signal is weak or uneven in a reported high-staining population. | Uneven section quality or assay conditions can complicate comparison (general IHC practice); HPA's staining levels do not establish a DACT2-specific fixation effect (HPA: tissue IHC). | Check section integrity, retrieval and incubation against the validated IHC instructions, and compare a concurrently processed positive control (general IHC practice). |
| An IF image appears to show a precise DACT2 compartment. | The supplied HPA subcellular record has no main location or ICC-IF images; tissue IHC alone cannot validate that IF assignment (HPA: subcellular and tissue IHC). | Assess the IF signal with modality-appropriate negative controls and cell markers before reporting a compartment (general IF practice); use the separate IF/ICC guide for assay design. |


Comprehensive Human Protein Atlas IHC scoring per tissue (reliability: Approved — Medium consistency between antibody staining and RNA expression data. Pending external verification.). Rows are taken directly from the HPA tissue chart — click any row's HPA link to view the source.
| Tissue | Cell type | Level | Evidence | Source |
|---|---|---|---|---|
| Liver | Hepatocytes | High | Protein (IHC) | HPA → |
| Placenta | Syncytiotrophoblasts | High | Protein (IHC) | HPA → |
| Prostate | Glandular cells | High | Protein (IHC) | HPA → |
| Adrenal gland | Glandular cells | Medium | Protein (IHC) | HPA → |
| Bone marrow | Hematopoietic cells | Medium | Protein (IHC) | HPA → |
Troubleshoot DACT2 staining in paraffin sections by checking retrieval, cell type, cytoplasmic localisation, and controls before interpreting signal intensity.
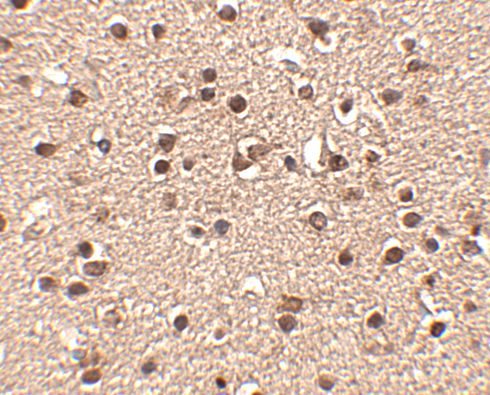
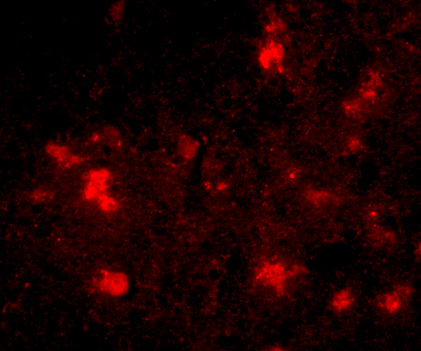
A10097 has IHC data from human brain tissue (IHC image caption) and IF data from human brain cells (IF image caption).
A10097 is listed for IHC-P and shown staining human brain tissue at 2.5 μg/mL (catalog applications; IHC image caption). A10097 is also listed for IF and shown staining human brain cells at 20 μg/mL (catalog applications; IF image caption).
Which to pick: Choose A10097 for paraffin-section IHC (catalog applications: IHC-P); its IHC image shows human brain tissue, but the fixative is unreported (IHC image caption). For IF/ICC, A10097 has IF data from human brain cells (IF image caption); ICC validation is unreported (catalog applications). For mouse or rat samples, A10097 lists reactivity with both species (catalog reactivity), while its IHC and IF images show human samples (IHC and IF image captions).