This website uses cookies to ensure you get the best experience on our website.


- Table of Contents
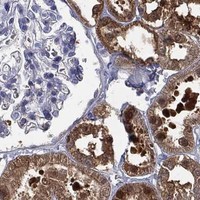
Plan chromogenic DDAH1 IHC in paraffin sections using kidney proximal tubules as a high-staining reference (HPA tissue IHC). Compare cytoplasmic staining across cell types and keep fixation consistent across sections (HPA tissue IHC; standard IHC practice).

Expected localisation, validated protocols, controls and antibodies — the at-a-glance facts below, then the full design guide.
| Expected localisation | Cytoplasmic staining in most tissues (HPA tissue IHC) | |
| Staining pattern | Cytoplasmic; high in kidney proximal tubule cell bodies (HPA tissue IHC) | |
| Antigen retrieval | Citrate pH 6 HIER, heat-mediated (datasheet PB10000) | |
| Positive control | Adrenal gland+4 more · see all | |
| Negative control | Adipose tissue+4 more · see all |
| Fixation | Keep fixation consistent across sections (standard IHC practice; not target-specific) | |
| Caveat | Staining and RNA have medium consistency (HPA tissue IHC) | |
| Regulation | Expression regulation is unreported (UniProt) | |
| Isoform / epitope | 2 isoforms; epitope coverage is unspecified (UniProt) |
The catalog antibody protocol uses citrate pH 6 retrieval (datasheet: PB10000). Published DDAH1 IHC protocols cover eye, xenograft, penile and gastric tissue (PMC4912010; PMC12376576; PMC5245815; PMC5579338).
| Sample | Paraffin-embedded rat brain tissues; fixative not specified (datasheet PB10000) |
| Fixation | Image fixative and duration unreported (datasheet PB10000); verify before use. |
| Sectioning | 4–5 µm sections on charged slides (standard) |
| Deparaffinisation | Xylene, graded ethanol series to water (standard) |
| Antigen retrieval | Heat retrieval: Citrate pH 6, 20 min (datasheet PB10000) |
| Peroxidase block | 3% H2O2, 10 min, room temperature (standard) |
| Blocking | 10% goat serum (datasheet PB10000) |
| Primary antibody | Rabbit anti-DDAH1, 0.5-1μg/ml (datasheet PB10000) |
| Primary incubation | Overnight at 4 °C (datasheet PB10000) |
| Detection | Streptavidin-biotin complex (SABC), DAB chromogen (datasheet PB10000) |
| Counterstain | Hematoxylin, blue, dehydrate and mount (standard) |
| Expected result | DDAH1-positive staining in glandular cells of adrenal gland (HPA tissue IHC: High). HPA tissue profile: Cytoplasmic expression in most tissues, including kidney. No signal in the no-primary control. |
In paraffin-section IHC, expect mainly cytoplasmic DDAH1 staining, with strong signal in kidney proximal tubule cell bodies and several other cell populations (HPA: tissue IHC). HPA rates the tissue profile Enhanced, while reporting medium consistency between staining and RNA expression (HPA: tissue IHC reliability). DDAH1 has no annotated transmembrane segment; UniProt does not assign it a subcellular location (UniProt O94760: topology and subcellular annotation).
| Strong cytoplasmic staining in kidney proximal tubule cell bodies. | This matches a high-signal reference population (HPA: High in kidney proximal tubules). Compare staining in the identified cells with surrounding tissue; a uniformly dark section is harder to interpret as a cell-specific result (general IHC practice). |
| Predominantly nuclear, sharply membranous, or extracellular staining in an IHC section. | Check the pattern against HPA's mainly cytoplasmic tissue profile before calling it DDAH1 (HPA: tissue IHC profile). HPA also reports plasma membrane, cytosol, and additional nucleolar localization in ICC/IF, so compartment differences require assay-specific interpretation (HPA: subcellular ICC/IF). |
| Strong staining in adipocytes or lymph-node germinal center cells. | These cell populations are listed as not detected in HPA tissue IHC (HPA: adipocytes and germinal center cells). Recheck cell identification and controls; apparent signal may reflect nonspecific binding or endogenous chromogen-generating activity (general IHC practice). |
| Diffuse brown haze across cells and extracellular areas. | A diffuse pattern does not resolve HPA's reported cell-specific cytoplasmic distribution (HPA: tissue IHC profile). In chromogenic IHC, inadequate blocking, excess detection reagent, or residual endogenous activity can create background; examine control sections before scoring (general IHC practice). |
| No signal in kidney proximal tubules. | An absent result conflicts with the high staining reported for proximal tubule cell bodies (HPA: High in kidney proximal tubules). Check tissue preservation, primary antibody, retrieval, and detection controls before interpreting the specimen as negative (general IHC practice). |
| Tissue and cell selection | Kidney proximal tubules provide a high-staining reference, while adipocytes are reported as not detected (HPA: kidney proximal tubules; HPA: adipocytes). Use the named cell populations when comparing sections, since a whole-tissue average can obscure their different patterns (general IHC practice). |
| Strength of the reference pattern | HPA labels its tissue profile Enhanced but describes medium consistency between antibody staining and RNA expression (HPA: tissue IHC reliability). 2 listed antibodies have Enhanced IHC status (HPA: HPA006308 and HPA071064); these ratings support the reference pattern without guaranteeing every specimen. |
| Compartment and topology | The tissue profile is mainly cytoplasmic (HPA: tissue IHC), and UniProt annotates no transmembrane segment or subcellular location (UniProt O94760: topology and subcellular annotation). Neither record establishes a mandatory membrane pattern for chromogenic paraffin-section IHC. |
| Isoform coverage | UniProt lists 2 DDAH1 isoforms (UniProt O94760: isoforms). The supplied evidence does not map either antibody's epitope to an isoform, so staining intensity cannot be assigned to a particular isoform from these records. |
| What does ICC/IF add? | HPA reports approved cytosol and plasma-membrane localization, with additional approved nucleolar localization in ICC/IF (HPA: subcellular ICC/IF). Use that finding to interpret an IF image in its own assay context; the paraffin-section IHC reference remains mainly cytoplasmic (HPA: tissue IHC). |
| Situation | Likely cause | Next action |
|---|---|---|
| Kidney proximal tubules are unstained. | The expected high-signal reference is absent (HPA: High in kidney proximal tubules); a failed retrieval or detection step is one possible technical cause (general IHC practice). | Confirm the proximal tubules are present, then review the IHC-validated antibody's recommended retrieval and dilution conditions and run a positive control through the same staining batch (general IHC practice). |
| All tissue structures have similar brown staining. | Widespread chromogen can arise from endogenous enzyme activity or detection background (general IHC practice), obscuring HPA's cell-specific cytoplasmic profile (HPA: tissue IHC). | Review a no-primary control, the appropriate endogenous-activity block, wash steps, and detection reagent concentration before scoring any cell population (general IHC practice). |
| Adipocytes stain as strongly as the positive reference. | HPA reports adipocytes as not detected (HPA: adipocytes). Strong signal there raises concern about cell identification, nonspecific binding, or background; HPA's category alone does not identify the cause. | Verify tissue morphology and compare the no-primary control with the same staining run. Reassess primary antibody dilution and blocking if the unexpected signal persists (general IHC practice). |
| Only nuclei appear positive in paraffin-section IHC. | A nuclear-dominant IHC pattern differs from HPA's mainly cytoplasmic tissue profile (HPA: tissue IHC). Additional nucleolar localization is an ICC/IF observation and does not by itself validate this IHC result (HPA: subcellular ICC/IF). | Check counterstain and chromogen separation, then compare positive and no-primary controls and repeat the assay under the validated IHC conditions if needed (general IHC practice). |
| Weak staining is seen in pancreas but strong staining in kidney. | HPA lists pancreatic exocrine glandular cells as Low and kidney proximal tubules as High (HPA: pancreas; HPA: kidney). Different intensities across those named cell types can therefore be consistent with the reference profile. | Score each identified cell population against its own HPA category and inspect staining controls before increasing detection sensitivity (HPA: tissue IHC; general IHC practice). |
| The IF image appears more membranous than the IHC section. | Plasma-membrane and cytosol localization are approved in HPA ICC/IF, while HPA describes tissue IHC as mainly cytoplasmic (HPA: subcellular ICC/IF; HPA: tissue IHC). | Interpret each image against its assay-specific HPA reference. Keep the paraffin-section IHC call anchored to identifiable cells and cytoplasmic staining (HPA: tissue IHC; general IHC practice). |




Comprehensive Human Protein Atlas IHC scoring per tissue (reliability: Enhanced — Medium consistency between antibody staining and RNA expression data.). Rows are taken directly from the HPA tissue chart — click any row's HPA link to view the source.
| Tissue | Cell type | Level | Evidence | Source |
|---|---|---|---|---|
| Adrenal gland | Glandular cells | High | Protein (IHC) | HPA → |
| Bronchus | Respiratory epithelial cells | High | Protein (IHC) | HPA → |
| Cerebral cortex | Glial cells | High | Protein (IHC) | HPA → |
| Fallopian tube | Glandular cells | High | Protein (IHC) | HPA → |
| Gallbladder | Glandular cells | High | Protein (IHC) | HPA → |
| Tissue | Cell type | Level | Evidence | Source |
|---|---|---|---|---|
| Adipose tissue | Adipocytes | Not detected | Protein (IHC) | HPA → |
| Bone marrow | Hematopoietic cells | Not detected | Protein (IHC) | HPA → |
| Cerebellum | Cells in granular layer | Not detected | Protein (IHC) | HPA → |
| Cervix | Squamous epithelial cells | Not detected | Protein (IHC) | HPA → |
| Endometrium | Cells in endometrial stroma | Not detected | Protein (IHC) | HPA → |
Troubleshoot DDAH1 staining in paraffin sections by checking retrieval, cell type and compartment before comparing chromogenic signal across samples.
PB10000 has illustrated paraffin-section IHC in human, mouse and rat brain and IF in U20S cells (PB10000 image captions). M03136 lists IHC and IF in those species plus monkey (M03136 catalog applications/reactivity).
PB10000 lists IHC and IF, with illustrated paraffin-section IHC in human, mouse and rat brain and IF in U20S cells (PB10000 catalog applications/image captions). M03136 lists IHC and IF with human, monkey, mouse and rat reactivity; no IHC or IF image is supplied for it (M03136 catalog applications/reactivity/image alts).
Which to pick: For tissue IHC, choose PB10000 when an illustrated paraffin-section example matters; its human, mouse and rat brain captions do not report the fixative (PB10000 IHC image captions). For IF/ICC, PB10000 has an illustrated U20S-cell example, while M03136 lists IF/ICC without an image in this payload (PB10000 IF image caption; M03136 catalog applications/image alts). For the broadest listed species coverage, choose rabbit monoclonal M03136, clone AEAG-4, which includes monkey alongside human, mouse and rat (M03136 catalog host/clone/reactivity).