This website uses cookies to ensure you get the best experience on our website.


- Table of Contents
Real validated DRD1 Western blot protocols, expected-band and isoform facts, troubleshooting for weak or shifted signal, and recommended anti-DRD1 WB antibodies. Everything you need to plan the experiment before you commit precious samples.
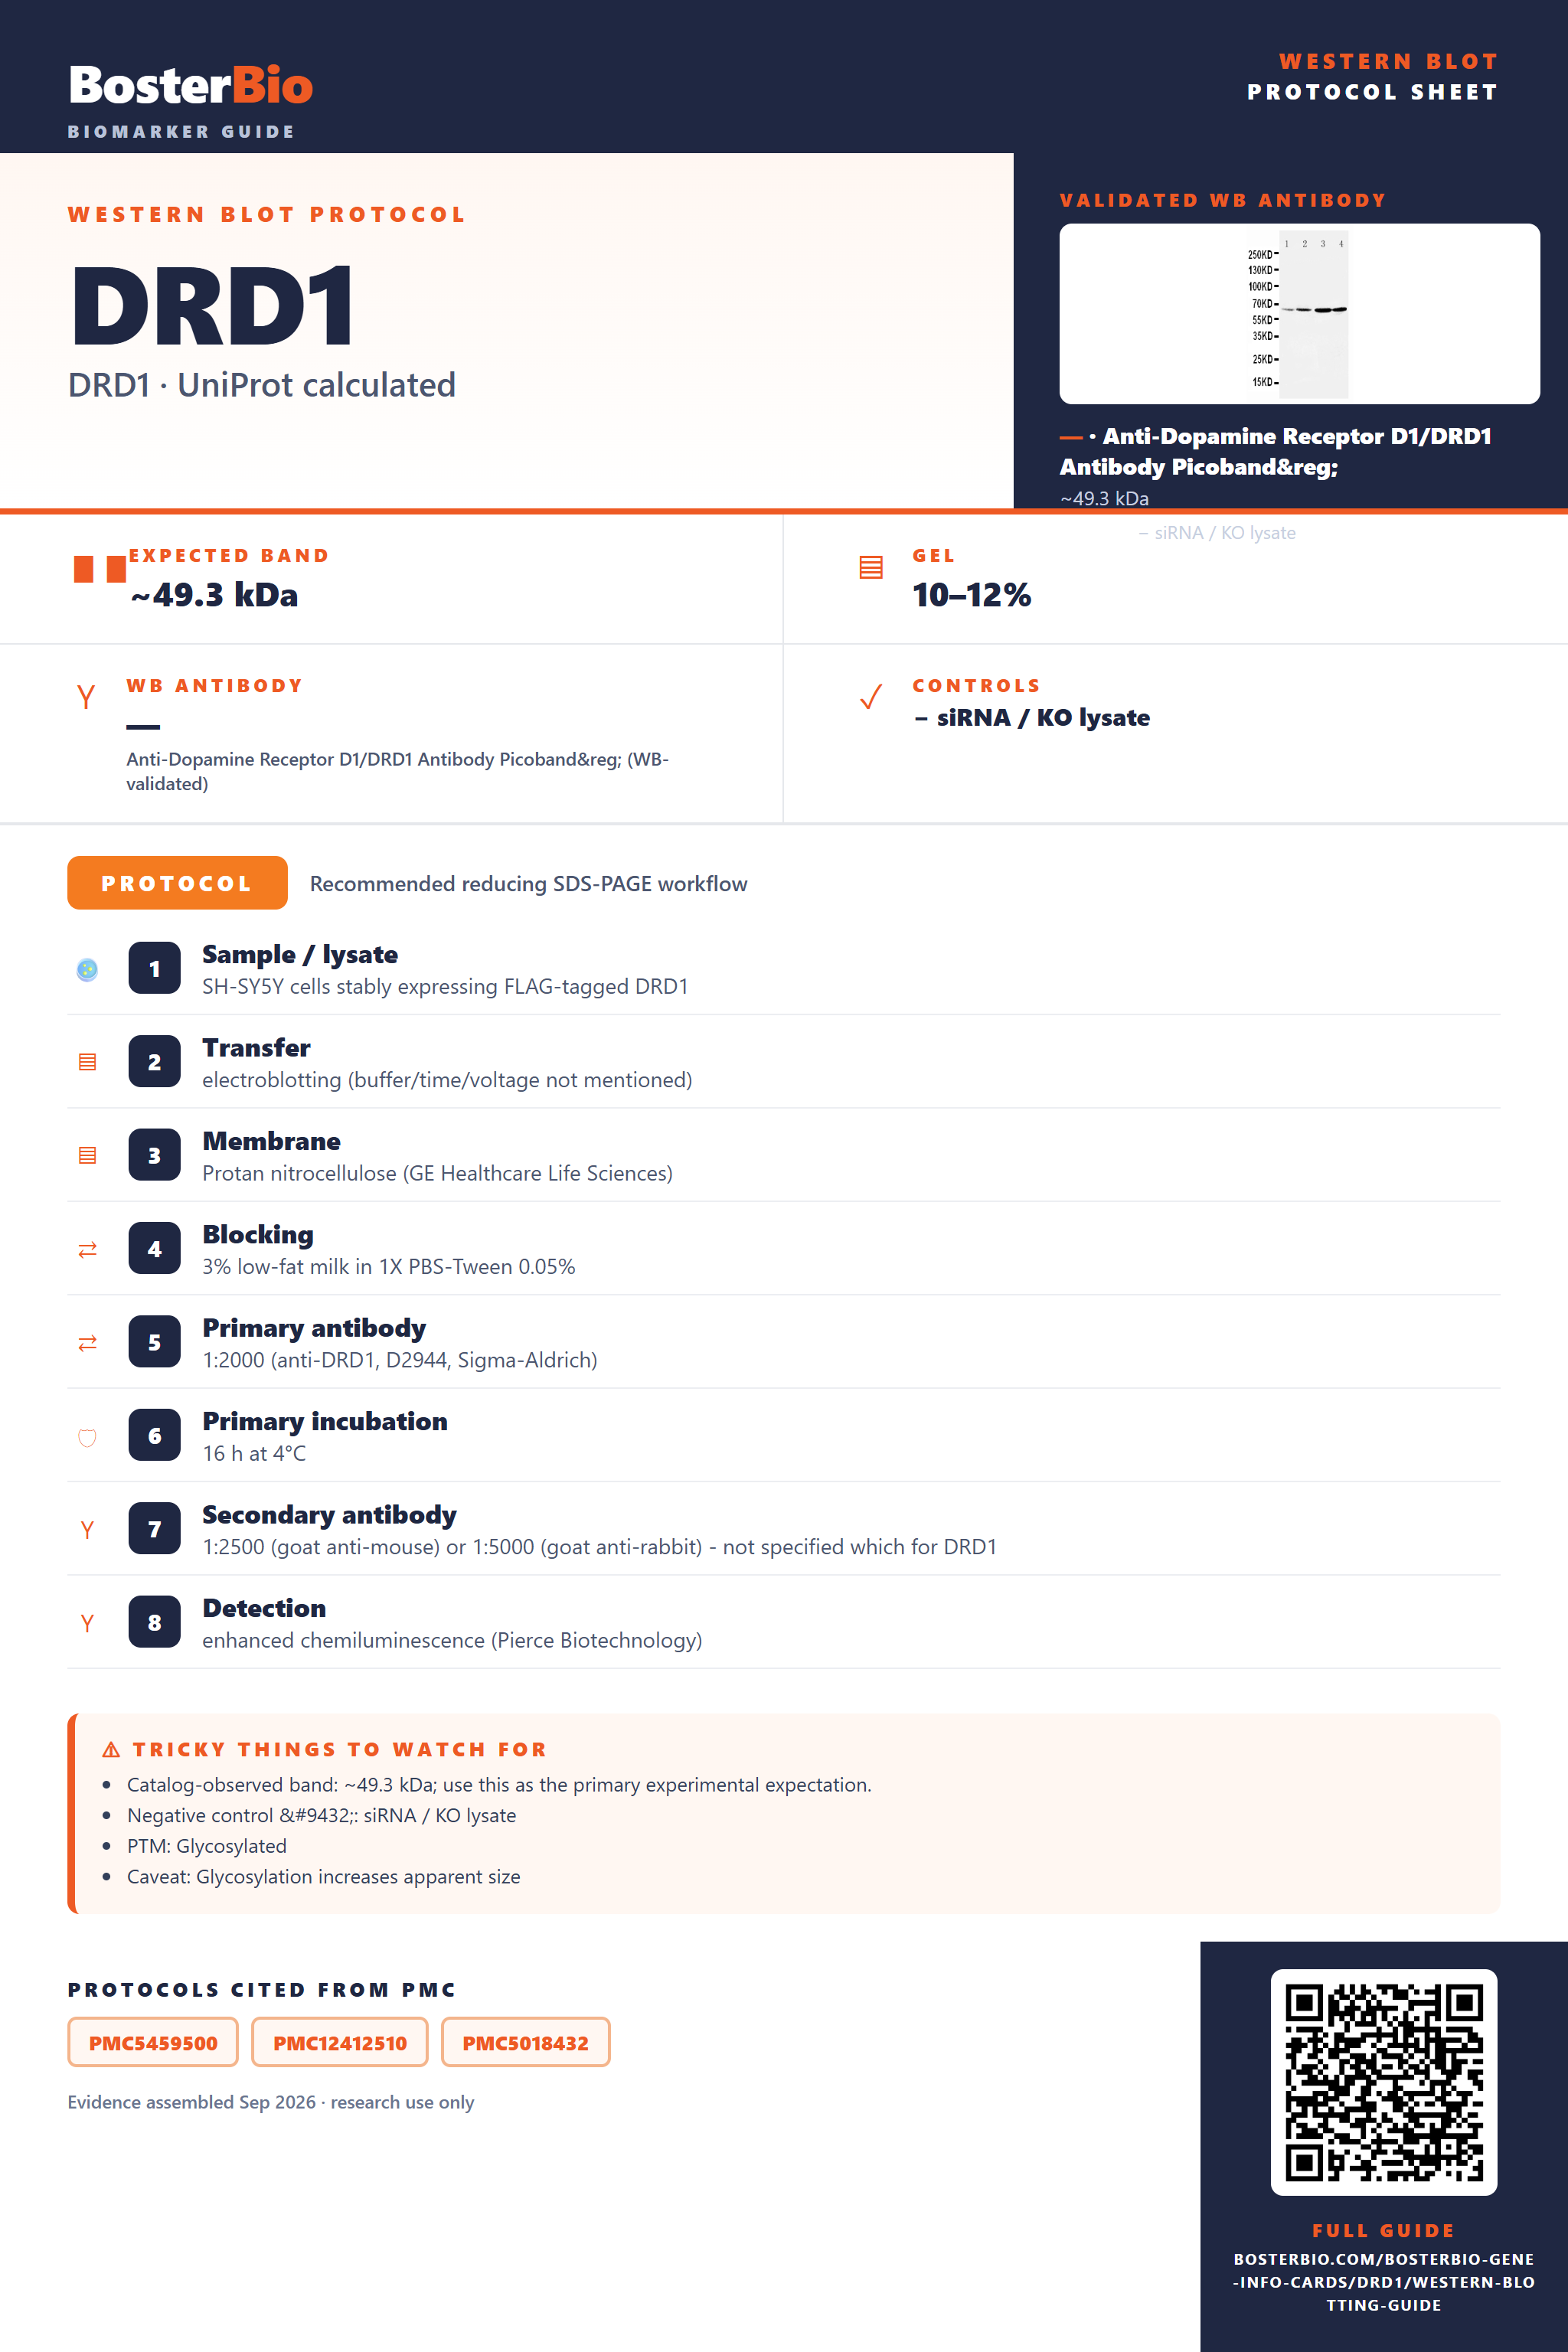
Expected bands, validated protocols, controls and antibodies — the at-a-glance facts below, then the full design guide.
| Expected band | ~49.3 kDa | |
| Gel | 10–12% | |
| Negative control | siRNA / KO lysate |
| PTM | Glycosylated | |
| Caveat | Glycosylation increases apparent size | |
| Regulation | LPS-induced | |
| Isoform | 1 isoform(s) |
Literature-validated Western blot parameters for DRD1 — gel percentage, transfer, blocking, antibody incubation and detection, extracted from published methods.
| Sample / lysate | SH-SY5Y cells stably expressing FLAG-tagged DRD1 |
| Transfer | electroblotting (buffer/time/voltage not mentioned) |
| Membrane | Protan nitrocellulose (GE Healthcare Life Sciences) |
| Blocking | 3% low-fat milk in 1X PBS-Tween 0.05% |
| Primary antibody | 1:2000 (anti-DRD1, D2944, Sigma-Aldrich) |
| Primary incubation | 16 h at 4°C |
| Secondary antibody | 1:2500 (goat anti-mouse) or 1:5000 (goat anti-rabbit) - not specified which for DRD1 |
| Detection | enhanced chemiluminescence (Pierce Biotechnology) |
DRD1 has a 49.3 kDa predicted backbone that typically runs somewhat higher and more diffuse on blots due to N-glycosylation at Asn5 and its multi-pass membrane topology.
| A single band around 49-55 kDa | Matches the 49.3 kDa predicted backbone with only a modest upward shift from its lone N-glycosylation site |
| Band appears broad or diffuse rather than sharp, spanning roughly 50-60 kDa | Heterogeneous N-linked glycosylation at Asn5 on the mature receptor produces glycoform microheterogeneity |
| A doublet with a lower, tighter band alongside a higher, more diffuse band | Reflects distinct maturation pools, an ER-resident core-glycosylated immature form versus a plasma-membrane-trafficked, fully glycosylated mature form |
| Slightly faster migration under non-reducing versus reducing sample buffer | The Cys96-Cys186 disulfide bond stabilizes a compact extracellular-loop fold that runs marginally faster when left intact |
| No smaller cleavage fragment below the main band | DRD1 has no annotated signal peptide or propeptide, so the translated chain is not proteolytically processed and full length is the mature form |
| Signal present in a membrane-enriched fraction but weak or absent in a cytosolic fraction | Consistent with DRD1 being a multi-pass membrane protein located at the plasma membrane and ER membrane rather than a soluble cytosolic protein |
| Predicted backbone mass (49.3 kDa, 446 aa) | Sets the baseline size expected under fully reduced, deglycosylated conditions |
| N-glycosylation at Asn5 | Adds carbohydrate mass and heterogeneity, shifting and broadening the band above the 49.3 kDa backbone |
| Disulfide bond Cys96-Cys186 | Stabilizes a compact extracellular-loop conformation that can shift mobility slightly when reduction is incomplete, though it is intrachain and does not generate a dimer-sized species |
| Multi-pass membrane topology (plasma membrane and ER membrane, multiple transmembrane helices) | Hydrophobic transmembrane helices bind SDS poorly, commonly causing this GPCR to migrate anomalously or smear/aggregate rather than resolve as one sharp band |
| ER membrane versus plasma membrane trafficking maturation | The immature ER pool with core glycosylation runs lower and tighter than the mature plasma-membrane pool with complex glycosylation, producing a size gradient rather than one fixed band |
| Situation | Likely cause | Next action |
|---|---|---|
| No band in lysate | DRD1 has low, tissue-restricted native expression and is not reliably detected outside receptor-enriched tissue | Confirm the assay with a known-positive tissue such as brain lysate and use a detergent-based lysis buffer suited to multi-pass membrane proteins |
| Band higher than expected | N-glycosylation at Asn5 combined with SDS-resistant aggregation typical of hydrophobic multi-pass membrane proteins | Treat lysate with PNGase F to confirm the glycan contribution and avoid boiling samples, heating at 37-50C instead to limit aggregation |
| Broad smear instead of sharp band | Heterogeneous glycoforms from the single N-glycosylation site plus partial membrane-protein aggregation | Deglycosylate with PNGase F or neuraminidase/glycosidase panel and use fresh reducing agent with gentle heating rather than boiling |
| Multiple bands | Coexisting ER core-glycosylated immature and plasma-membrane complex-glycosylated mature pools, or incomplete reduction of the Cys96-Cys186 disulfide | Repeat with PNGase F treatment to collapse glycoform bands and ensure fresh DTT or beta-mercaptoethanol for complete reduction |
| Weak or no signal | Standard aqueous lysis buffers extract this multi-pass membrane protein poorly | Use a membrane-protein-compatible detergent buffer, increase total protein loaded, and include a validated positive control tissue such as brain |

Comprehensive Human Protein Atlas IHC scoring per tissue. Rows are taken directly from the HPA tissue chart — click any row's HPA link to view the source.
| Tissue | Cell type | Level | Evidence | Source |
|---|
| Tissue | Cell type | Level | Evidence | Source |
|---|
Deeper troubleshooting and optimisation questions for DRD1, answered from its protein features.
BosterBio's DRD1 antibodies are among the best-performing WB antibodies on the market — well cited, thoroughly validated, and orthogonally cross-validated against negative tissues and complementary methods.
For DRD1 Western blotting, Boster's PA1571 antibody is the top recommended choice: extensively validated with published citations and orthogonally confirmed across rat testis, rat brain, U87, and HeLa lysates, delivering consistent, specific signal and reliable cross-tissue reproducibility for confident target detection.
Which to pick: Only one DRD1 antibody is catalogued: PA1571. Select it by default; its listing includes an actual Western blot validation image across rat testis, rat brain, U87, and HeLa lysates, confirming specificity and cross-sample reproducibility.