This website uses cookies to ensure you get the best experience on our website.


- Table of Contents
Plan paraffin EPHA3 IHC with the catalog antibody at 2–5 μg/ml (datasheet A02872-1). Compare kidney tubule cells with skeletal muscle myocytes, and score the cytoplasmic tissue pattern alongside the expected membrane location (HPA tissue IHC; UniProt).

Expected localisation, validated protocols, controls and antibodies — the at-a-glance facts below, then the full design guide.
| Expected localisation | Cytoplasmic tissue staining (HPA tissue IHC); membrane expected (UniProt) | |
| Staining pattern | Cytoplasmic staining in cells of most tissues (HPA tissue IHC) | |
| Antigen retrieval | EDTA pH 8.0 HIER, heat-mediated (datasheet A02872-1) | |
| Positive control | Adipose tissue+4 more · see all | |
| Negative control | Appendix+4 more · see all |
| Fixation | Keep fixation consistent across paraffin sections. (standard IHC practice; not target-specific) | |
| Caveat | Antibody staining has low consistency with RNA expression (HPA tissue IHC) | |
| Regulation | Highest expression in placenta (UniProt) | |
| Isoform / epitope | 2 isoforms; check which side of the membrane contains the epitope (UniProt) |
The catalog antibody’s IHC-P protocol (datasheet: A02872-1) is accompanied by published EPHA3 staining methods for gastric cancer, colorectal cancer, FFPE cell blocks, and mouse lung (PMC5408411; PMC5294649; PMC12272597; PMC4381338).
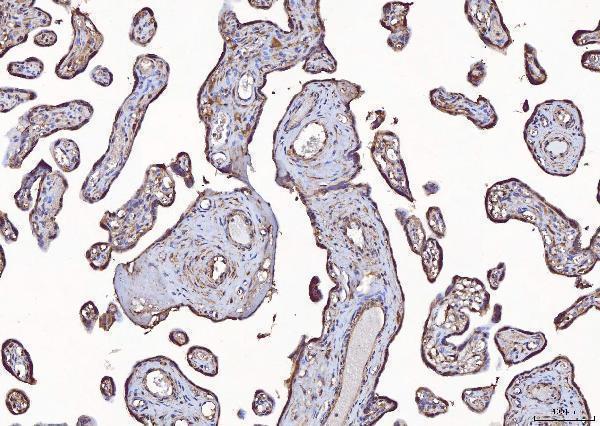
| Sample | Paraffin-embedded human placenta tissue; fixative not specified (datasheet A02872-1) |
| Fixation | Image fixative and duration unreported (datasheet A02872-1); verify before use. |
| Sectioning | 4–5 µm sections on charged slides (standard) |
| Deparaffinisation | Xylene, graded ethanol series to water (standard) |
| Antigen retrieval | Heat retrieval: EDTA pH 8.0 (datasheet A02872-1); 20 min, 95–100 °C (standard) |
| Peroxidase block | 3% H2O2, 10 min, room temperature (standard) |
| Blocking | 10% goat serum (datasheet A02872-1) |
| Primary antibody | Rabbit anti-EPHA3, 2-5 μg/ml (datasheet A02872-1) |
| Primary incubation | Overnight at 4 °C (datasheet A02872-1) |
| Detection | HRP-conjugated secondary, DAB chromogen (datasheet A02872-1) |
| Counterstain | Hematoxylin, blue, dehydrate and mount (standard) |
| Expected result | EPHA3-positive staining in adipocytes of adipose tissue (HPA tissue IHC: Medium). HPA tissue profile: Cytoplasmic expression in most tissues. No signal in the no-primary control. |
EPHA3 is a membrane receptor with an extracellular region and a cytoplasmic tail (UniProt P29320 topology). In tissue IHC, HPA reports predominantly cytoplasmic staining across most tissues, including medium staining in kidney tubule cells, cardiomyocytes and several epithelial or neuronal cell populations (HPA tissue IHC). HPA rates its tissue staining Approved, while noting low consistency with RNA expression (HPA tissue IHC reliability).
| Cytoplasmic staining in kidney tubule cells or cardiomyocytes, with some cell-edge accentuation. | Medium staining in these cells matches HPA tissue observations (HPA tissue IHC). Cell-edge signal is plausible for a transmembrane receptor (UniProt P29320 topology), but HPA's tissue profile is chiefly cytoplasmic (HPA tissue IHC). |
| Strong, isolated nuclear staining dominates the chromogenic section. | This does not match HPA's predominant tissue IHC profile and warrants scrutiny (HPA tissue IHC). ICC-IF reports some nucleoplasmic localisation, so nuclear signal alone cannot establish either an artefact or a valid tissue pattern (HPA subcellular ICC-IF). |
| Staining appears in bone marrow hematopoietic cells or pancreatic exocrine glandular cells. | HPA reports EPHA3 as not detected in these cells (HPA tissue IHC). Check for cross-reactivity or, with enzyme-based detection, endogenous enzyme activity before interpreting the signal as EPHA3; the HPA result is a reference pattern, not proof of absence. |
| Diffuse colour covers cells and surrounding tissue without a clear cellular boundary. | This is difficult to score against HPA's cellular staining profile (HPA tissue IHC). Review background controls, blocking and washing; diffuse colour alone does not identify EPHA3-positive cells. |
| No staining appears in kidney tubule cells in an otherwise evaluable section. | HPA reports medium staining in these cells (HPA tissue IHC). Review the IHC-validated antibody, retrieval and detection controls before calling the sample negative; HPA's low RNA–staining consistency also limits conclusions from a single section (HPA tissue IHC reliability). |
| Where should the IHC signal sit? | EPHA3 spans the membrane, with residues 21–541 extracellular and 566–983 cytoplasmic (UniProt P29320 topology). HPA nevertheless describes most tissue IHC staining as cytoplasmic (HPA tissue IHC); interpret membrane accentuation alongside that observed pattern. |
| How strong is the tissue reference? | HPA rates the tissue IHC profile Approved but reports low consistency between antibody staining and RNA expression (HPA tissue IHC reliability). Its cell-level observations guide comparison; they do not independently confirm every stained cell. |
| Can isoforms or processing change interpretation? | UniProt lists two isoforms and a signal peptide at residues 1–20 (UniProt P29320 isoforms and processing). The supplied evidence gives no antibody epitope, so it cannot establish which isoforms this IHC assay detects. |
| What does the ICC-IF pattern suggest? | HPA reports nuclear membrane, plasma membrane and cytosol as main ICC-IF locations, with nucleoplasm and actin filaments additionally observed (HPA subcellular ICC-IF). These cell-image findings provide context, not a paraffin IHC pattern or an IF protocol. |
| Does the record specify EPHA3 retrieval sensitivity? | No target-specific fixation or retrieval effect is supplied. Optimise antigen retrieval using routine IHC controls; neither HPA tissue staining nor UniProt topology establishes that a particular retrieval condition changes EPHA3 detection. |
| Situation | Likely cause | Next action |
|---|---|---|
| The expected kidney tubule signal is absent. | A failed staining run or unsuitable assay conditions are possible; HPA reports medium staining in kidney tubule cells (HPA tissue IHC). | Check a positive control, antibody incubation, retrieval and detection steps before scoring the section negative. |
| Chromogen appears in HPA not-detected cells. | Cross-reactivity or endogenous detection activity may contribute; HPA reports no signal in bone marrow hematopoietic cells and pancreatic exocrine glandular cells (HPA tissue IHC). | Compare an antibody-omission control and, if using peroxidase detection, an appropriate endogenous-peroxidase control. |
| The section has broad, hazy background. | Non-specific binding, inadequate washing or overdeveloped chromogen may obscure cellular staining; HPA describes a cellular tissue profile (HPA tissue IHC). | Review blocking, washes and development time against a control section; score only resolvable cellular signal. |
| Only nuclei show strong IHC signal. | This differs from the chiefly cytoplasmic tissue IHC profile (HPA tissue IHC), although nucleoplasmic signal is reported in ICC-IF (HPA subcellular ICC-IF). | Check morphology and background controls, then avoid assigning the nuclear-only pattern to EPHA3 from IHC appearance alone. |
| Staining varies among tissue regions or cell types. | EPHA3 staining is cell-dependent in the HPA tissue panel, and HPA notes low RNA–staining consistency (HPA tissue IHC). | Score named cell populations separately, using matched morphology and controls rather than a whole-section average. |
| Membrane staining is weak despite clear cytoplasmic colour. | HPA describes cytoplasmic expression in most tissues (HPA tissue IHC), while UniProt places EPHA3 at the cell membrane (UniProt P29320 subcellular location). | Record the observed compartment and cell type; do not reject an otherwise control-supported tissue pattern solely because membrane outlining is faint. |


Comprehensive Human Protein Atlas IHC scoring per tissue (reliability: Approved — Low consistency between antibody staining and RNA expression data.). Rows are taken directly from the HPA tissue chart — click any row's HPA link to view the source.
| Tissue | Cell type | Level | Evidence | Source |
|---|---|---|---|---|
| Adipose tissue | Adipocytes | Medium | Protein (IHC) | HPA → |
| Bronchus | Respiratory epithelial cells | Medium | Protein (IHC) | HPA → |
| Caudate | Neuronal cells | Medium | Protein (IHC) | HPA → |
| Cerebral cortex | Neuronal cells | Medium | Protein (IHC) | HPA → |
| Duodenum | Glandular cells | Medium | Protein (IHC) | HPA → |
| Tissue | Cell type | Level | Evidence | Source |
|---|---|---|---|---|
| Appendix | Glandular cells | Not detected | Protein (IHC) | HPA → |
| Bone marrow | Hematopoietic cells | Not detected | Protein (IHC) | HPA → |
| Pancreas | Exocrine glandular cells | Not detected | Protein (IHC) | HPA → |
| Skeletal muscle | Myocytes | Not detected | Protein (IHC) | HPA → |
| Skin | Fibroblasts | Not detected | Protein (IHC) | HPA → |
Troubleshoot EPHA3 staining in paraffin sections by checking retrieval, compartment, controls and scoring before interpreting a chromogenic signal.
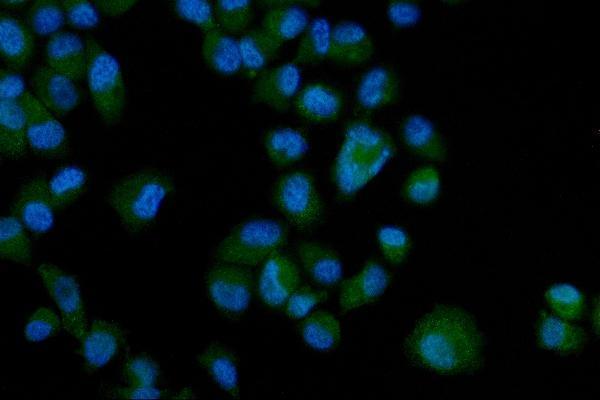
A02872-1 has human paraffin-section IHC data from placenta and IF/ICC data from PC-3 cells (catalog image captions).
A02872-1 was tested for IHC on a human placenta paraffin section (catalog IHC image caption). The same SKU was tested for IF/ICC in PC-3 cells (catalog IF image caption).
Which to pick: Choose A02872-1 for human tissue IHC when using paraffin sections; its IHC image documents placenta staining, but does not report the fixative (catalog IHC image caption). For IF/ICC, A02872-1 has a PC-3 cell image and a listed working concentration of 5 μg/ml (catalog IF image caption; datasheet). No cross-species choice is supported: A02872-1 lists human reactivity only, and its clonality is unreported (catalog reactivity and clone fields).