This website uses cookies to ensure you get the best experience on our website.


- Table of Contents
Use hepatocytes and kidney proximal tubules as high-staining reference cells for FAH in paraffin-section IHC (HPA tissue IHC). The catalog antibody has an IHC dilution range of 2–5 μg/ml (datasheet A02072-1), and the expected liver and kidney pattern is cytoplasmic (HPA tissue IHC).

Expected localisation, validated protocols, controls and antibodies — the at-a-glance facts below, then the full design guide.
| Expected localisation | Cytoplasmic in liver and kidney (HPA tissue IHC) | |
| Staining pattern | Hepatocytes and proximal tubules stain cytoplasm (HPA tissue IHC) | |
| Antigen retrieval | EDTA pH 8.0 HIER, heat-mediated (datasheet A02072-1) | |
| Positive control | Cerebellum+4 more · see all | |
| Negative control | Adipose tissue+4 more · see all |
| Fixation | Keep fixation consistent across samples (standard IHC practice; not target-specific) | |
| Caveat | High nuclear staining in Bergmann glia is also reported (HPA tissue IHC) | |
| Regulation | Liver-enhanced expression (HPA tissue RNA) | |
| Isoform / epitope | 2 isoforms; epitope coverage is unspecified (UniProt) |
The catalog antibody’s IHC-P protocol is accompanied by four published FAH immunohistochemistry protocols for liver or liver and kidney sections (PMC5957080; PMC4561890; PMC4096906; PMC3786690).
| Sample | Paraffin-embedded human liver cancer tissue; fixative not specified (datasheet A02072-1) |
| Fixation | Image fixative and duration unreported (datasheet A02072-1); verify before use. |
| Sectioning | 4–5 µm sections on charged slides (standard) |
| Deparaffinisation | Xylene, graded ethanol series to water (standard) |
| Antigen retrieval | Heat retrieval: EDTA pH 8.0 (datasheet A02072-1); 20 min, 95–100 °C (standard) |
| Peroxidase block | 3% H2O2, 10 min, room temperature (standard) |
| Blocking | 10% goat serum (datasheet A02072-1) |
| Primary antibody | Rabbit anti-FAH, 2-5 μg/ml (datasheet A02072-1) |
| Primary incubation | Overnight at 4 °C (datasheet A02072-1) |
| Detection | HRP-conjugated secondary, DAB chromogen (datasheet A02072-1) |
| Counterstain | Hematoxylin, blue, dehydrate and mount (standard) |
| Expected result | FAH-positive staining in bergmann glia - nucleus of cerebellum (HPA tissue IHC: High). HPA tissue profile: Cytoplasmic expression in the liver and kidney. No signal in the no-primary control. |
FAH should show predominantly cytoplasmic staining in hepatocytes and kidney proximal tubules (HPA tissue IHC: High in both). Liver and kidney are its main expression sites (UniProt P16930 tissue specificity). FAH has no annotated transmembrane segment, while UniProt assigns no subcellular location (UniProt P16930 topology and subcellular record). HPA rates its tissue IHC evidence Enhanced, with medium consistency between staining and RNA data (HPA tissue IHC reliability).
| Strong cytoplasmic stain in hepatocytes and proximal tubule cell bodies. | This matches the principal positive pattern (HPA tissue IHC: High in hepatocytes and proximal tubules; cytoplasmic profile). Compare the signal with tissue architecture and a matched negative control before scoring it as specific staining (general IHC practice). |
| Predominantly nuclear stain in liver or kidney, with little cytoplasmic signal. | Investigate a compartment mismatch: HPA describes cytoplasmic tissue staining, although it also reports nuclear Bergmann glia staining and additional nucleoplasmic localization by ICC-IF (HPA tissue IHC; HPA subcellular). Nuclear signal alone therefore does not establish either specificity or artefact; check the cell type and controls. |
| Strong stain in a cell type recorded as undetected, such as adipocytes. | Treat this as unexpected for that cell type (HPA tissue IHC: adipocytes Not detected). Compare with the no-primary control and the staining in known-positive tissue; persistent staining may reflect antibody cross-reactivity, while control staining may reflect endogenous detection activity (general IHC practice). |
| Diffuse stain across cells and extracellular spaces, obscuring cell boundaries. | This does not reproduce HPA's cell-associated cytoplasmic liver and kidney profile (HPA tissue IHC). Assess background with a no-primary control and review blocking, washes, and detection conditions (general IHC practice); the appearance alone cannot identify which step caused it. |
| No signal in hepatocytes or kidney proximal tubules. | A negative result in these reference-positive cells needs technical review before biological interpretation (HPA tissue IHC: High in both). Confirm tissue integrity and assay controls, then review retrieval, antibody dilution, and detection conditions as general IHC variables; no FAH-specific retrieval condition is supplied. |
| Tissue and cell selection | Use liver hepatocytes or kidney proximal tubules to judge whether the assay can reveal the expected pattern (HPA tissue IHC: High). HPA also reports Medium staining in several other cell types and Low staining in listed glandular cells, so signal strength should be interpreted by cell type (HPA tissue IHC). |
| Antibody evidence | HPA lists HPA041370 and HPA044093 as IHC Enhanced (HPA antibodies). This supports the reported tissue pattern, while the tissue profile's stated RNA agreement is medium; retain slide-level controls when interpreting an unexpected distribution (HPA tissue IHC reliability; general IHC practice). |
| Compartment and IF/ICC Q&A | What should IF/ICC show? Mainly cytosol, with additional nucleoplasm (HPA subcellular). In tissue IHC, HPA describes cytoplasmic liver and kidney staining but also High nuclear staining in Bergmann glia (HPA tissue IHC). These observations are context-specific; no IF/ICC protocol is supplied here. |
| Isoforms and epitope coverage | UniProt lists two FAH isoforms (UniProt P16930 isoforms). The supplied records give no antibody epitope or isoform-specific staining result, so the observed IHC pattern cannot be assigned to either isoform from these data alone. |
| Fixation sensitivity | Target-specific fixation effects are not established by the supplied assay evidence. Verify with a matched IHC source before attributing a result to fixation. |
| Situation | Likely cause | Next action |
|---|---|---|
| Positive liver or kidney section is blank. | The result conflicts with HPA's High staining in hepatocytes and proximal tubules; the cause cannot be assigned from the blank slide alone (HPA tissue IHC). | Check tissue preservation, a working detection control, primary antibody use, and chromogen development; then optimize retrieval and dilution as general IHC practice. No FAH-specific condition is supplied. |
| Only weak, hard-to-score stain appears in expected-positive cells. | A weak result differs from the HPA High reference pattern, although slide conditions and scoring can affect its visibility (HPA tissue IHC; general IHC practice). | Compare hepatocytes or proximal tubules with a matched negative control; review retrieval, dilution, incubation, and detection settings as general IHC practice without assuming a FAH-specific fixation effect. |
| Nuclear staining dominates in liver or kidney. | That distribution differs from HPA's cytoplasmic tissue profile there; HPA's Bergmann glia and ICC-IF observations show that nuclear FAH-associated signal can occur in other contexts (HPA tissue IHC; HPA subcellular). | Identify the stained cell type, inspect the cytoplasmic signal, and compare controls before calling the nuclear stain artefactual or specific (general IHC practice). |
| Adipocytes or another HPA-undetected cell type stain strongly. | The cell-specific result conflicts with HPA's Not detected entry and may reflect cross-reactivity or detection background (HPA tissue IHC; general IHC practice). | Review morphology alongside a positive reference tissue and no-primary control; if the no-primary slide stains, investigate endogenous detection activity (general IHC practice). |
| Brown signal covers much of the section without a clear cellular pattern. | Widespread background can obscure the expected cytoplasmic, cell-associated result (HPA tissue IHC; general IHC practice). | Inspect a no-primary control, wash stringency, blocking, and chromogen development as general IHC checks; score FAH only where cell boundaries and the expected compartment remain interpretable. |
| Liver and kidney differ markedly in staining intensity. | HPA classifies hepatocytes and proximal tubules as High, but that category does not specify equal intensity on every section (HPA tissue IHC). | Compare the named cell populations rather than whole-section color, then check matched processing and assay controls before attributing the difference to FAH expression (general IHC practice). |
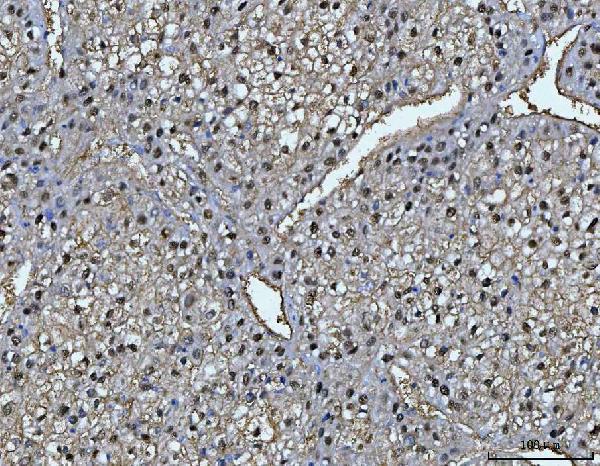
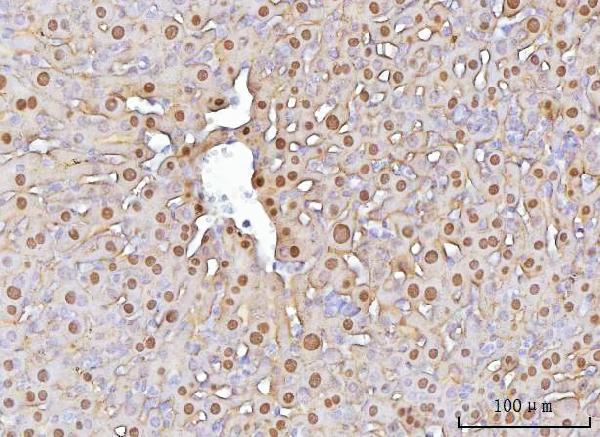


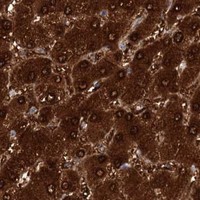
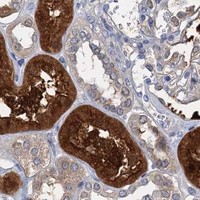


Comprehensive Human Protein Atlas IHC scoring per tissue (reliability: Enhanced — Medium consistency between antibody staining and RNA expression data.). Rows are taken directly from the HPA tissue chart — click any row's HPA link to view the source.
| Tissue | Cell type | Level | Evidence | Source |
|---|---|---|---|---|
| Cerebellum | Bergmann glia - nucleus | High | Protein (IHC) | HPA → |
| Kidney | Proximal tubules (cell body) | High | Protein (IHC) | HPA → |
| Liver | Hepatocytes | High | Protein (IHC) | HPA → |
| Adrenal gland | Glandular cells | Medium | Protein (IHC) | HPA → |
| Fallopian tube | Ciliated cells (tip of cilia) | Medium | Protein (IHC) | HPA → |
| Tissue | Cell type | Level | Evidence | Source |
|---|---|---|---|---|
| Adipose tissue | Adipocytes | Not detected | Protein (IHC) | HPA → |
| Bone marrow | Hematopoietic cells | Not detected | Protein (IHC) | HPA → |
| Bronchus | Basal cells | Not detected | Protein (IHC) | HPA → |
| Caudate | Glial cells | Not detected | Protein (IHC) | HPA → |
| Cerebral cortex | Endothelial cells | Not detected | Protein (IHC) | HPA → |
Troubleshoot FAH staining in paraffin sections by checking retrieval, compartment, cell identity and controls before comparing staining intensity.
The catalog antibody has IHC data from paraffin sections of human liver cancer tissue and mouse and rat liver (catalog IHC captions). No IF data are supplied (catalog payload).
A02072-1 is the only SKU listed and is validated for IHC in human, mouse and rat (catalog applications and reactivity). Its IHC captions show paraffin sections of human liver cancer tissue, mouse liver and rat liver (catalog IHC captions).
Which to pick: Choose A02072-1 for paraffin-section IHC; its captions document staining at 2 μg/ml after heat retrieval in EDTA at pH 8.0 (A02072-1 IHC captions). It is also the cross-species choice for human, mouse and rat IHC (catalog reactivity and IHC captions). No IF/ICC-validated SKU is listed (catalog applications and IF image alts); the fixative used for the pictured paraffin sections is unreported (A02072-1 IHC captions).