This website uses cookies to ensure you get the best experience on our website.


- Table of Contents
Plan paraffin-section FCGR2A IHC using the catalog antibody at 0.5–1 µg/mL (datasheet A01450-1). Expect cytoplasmic staining in macrophages and hematopoietic cells, while interpreting signal in light of the HPA warning that staining may represent proteins from more than one gene (HPA tissue IHC).

Expected localisation, validated protocols, controls and antibodies — the at-a-glance facts below, then the full design guide.
| Expected localisation | Cytoplasmic tissue signal; cell membrane protein (HPA tissue IHC; UniProt) | |
| Staining pattern | Cytoplasmic hematopoietic cells, macrophages and lymphoid subsets (HPA tissue IHC) | |
| Antigen retrieval | Citrate pH 6 HIER, heat-mediated (datasheet A01450-1) | |
| Positive control | Endometrium+4 more · see all | |
| Negative control | Adipose tissue+4 more · see all |
| Fixation | Keep fixation consistent across samples (standard IHC practice; not target-specific) | |
| Caveat | Staining may reflect proteins from more than one gene (HPA tissue IHC) | |
| Regulation | Immune-cell mix may shift tissue signal (HPA tissue IHC) | |
| Isoform / epitope | 2 isoforms; check extracellular versus cytoplasmic epitope (UniProt) |
The catalog antibody uses citrate pH 6 retrieval (datasheet A01450-1). Three published breast cancer IHC protocols add sample and detection details, with dilution where reported (PMC2987696; PMC2976659; PMC2935495).
| Sample | Paraffin-embedded human lung cancer tissue; fixative not specified (datasheet A01450-1) |
| Fixation | Image fixative and duration unreported (datasheet A01450-1); verify before use. |
| Sectioning | 4–5 µm sections on charged slides (standard) |
| Deparaffinisation | Xylene, graded ethanol series to water (standard) |
| Antigen retrieval | Heat retrieval: Citrate pH 6, 20 min (datasheet A01450-1) |
| Peroxidase block | 3% H2O2, 10 min, room temperature (standard) |
| Blocking | 10% goat serum (datasheet A01450-1) |
| Primary antibody | Rabbit anti-FCGR2A, 1μg/ml (datasheet A01450-1) |
| Primary incubation | Overnight at 4 °C (datasheet A01450-1) |
| Detection | Streptavidin-biotin complex (SABC), DAB chromogen (datasheet A01450-1) |
| Counterstain | Hematoxylin, blue, dehydrate and mount (standard) |
| Expected result | FCGR2A-positive staining in ciliated epithelial cells of endometrium (HPA tissue IHC: High). HPA tissue profile: Cytoplasmic expression in hematopoietic cells, macrophages and subsets of lymphoid cells. No signal in the no-primary control. |
FCGR2A is a cell membrane receptor with an extracellular region spanning residues 34–217 and a transmembrane segment at 218–240 (UniProt P12318 topology). In tissue IHC, expect staining in macrophages and other hematopoietic cells; HPA also describes cytoplasmic staining in these populations (HPA tissue IHC: Supported). Interpret that pattern cautiously because the HPA tissue assessment warns that its antibodies can target proteins from more than one gene (HPA tissue IHC reliability).
| Lung macrophages stain strongly, while nearby respiratory epithelial cells are unstained. | This matches a useful cell-level contrast: lung macrophages are High (HPA tissue IHC), and bronchial respiratory epithelial cells are Not detected (HPA tissue IHC). Judge the positive cells by their identity and distribution, then check whether the staining pattern is consistent across the section. |
| Positive cells show a membrane outline, with some cytoplasmic staining. | Membrane staining fits receptor topology (UniProt P12318 topology). Cytoplasmic staining also appears in HPA tissue IHC, which describes expression in hematopoietic cells, macrophages and subsets of lymphoid cells (HPA tissue IHC profile). Cytoplasmic signal alone therefore does not establish an artefact; compare it with cell-level controls. |
| Signal is confined to nuclei or appears in a compartment unrelated to the expected cellular pattern. | A purely nuclear pattern is unsupported by the reported membrane location (UniProt P12318 subcellular location) and HPA tissue IHC profile. Treat it as a suspect result, check the negative control and tissue morphology, and reassess antibody and detection specificity before calling cells positive. |
| Strong staining appears broadly in cells expected to be unstained, or colour covers the section diffusely. | Broad signal in bronchial respiratory epithelium conflicts with its Not detected HPA result (HPA tissue IHC). Possible technical contributors include nonspecific antibody binding, Fc-mediated reagent binding or endogenous chromogenic activity; diffuse colour can also obscure genuine positive macrophages. Compare appropriate control sections before assigning cell-level positivity. |
| No signal is visible in lung macrophages or other selected positive cells. | Lung macrophages are a High reference population (HPA tissue IHC). Absence there makes the run difficult to interpret. First confirm that macrophages are present in the section, then review the catalog antibody's IHC-P instructions, detection reagents and control staining; do not infer FCGR2A absence from one failed run. |
| Which compartment should guide IHC interpretation? | FCGR2A has an extracellular region at 34–217 and one transmembrane segment at 218–240 (UniProt P12318 topology). HPA nevertheless reports cytoplasmic tissue staining (HPA tissue IHC profile). Use the stained cell population alongside compartment; topology alone cannot prescribe the exact appearance of a chromogenic paraffin section. |
| Which cells offer the clearest tissue contrast? | Lung macrophages are High, bone marrow hematopoietic cells are Medium, and bronchial respiratory epithelial cells are Not detected (HPA tissue IHC). These are cell-specific observations, so a positive immune-cell population does not imply that every cell in the tissue should stain. |
| How much specificity does the HPA pattern establish? | The tissue assessment is Supported, with medium consistency between staining and RNA, and warns of antibodies targeting more than one gene (HPA tissue IHC reliability). HPA010718 and HPA014730 each have Supported IHC status (HPA antibody validation). A matching pattern supports interpretation but cannot, by itself, prove FCGR2A-specific binding. |
| Do the reported isoforms determine the expected staining? | UniProt lists 2 isoforms (UniProt P12318 isoforms). The supplied evidence gives no antibody epitope or isoform coverage, so it cannot establish whether an IHC result represents either isoform individually. Do not explain a missing tissue signal by isoform choice without separate antibody-specific evidence. |
| What should an IF/ICC image show? | HPA reports a mainly plasma membrane location, with an additional uncertain Golgi location; its ICC-IF summary cautions that the antibodies can target proteins from multiple genes (HPA subcellular ICC-IF). That observation can inform localisation, but it does not validate an IHC-P staining pattern or supply an IF/ICC protocol. |
| Situation | Likely cause | Next action |
|---|---|---|
| The expected lung macrophage control is blank. | The run may have failed, or the examined area may lack identifiable macrophages; their reported level is High (HPA tissue IHC). | Check cell identity and section quality, then follow the catalog antibody's IHC-P instructions and verify that the detection control worked. Reassess the result only after a known-positive cell population stains. |
| Respiratory epithelium stains as strongly as nearby immune cells. | Bronchial respiratory epithelial cells are Not detected in HPA tissue IHC; widespread signal could reflect nonspecific binding or detection background rather than the expected cell distribution. | Compare a matched negative control and the positive macrophages. Review blocking, antibody concentration and detection steps as general IHC checks before assigning epithelial positivity. |
| A nuclear-only signal dominates the section. | This localisation lacks support from the membrane assignment (UniProt P12318 subcellular location) and the HPA tissue IHC profile. | Inspect the negative control and morphology, and repeat with the IHC-validated antibody's documented conditions if needed. Treat the nuclear signal as unconfirmed until the expected cell-level pattern is demonstrated. |
| Diffuse chromogen makes individual cells hard to score. | Background from detection reagents, incomplete washing or endogenous enzyme activity can obscure cell-associated staining in chromogenic IHC. | Review wash and detection steps, and use a control lacking primary antibody to assess reagent background. Apply an appropriate endogenous-activity block if the detection chemistry requires one. |
| Immune-rich areas stain broadly, with weak separation between cells. | FCGR2A binds the Fc region of IgG (UniProt P12318 function), so Fc-mediated binding of assay reagents is a plausible contributor; HPA also cautions about cross-gene antibody recognition (HPA tissue IHC reliability). | Check a matched negative control and consider a suitable Fc-blocking step as general IHC practice. Score only identifiable cells with a convincing pattern, using the positive tissue reference for comparison. |
| A low-level tissue or an IF/ICC image disagrees with the IHC result. | Placental trophoblastic cells are Low in tissue IHC (HPA tissue IHC), while the HPA ICC-IF summary describes mainly plasma membrane signal with an uncertain additional Golgi location (HPA subcellular ICC-IF). These observations have different contexts. | Confirm the cell type, assay and antibody validation status before comparing results. Use the tissue IHC evidence to judge the chromogenic section; keep the IF/ICC observation as a localisation reference. |
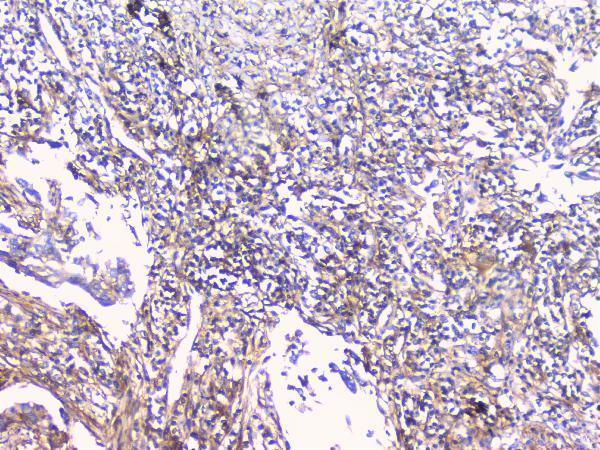
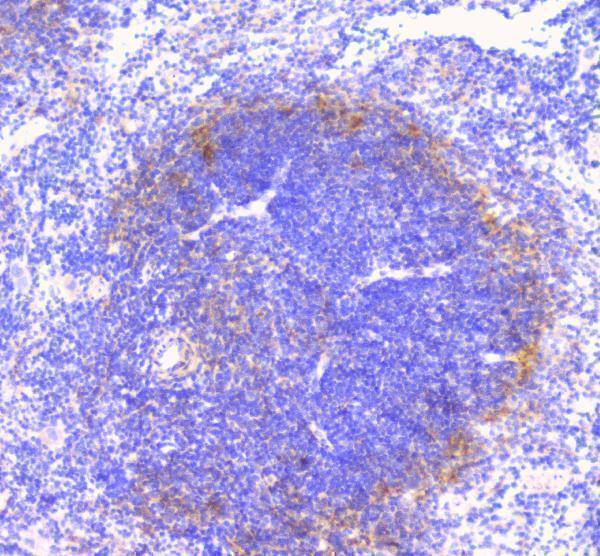


Comprehensive Human Protein Atlas IHC scoring per tissue (reliability: Supported — Medium consistency between antibody staining and RNA expression data. Caution, targets protein from more than one gene. Antibody staining in cells/structures not annotated, view images.). Rows are taken directly from the HPA tissue chart — click any row's HPA link to view the source.
| Tissue | Cell type | Level | Evidence | Source |
|---|---|---|---|---|
| Endometrium | Ciliated epithelial cells | High | Protein (IHC) | HPA → |
| Lung | Macrophages | High | Protein (IHC) | HPA → |
| Bone marrow | Hematopoietic cells | Medium | Protein (IHC) | HPA → |
| Spleen | Cells in red pulp | Medium | Protein (IHC) | HPA → |
| Tonsil | Non-germinal center cells | Medium | Protein (IHC) | HPA → |
| Tissue | Cell type | Level | Evidence | Source |
|---|---|---|---|---|
| Adipose tissue | Adipocytes | Not detected | Protein (IHC) | HPA → |
| Adrenal gland | Glandular cells | Not detected | Protein (IHC) | HPA → |
| Appendix | Glandular cells | Not detected | Protein (IHC) | HPA → |
| Bronchus | Respiratory epithelial cells | Not detected | Protein (IHC) | HPA → |
| Cervix | Glandular cells | Not detected | Protein (IHC) | HPA → |
Troubleshoot FCGR2A chromogenic IHC by checking retrieval, cell identity, membrane localisation and assay controls together (UniProt P12318; HPA tissue IHC).
A01450-1 has IHC images from human lung cancer, mammary cancer and placenta sections, and mouse spleen sections (catalog IHC captions). The catalog lists rat reactivity without a rat IHC image (catalog reactivity; catalog IHC captions).
A01450-1 is the SKU with a rendered IHC card; its figure shows a paraffin section of human lung cancer (A01450-1 figure caption). Its additional IHC captions show human mammary cancer and placenta sections and a mouse spleen section (A01450-1 IHC captions).
Which to pick: Choose A01450-1 for paraffin-section IHC: its caption documents citrate retrieval at pH 6 for 20 minutes and primary antibody at 1 µg/mL; the fixative is unreported (A01450-1 figure caption). No catalog SKU lists IF/ICC or provides an IF image, so neither has documented IF/ICC validation here (catalog applications and IF image fields). For cross-species work, A01450-1 lists human, mouse and rat reactivity, while M01450 lists human only; the A01450-1 IHC captions show human and mouse sections, with no rat IHC image (catalog reactivity; A01450-1 IHC captions).