This website uses cookies to ensure you get the best experience on our website.


- Table of Contents
Plan chromogenic GANAB IHC in paraffin sections using placental trophoblasts as a high-staining reference (HPA tissue IHC). Assess cytoplasmic staining while accounting for cell types with no detectable signal (HPA tissue IHC).

Expected localisation, validated protocols, controls and antibodies — the at-a-glance facts below, then the full design guide.
| Expected localisation | Cytoplasmic tissue staining (HPA tissue IHC); ER/Golgi protein localization (UniProt) | |
| Staining pattern | Broad cytoplasmic staining; high in placental trophoblasts (HPA tissue IHC) | |
| Antigen retrieval | EDTA pH 8.0 HIER, heat-mediated (datasheet A09668-2) | |
| Positive control | Appendix+4 more · see all | |
| Negative control | Adipose tissue+4 more · see all |
| Fixation | Keep fixation consistent across paraffin sections. (standard IHC practice; not target-specific) | |
| Caveat | Some cell types lack signal despite the broad tissue profile (HPA tissue IHC) | |
| Regulation | No condition-dependent regulation specified (UniProt) | |
| Isoform / epitope | 3 isoforms; epitope differences are unreported (UniProt) |
The catalog antibody uses EDTA pH 8.0 heat retrieval (datasheet A09668-2). The published IHC protocols below cover colorectal cancer, urothelial carcinoma, and mouse and human paraffin sections (PMC13526586; PMC9316353; PMC10535707).
| Sample | Paraffin-embedded human placenta tissue; fixative not specified (datasheet A09668-2) |
| Fixation | Image fixative and duration unreported (datasheet A09668-2); verify before use. |
| Sectioning | 4–5 µm sections on charged slides (standard) |
| Deparaffinisation | Xylene, graded ethanol series to water (standard) |
| Antigen retrieval | Heat retrieval: EDTA pH 8.0 (datasheet A09668-2); 20 min, 95–100 °C (standard) |
| Peroxidase block | 3% H2O2, 10 min, room temperature (standard) |
| Blocking | 10% goat serum (datasheet A09668-2) |
| Primary antibody | Rabbit anti-GANAB, 2-5 μg/ml (datasheet A09668-2) |
| Primary incubation | Overnight at 4 °C (datasheet A09668-2) |
| Detection | HRP-conjugated secondary, DAB chromogen (datasheet A09668-2) |
| Counterstain | Hematoxylin, blue, dehydrate and mount (standard) |
| Expected result | GANAB-positive staining in glandular cells of appendix (HPA tissue IHC: High). HPA tissue profile: Ubiquitous cytoplasmic expression. No signal in the no-primary control. |
GANAB is an endoplasmic reticulum protein also annotated in the Golgi apparatus; it has no transmembrane segment (UniProt Q14697 subcellular location and topology). In paraffin-section IHC, expect cytoplasmic staining across many cell types, with high staining reported in appendix glandular cells, placental trophoblastic cells and cerebral cortex neurons (HPA tissue IHC). HPA calls the tissue profile ubiquitous cytoplasmic expression, with Enhanced reliability but medium consistency between staining and RNA data (HPA tissue IHC).
| Cytoplasmic staining in appendix glandular cells or placental trophoblastic cells (HPA: High in each). | This matches observed positive cell populations (HPA tissue IHC). An endoplasmic reticulum–associated distribution is plausible (UniProt Q14697; HPA subcellular ICC-IF), but chromogenic IHC may not resolve organelle boundaries (general IHC practice). |
| Predominantly nuclear or sharply cell-surface-only signal, without convincing cytoplasmic staining. | Recheck specificity: GANAB is annotated in the endoplasmic reticulum and Golgi apparatus and lacks a transmembrane segment (UniProt Q14697). A nuclear-only or surface-only pattern is unsupported by the supplied localization evidence; compare with a positive tissue and a negative reagent control (general IHC practice). |
| Strong signal in adipocytes or cardiomyocytes while nearby structures vary in staining. | Those specific cells were not detected by HPA tissue IHC (HPA: adipocytes and cardiomyocytes, Not detected). Consider cross-reactivity or endogenous detection activity before calling them GANAB-positive (general IHC practice); a negative call for these cells does not describe every cell in either tissue. |
| Uniform chromogen across cells, stroma and section edges, obscuring cellular boundaries. | The result cannot establish the reported cytoplasmic cell pattern (HPA tissue IHC). Check nonspecific reagent binding, endogenous enzyme activity and detection conditions with appropriate controls (general IHC practice); background intensity alone does not identify its cause. |
| No detectable cytoplasmic signal in appendix glandular cells or placental trophoblastic cells. | This conflicts with HPA's High observations for those cell populations (HPA tissue IHC), but one negative section does not prove absence of GANAB. Review tissue identity, antibody handling, retrieval and detection controls (general IHC practice), then repeat before interpreting a biological loss. |
| Compartment and topology (UniProt Q14697; HPA subcellular ICC-IF). | UniProt annotates endoplasmic reticulum and Golgi localization with no transmembrane segment; HPA supports endoplasmic reticulum localization by ICC-IF. Use these findings to assess plausibility, while scoring paraffin IHC at cellular rather than organelle resolution (general IHC practice). |
| Cell-specific tissue pattern (HPA tissue IHC). | High staining is reported in several glandular, neuronal, lymphoid and trophoblastic populations, whereas adipocytes, cardiomyocytes and skeletal myocytes are Not detected (HPA tissue IHC). Select and interpret control cells by their stated identity, not by the tissue name alone. |
| Antibody evidence (HPA antibodies; HPA tissue IHC). | HPA026874 and HPA061426 each have Enhanced IHC validation (HPA antibodies). The overall tissue profile has medium staining-to-RNA consistency (HPA tissue IHC), so agreement with a listed cell pattern supports interpretation without making every unexpected positive specific. |
| Molecular forms (UniProt Q14697). | UniProt lists three isoforms, a cleaved signal sequence at residues 1–28, a mature chain at 29–944 and glycosylation at residue 97. An antibody's epitope would determine which forms it recognizes; the supplied evidence does not identify that epitope or establish an antigen-retrieval response. |
| Situation | Likely cause | Next action |
|---|---|---|
| Known-positive glandular or trophoblastic cells are blank (HPA tissue IHC). | The section, staining run or reagent may have failed (general IHC practice); this observation alone cannot distinguish technical failure from reduced expression. | Confirm cell identity and run controls; review the catalog antibody's IHC-P instructions, retrieval conditions and detection reagents before repeating (general IHC practice). |
| Signal appears mainly nuclear or at the outer cell border. | That distribution conflicts with the supported intracellular localization (UniProt Q14697; HPA subcellular ICC-IF), raising concern about staining specificity. | Compare cellular distribution in an HPA High population and inspect negative reagent controls; avoid scoring isolated nuclear or surface signal as a confirmed positive (general IHC practice). |
| Adipocytes or cardiomyocytes stain strongly. | HPA reports GANAB as Not detected in those cells (HPA tissue IHC); cross-reactivity or endogenous detection activity is possible (general IHC practice). | Inspect morphology and controls, including a primary-antibody omission control; confirm any unexpected cellular positive with an independently validated reagent when available (general IHC practice). |
| Brown precipitate or haze masks the cytoplasm. | Diffuse background can arise from nonspecific binding, endogenous enzyme activity or detection conditions (general IHC practice); its appearance does not establish which mechanism applies. | Check the primary-antibody omission control, blocking and detection controls, then adjust the staining workflow according to the reagent instructions (general IHC practice). |
| Two stained sections differ in which cells look positive. | The HPA profile is broadly cytoplasmic but reports distinct levels by cell type and only medium staining-to-RNA consistency (HPA tissue IHC). Section composition can also differ (general IHC practice). | Compare matched cell populations and staining controls, then record cell type, compartment and intensity separately; do not score a whole tissue from one positive structure (general IHC practice). |
| IF/ICC question: Should a cytoplasmic IHC result match an organelle pattern? | HPA ICC-IF supports endoplasmic reticulum localization (HPA subcellular ICC-IF), while HPA tissue IHC describes a cytoplasmic profile (HPA tissue IHC). The methods show different levels of spatial detail (general IHC/IF practice). | Use the separate IF/ICC guide to evaluate subcellular detail; for this IHC section, score the relevant cells and cytoplasmic distribution (HPA tissue IHC). |
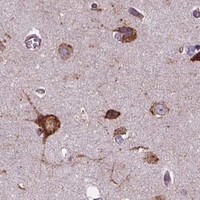


Comprehensive Human Protein Atlas IHC scoring per tissue (reliability: Enhanced — Medium consistency between antibody staining and RNA expression data.). Rows are taken directly from the HPA tissue chart — click any row's HPA link to view the source.
| Tissue | Cell type | Level | Evidence | Source |
|---|---|---|---|---|
| Appendix | Glandular cells | High | Protein (IHC) | HPA → |
| Cerebellum | GLUC cells - cytoplasm/membrane | High | Protein (IHC) | HPA → |
| Cerebral cortex | Neuronal cells | High | Protein (IHC) | HPA → |
| Duodenum | Glandular cells | High | Protein (IHC) | HPA → |
| Epididymis | Glandular cells | High | Protein (IHC) | HPA → |
| Tissue | Cell type | Level | Evidence | Source |
|---|---|---|---|---|
| Adipose tissue | Adipocytes | Not detected | Protein (IHC) | HPA → |
| Heart muscle | Cardiomyocytes | Not detected | Protein (IHC) | HPA → |
| Ovary | Ovarian stroma cells | Not detected | Protein (IHC) | HPA → |
| Parathyroid gland | Glandular cells | Not detected | Protein (IHC) | HPA → |
| Skeletal muscle | Myocytes | Not detected | Protein (IHC) | HPA → |
Troubleshoot GANAB staining by checking retrieval, cell compartment, and controls before comparing signal across paraffin sections.
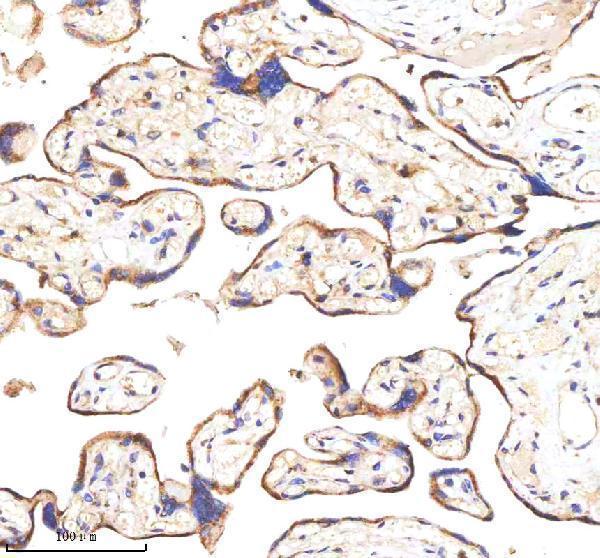
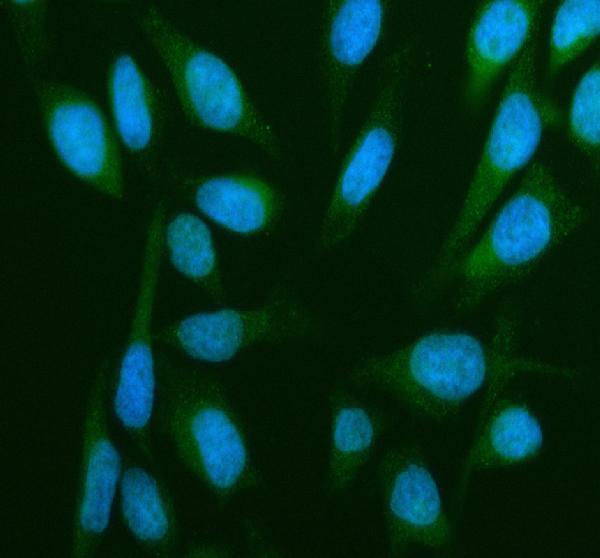
A09668-2 has IHC data from human placenta paraffin sections and IF data from HeLa cells and human placenta paraffin sections (catalog image captions).
A09668-2 was demonstrated by IHC on a human placenta paraffin section with EDTA pH 8.0 retrieval and DAB detection (IHC image caption). The same SKU has IF images from HeLa cells and a human placenta paraffin section (IF image captions).
Which to pick: Choose A09668-2 for tissue IHC: its own image documents a human placenta paraffin section, while the fixative is unreported (IHC image caption). Choose A09668-2 for IF/ICC because both applications are listed and its IF images show HeLa cells and human placenta (catalog applications; IF image captions). For cross-species work, A09668-2 lists human, mouse and rat reactivity, although its supplied IHC image documents human tissue only; it has a rabbit host, and clonality is unreported (catalog reactivity and host; IHC image caption; catalog clone field).