This website uses cookies to ensure you get the best experience on our website.


- Table of Contents
Plan chromogenic GATM IHC in paraffin sections using kidney tubules, hepatocytes and pancreatic exocrine cells as high-staining references (HPA tissue IHC). Assess granular cytoplasmic staining while considering GATM’s annotated mitochondrial inner-membrane localisation (HPA tissue IHC; UniProt).

Expected localisation, validated protocols, controls and antibodies — the at-a-glance facts below, then the full design guide.
| Expected localisation | Granular cytoplasm in kidney, liver and pancreas (HPA tissue IHC) | |
| Staining pattern | Granular cytoplasm in tubules, hepatocytes and exocrine cells (HPA tissue IHC) | |
| Antigen retrieval | EDTA pH 8.0 HIER, heat-mediated (datasheet A02754-1) | |
| Positive control | Kidney+4 more · see all | |
| Negative control | Adipose tissue+4 more · see all |
| Fixation | Matched tissue-IHC evidence does not establish the fixation claim. Validate the specimen-specific method before use. (selected-SKU IHC image A02754-1) | |
| Caveat | Antibody staining and RNA show medium consistency (HPA tissue IHC) | |
| Regulation | Highest tissue expression is in kidney (UniProt) | |
| Isoform / epitope | 3 isoforms; the mature chain starts at residue 44 (UniProt) |
The catalog antibody’s IHC-P protocol is paired with four published GATM IHC protocols from lung, cholangiocarcinoma, renal carcinoma and glioblastoma specimens (PMC9513582; PMC11408786; PMC9139776; PMC10842612).
| Sample | Paraffin-embedded human breast cancer tissue; fixative not specified (datasheet A02754-1) |
| Fixation | Image fixative and duration unreported (datasheet A02754-1); verify before use. |
| Sectioning | 4–5 µm sections on charged slides (standard) |
| Deparaffinisation | Xylene, graded ethanol series to water (standard) |
| Antigen retrieval | Heat retrieval: EDTA pH 8.0 (datasheet A02754-1); 20 min, 95–100 °C (standard) |
| Peroxidase block | 3% H2O2, 10 min, room temperature (standard) |
| Blocking | 10% goat serum (datasheet A02754-1) |
| Primary antibody | Rabbit anti-GATM, 2-5 μg/ml (datasheet A02754-1) |
| Primary incubation | Overnight at 4 °C (datasheet A02754-1) |
| Detection | HRP-conjugated secondary, DAB chromogen (datasheet A02754-1) |
| Counterstain | Hematoxylin, blue, dehydrate and mount (standard) |
| Expected result | GATM-positive staining in cells in tubules of kidney (HPA tissue IHC: High). HPA tissue profile: Granular cytoplasmic expression in several different tissue types, mainly in kidney, liver and pancreas. No signal in the no-primary control. |
GATM should appear as granular cytoplasmic staining in kidney tubule cells, hepatocytes and pancreatic exocrine glandular cells (HPA tissue IHC). Its mitochondrial inner-membrane association, probably on the outer side, and cytoplasmic localization fit this pattern; no transmembrane segment is annotated (UniProt P50440 topology). HPA rates tissue IHC reliability Enhanced, while reporting medium consistency between staining and RNA expression (HPA tissue IHC).
| Granular cytoplasmic staining in kidney tubule cells, hepatocytes or pancreatic exocrine glandular cells. | This matches the reported high-staining cell populations (HPA tissue IHC). Score intensity and the fraction of stained cells within the identified population, with the tissue context recorded; HPA's High category describes its observations, not a required intensity for every section (HPA tissue IHC; general IHC practice). |
| Predominantly nuclear staining, or a sharply outlined plasma-membrane pattern with little cytoplasmic signal. | That distribution conflicts with the reported granular cytoplasmic tissue pattern and supported mitochondrial IF localization (HPA tissue IHC; HPA ICC-IF). Review controls and staining conditions before assigning it to GATM; UniProt also annotates cytoplasm and inner-membrane association, but no transmembrane segment (UniProt P50440 topology). |
| Prominent staining in a cell population reported as not detected, such as adipocytes or bone-marrow hematopoietic cells. | HPA reports no detection in those sampled populations (HPA tissue IHC). Check cell identity and a negative control: unexpected color may reflect cross-reactivity or endogenous detection activity (general IHC practice). A single discrepancy does not establish a new GATM-positive population or prove the cause of staining. |
| Weak, diffuse color across cells and extracellular spaces, without a granular cytoplasmic pattern. | This is difficult to distinguish from nonspecific background and does not match HPA's reported GATM pattern (HPA tissue IHC). Compare the distribution with a known-positive section and a control for detection background; assess the whole slide before calling faint color positive (general IHC practice). |
| No visible signal in kidney tubules, hepatocytes or pancreatic exocrine glandular cells. | These are HPA High populations, so an entirely blank result calls for a technical check before a biological conclusion (HPA tissue IHC; general IHC practice). Confirm that the expected cells are present and that the positive control and detection reagents worked; HPA's Enhanced reliability does not guarantee staining in every preparation (HPA tissue IHC). |
| Tissue and cell population | HPA reports High staining in kidney tubule cells, hepatocytes and pancreatic exocrine cells; several other populations are Medium or Low, and some are not detected (HPA tissue IHC). Compare like cell types when judging an unfamiliar section; absence from a listed negative population is more informative than whole-organ color. |
| Location and topology | GATM is annotated in cytoplasm and at the mitochondrial inner membrane, probably attached to its outer side, with no transmembrane segment (UniProt P50440 topology). This supports an intracellular interpretation but cannot resolve mitochondrial membrane position by chromogenic tissue IHC alone (general IHC practice). |
| Antibody and tissue evidence | The listed antibody HPA026077 has Enhanced IHC validation, and the overall tissue profile has Enhanced reliability with medium agreement between staining and RNA data (HPA antibodies; HPA tissue IHC). Use those ratings to weigh an observed pattern; they do not identify the cause of an unexpected stain. |
| Protein forms and epitope inference | UniProt lists three isoforms and a mature chain spanning residues 44–423 (UniProt P50440). The supplied record gives no antibody epitope or isoform-specific IHC result, so a staining difference cannot be assigned to isoform recognition or processing from these annotations alone. |
| IF/ICC: What pattern is expected? | A mitochondrial pattern is the supported ICC-IF localization, with images listed for RT-4, Rh30 and U2OS; HPA026077 has Supported ICC status (HPA ICC-IF; HPA antibodies). Interpret that as localization evidence for the separate IF/ICC application, not an intensity standard for paraffin-section chromogenic IHC. |
| Situation | Likely cause | Next action |
|---|---|---|
| Known-positive tissue is completely blank. | A missing or inactive staining step is possible; HPA reports High signal in kidney tubule cells, hepatocytes and pancreatic exocrine cells (HPA tissue IHC; general IHC practice). | Check that the expected cells are in the section, then review primary antibody, detection reagents and chromogen with a working positive control; review retrieval conditions as general paraffin-IHC practice. |
| Signal is weak in an expected High cell population. | The result differs from HPA's reported level, but that alone does not identify a GATM-specific fixation or epitope problem (HPA tissue IHC). | Compare the same cell type with a positive control; review antibody dilution, retrieval and detection conditions under general IHC practice. No target-specific fixation sensitivity is supplied. |
| Color covers much of the section without cellular detail. | Diffuse background can obscure the granular cytoplasmic pattern reported by HPA (HPA tissue IHC; general IHC practice). | Inspect a negative control, then review blocking, wash steps and detection background as general IHC practice. Reassess only after the expected cells and their cytoplasmic pattern can be distinguished. |
| Strong signal appears mainly in nuclei or along cell surfaces. | Those dominant compartments disagree with HPA's granular cytoplasmic tissue pattern and supported mitochondrial ICC-IF location (HPA tissue IHC; HPA ICC-IF). | Confirm the cells and section quality, compare a known-positive tissue and negative control, and review staining specificity before scoring the unusual compartment as GATM (general IHC practice). |
| Adipocytes or bone-marrow hematopoietic cells appear strongly positive. | HPA reports these sampled cell populations as not detected; cross-reactivity or endogenous detection activity are possible explanations, not established diagnoses (HPA tissue IHC; general IHC practice). | Verify cell identity and compare appropriate negative controls with a known-positive tissue. Record the discrepancy without treating the unexpected color alone as proof of GATM expression. |
| A negative control develops chromogen color. | Color in a control without the primary antibody points toward background in the detection workflow (general IHC practice). | Review blocking and detection steps, including possible endogenous activity, and resolve control staining before interpreting weak tissue signal (general IHC practice). |


Comprehensive Human Protein Atlas IHC scoring per tissue (reliability: Enhanced — Medium consistency between antibody staining and RNA expression data.). Rows are taken directly from the HPA tissue chart — click any row's HPA link to view the source.
| Tissue | Cell type | Level | Evidence | Source |
|---|---|---|---|---|
| Kidney | Cells in tubules | High | Protein (IHC) | HPA → |
| Liver | Hepatocytes | High | Protein (IHC) | HPA → |
| Pancreas | Exocrine glandular cells | High | Protein (IHC) | HPA → |
| Cerebellum | Granular cells - cytoplasm/membrane | Medium | Protein (IHC) | HPA → |
| Cerebral cortex | Glial cells | Medium | Protein (IHC) | HPA → |
| Tissue | Cell type | Level | Evidence | Source |
|---|---|---|---|---|
| Adipose tissue | Adipocytes | Not detected | Protein (IHC) | HPA → |
| Appendix | Glandular cells | Not detected | Protein (IHC) | HPA → |
| Bone marrow | Hematopoietic cells | Not detected | Protein (IHC) | HPA → |
| Breast | Adipocytes | Not detected | Protein (IHC) | HPA → |
| Bronchus | Respiratory epithelial cells | Not detected | Protein (IHC) | HPA → |
Troubleshoot GATM staining in paraffin sections by checking retrieval, controls, cell type and subcellular pattern before scoring chromogenic signal.
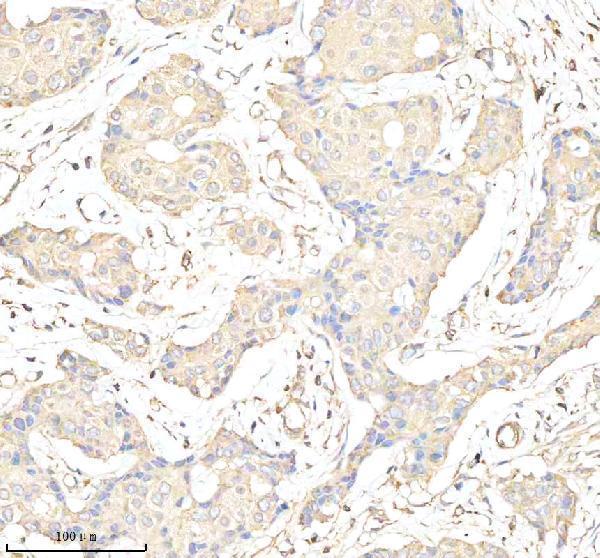
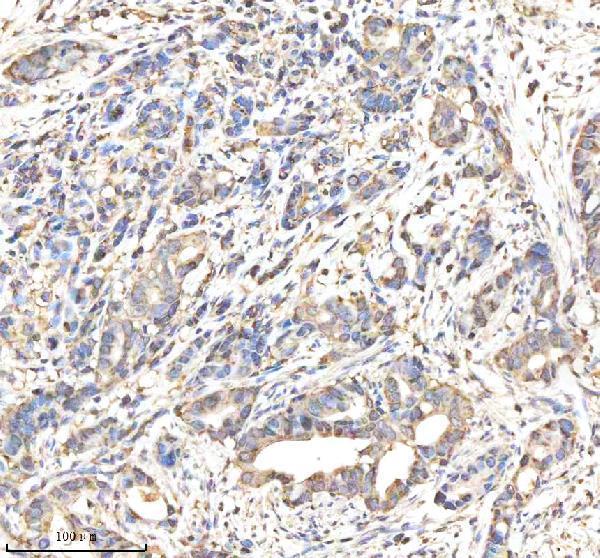
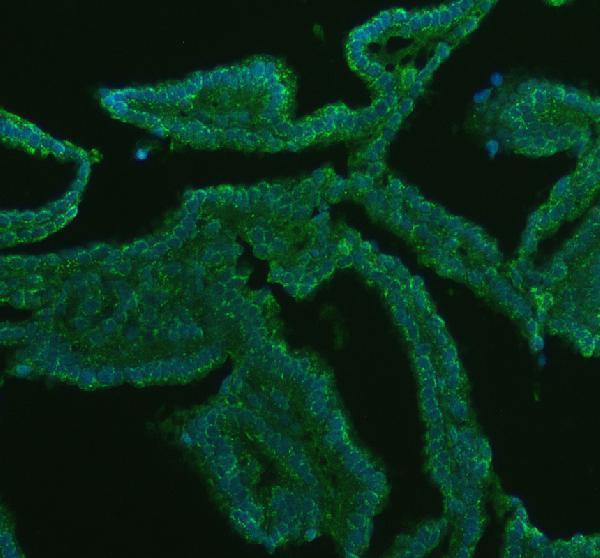
A02754-1 has IHC images from human breast and pancreas cancer sections and rat kidney sections, plus an IF image from a human breast cancer section (catalog image captions).
A02754-1 was demonstrated by IHC on paraffin sections of human breast cancer, human pancreas cancer, and rat kidney (IHC image captions). The same SKU was demonstrated by IF on a paraffin section of human breast cancer (IF image caption).
Which to pick: Choose A02754-1 for paraffin section IHC; its caption reports EDTA retrieval at pH 8.0, 2 μg/ml primary antibody, and HRP/DAB detection, but does not report the fixative (IHC image caption). For IF, A02754-1 has a paraffin section image at 5 μg/ml; ICC validation is unreported (IF image caption; catalog applications). For work across species, A02754-1 lists human, mouse, and rat reactivity, while its IHC images cover human and rat tissue; the host is rabbit and clonality is unreported (catalog reactivity and host; IHC image captions).