This website uses cookies to ensure you get the best experience on our website.


- Table of Contents
Plan chromogenic GLO1 IHC in paraffin sections using high staining in Leydig cells and prostate, epididymal or thyroid glandular cells as reference patterns (HPA tissue IHC). Compare cell-specific cytoplasmic staining with appropriate controls and keep fixation consistent across samples (HPA tissue IHC; standard IHC practice).

Expected localisation, validated protocols, controls and antibodies — the at-a-glance facts below, then the full design guide.
| Expected localisation | Cytoplasmic staining in several tissues (HPA tissue IHC) | |
| Staining pattern | Cytoplasmic signal in Leydig and glandular cells (HPA tissue IHC) | |
| Antigen retrieval | Citrate pH 6 HIER, heat-mediated (datasheet A01703-1) | |
| Positive control | Epididymis+4 more · see all | |
| Negative control | Adipose tissue+4 more · see all |
| Fixation | Keep tissue fixation consistent across samples. (standard IHC practice; not target-specific) | |
| Caveat | Antibody staining has medium RNA consistency (HPA tissue IHC) | |
| Regulation | Expression regulation is unannotated (UniProt) | |
| Isoform / epitope | 2 isoforms; epitope coverage is unknown (UniProt) |
The catalog antibody protocol is followed by three published chromogenic IHC protocols for GLO1 in paraffin sections (PMC8304603; PMC4693023; PMC5813374).
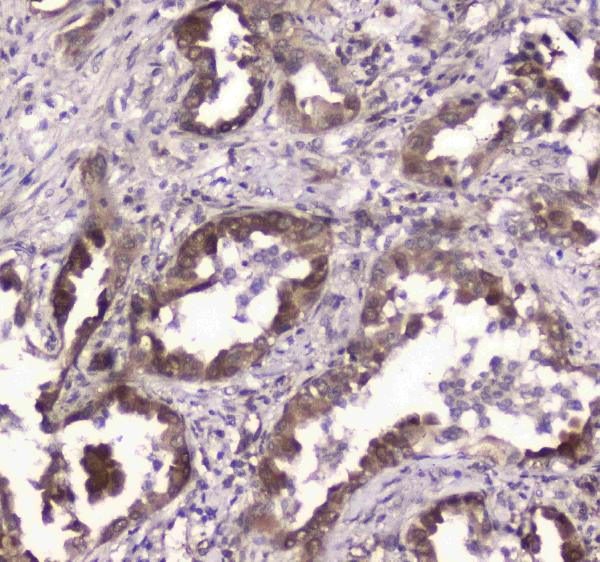
| Sample | Paraffin-embedded human lung cancer tissue; fixative not specified (datasheet A01703-1) |
| Fixation | Image fixative and duration unreported (datasheet A01703-1); verify before use. |
| Sectioning | 4–5 µm sections on charged slides (standard) |
| Deparaffinisation | Xylene, graded ethanol series to water (standard) |
| Antigen retrieval | Heat retrieval: Citrate pH 6, 20 min (datasheet A01703-1) |
| Peroxidase block | 3% H2O2, 10 min, room temperature (standard) |
| Blocking | 10% goat serum (datasheet A01703-1) |
| Primary antibody | Rabbit anti-GLO1, 0.5-1μg/ml (datasheet A01703-1) |
| Primary incubation | Overnight at 4 °C (datasheet A01703-1) |
| Detection | Streptavidin-biotin complex (SABC), DAB chromogen (datasheet A01703-1) |
| Counterstain | Hematoxylin, blue, dehydrate and mount (standard) |
| Expected result | GLO1-positive staining in glandular cells of epididymis (HPA tissue IHC: High). HPA tissue profile: Cytoplasmic expression in several tissues, highly abundant in Leydig cells and in in prostate, epididymis and thyroid glandular cells. No signal in the no-primary control. |
Expect predominantly cytoplasmic GLO1 staining in glandular cells of epididymis, prostate and thyroid gland, and in testicular Leydig cells (HPA tissue IHC: High; reliability Enhanced). HPA also observes medium staining in selected other cell populations (HPA tissue IHC). GLO1 has no annotated transmembrane segment, while UniProt does not assign it a subcellular location (UniProt Q04760 topology and subcellular record).
| Strong cytoplasmic staining in epididymal, prostate or thyroid glandular cells, or testicular Leydig cells. | This matches the High cell-specific IHC pattern (HPA tissue IHC). Judge the named cells, since an entire tissue section contains other cell types. HPA rates the tissue profile Enhanced, with medium agreement between antibody staining and RNA data (HPA tissue IHC reliability). |
| Predominantly extracellular or luminal deposit, with little staining in the expected cells. | That distribution does not match HPA's cytoplasmic tissue pattern (HPA tissue IHC). Inspect morphology and the detection controls before interpreting it as GLO1. Nuclear or membrane signal alone is less decisive: those locations are supported by ICC-IF, but their prominence in paraffin IHC is not established here (HPA subcellular ICC-IF). |
| Strong staining in adipocytes, cardiomyocytes or skeletal myocytes. | These cell types are listed as Not detected by HPA tissue IHC (HPA tissue IHC). Unexpected chromogen may reflect antibody cross-reactivity or endogenous detection activity (general IHC practice); the image alone cannot distinguish them. Recheck cell identity and compare appropriate detection controls. |
| Diffuse colour across cells and surrounding tissue, obscuring cell boundaries. | A uniform haze is difficult to reconcile with the named high-staining cell populations (HPA tissue IHC). Background from detection chemistry or nonspecific antibody binding is possible (general IHC practice). Interpret a positive result only where cellular morphology and compartment can still be resolved. |
| No staining in an otherwise interpretable epididymis, prostate, testis or thyroid section. | A missing signal conflicts with the listed High populations if those cells are present (HPA tissue IHC). Confirm their presence on the section, then assess the staining run and antibody conditions (general IHC practice). One blank field cannot establish absent GLO1 expression throughout a tissue. |
| Cell population and reference intensity | HPA lists glandular cells in epididymis, prostate and thyroid, plus testicular Leydig cells, as High; adrenal and appendix glandular cells, marrow hematopoietic cells and bronchial basal cells are Medium (HPA tissue IHC). Use the named cell population when comparing sections; a medium population need not resemble a high one. |
| Evidence behind the IHC pattern | The tissue profile is rated Enhanced, with medium consistency between staining and RNA expression; similar staining from paired antibodies supports the profile (HPA tissue IHC reliability). CAB040541 and CAB040542 each have Enhanced IHC validation (HPA antibodies). This supports the observed pattern without proving every individual positive cell is specific. |
| Isoforms and antibody epitope | UniProt records 2 GLO1 isoforms and a VOC domain spanning residues 31–177 (UniProt Q04760). The payload gives no epitope location or isoform coverage for an IHC antibody, so a difference between antibodies cannot be assigned to isoform recognition from these records. Check the antibody's documented epitope before making that interpretation. |
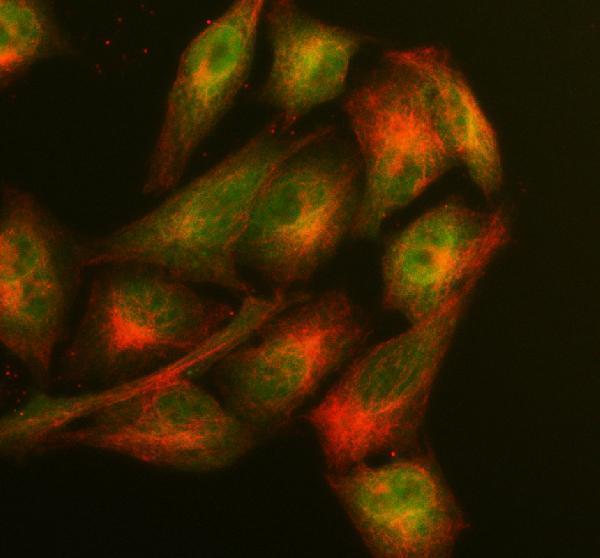
| IF/ICC Q&A: where may GLO1 appear? | HPA supports nucleoplasm, plasma membrane and cytosol in ICC-IF images from A-431, U-251MG and U2OS (HPA subcellular ICC-IF). That answers the IF localisation question; it does not set a separate paraffin IHC scoring rule. UniProt lists no subcellular location and no transmembrane segment (UniProt Q04760). |
| Retrieval and detection conditions | No GLO1-specific retrieval setting or fixation sensitivity is supplied by UniProt or HPA. For chromogenic paraffin IHC, compare candidate retrieval conditions using the same known-positive and low-signal reference cells, with detection controls (general IHC practice; HPA tissue IHC for reference cells). Do not infer a target-specific fixation effect from a staining level. |
| Situation | Likely cause | Next action |
|---|---|---|
| High-reference cells show no colour. | The intended cells may be absent from the viewed field, or the staining run may have failed (general IHC practice); HPA lists these populations as High (HPA tissue IHC). | Locate the named glandular cells or Leydig cells on the section first. Review the run's positive control, antibody application and detection steps before calling the sample negative (general IHC practice). |
| Signal is faint in a High reference but visible in Medium populations. | The observed ranking disagrees with the reference profile, which assigns different levels to specific cell populations (HPA tissue IHC). Section composition or staining conditions may affect the comparison (general IHC practice). | Compare equivalent, intact cell populations on the same run. Document intensity by cell type and review antibody and detection conditions before revising the biological interpretation (general IHC practice). |
| Adipocytes or muscle cells stain strongly. | HPA records adipocytes, cardiomyocytes and skeletal myocytes as Not detected (HPA tissue IHC). Cross-reactivity or endogenous detection activity could produce an apparent positive (general IHC practice). | Confirm the stained cell type and inspect a detection control without primary antibody. If colour persists, investigate the detection system; if it does not, reassess antibody specificity (general IHC practice). |
| Background colour obscures boundaries. | Nonspecific antibody binding or detection background may be masking the cellular distribution (general IHC practice). The reference pattern is cytoplasmic in selected tissue cells (HPA tissue IHC). | Check the no-primary detection control, blocking and antibody concentration; compare morphology in counterstained sections. Score GLO1 only where the expected cells and their cytoplasm remain distinguishable (general IHC practice; HPA tissue IHC). |
| Colour pools in lumina or outside cells. | That distribution differs from the cytoplasmic tissue profile (HPA tissue IHC). Deposited detection product or section artefact is possible (general IHC practice); the supplied records do not establish secreted GLO1 staining. | Review adjacent cellular morphology and detection controls. Require a reproducible signal in the HPA-listed positive cells before attributing extracellular colour to GLO1 (HPA tissue IHC; general IHC practice). |
| A prominent nuclear or membrane signal dominates the IHC slide. | HPA supports both locations in ICC-IF, alongside cytosol, but describes the tissue IHC profile as cytoplasmic (HPA subcellular ICC-IF; HPA tissue IHC). The two applications do not establish identical compartment intensities. | Record the compartment and cell type separately. Compare cytoplasmic staining in a listed High population and review IHC detection controls before treating a nuclear or membrane dominant pattern as the expected paraffin result (HPA tissue IHC; general IHC practice). |


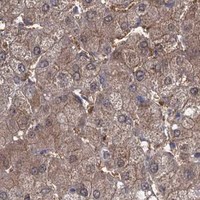


Comprehensive Human Protein Atlas IHC scoring per tissue (reliability: Enhanced — Medium consistency between antibody staining and RNA expression data. Paired antibodies with high similarity supports the protein expression profile.). Rows are taken directly from the HPA tissue chart — click any row's HPA link to view the source.
| Tissue | Cell type | Level | Evidence | Source |
|---|---|---|---|---|
| Epididymis | Glandular cells | High | Protein (IHC) | HPA → |
| Prostate | Glandular cells | High | Protein (IHC) | HPA → |
| Testis | Leydig cells | High | Protein (IHC) | HPA → |
| Thyroid gland | Glandular cells | High | Protein (IHC) | HPA → |
| Adrenal gland | Glandular cells | Medium | Protein (IHC) | HPA → |
| Tissue | Cell type | Level | Evidence | Source |
|---|---|---|---|---|
| Adipose tissue | Adipocytes | Not detected | Protein (IHC) | HPA → |
| Breast | Adipocytes | Not detected | Protein (IHC) | HPA → |
| Esophagus | Squamous epithelial cells | Not detected | Protein (IHC) | HPA → |
| Heart muscle | Cardiomyocytes | Not detected | Protein (IHC) | HPA → |
| Placenta | Trophoblastic cells | Not detected | Protein (IHC) | HPA → |
Troubleshoot GLO1 staining in paraffin section chromogenic IHC using the catalog antibody’s tissue result and independent expression data.
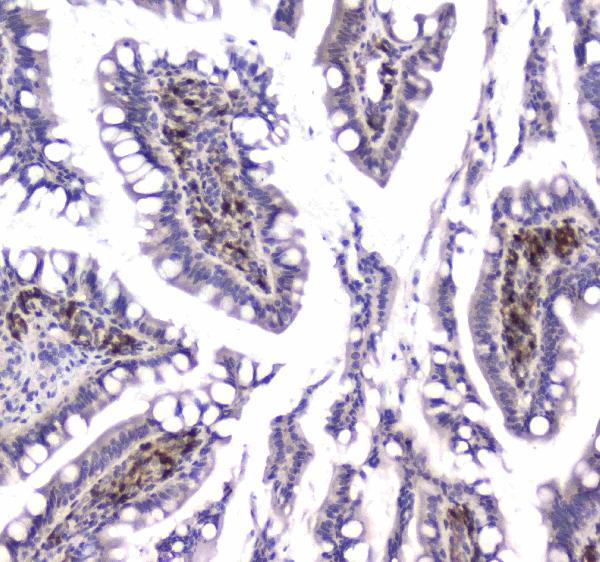
The IHC-validated GLO1 antibody has paraffin-section images from human and rat tissues (catalog IHC captions) and an IF/ICC image from human cells (catalog IF caption).
A01703-1 has IHC images from human lung cancer and mammary cancer tissues and rat small intestine and spleen, all in paraffin sections (catalog IHC captions). It also has an IF/ICC image from A549 cells (catalog IF caption); the listed reactivity is human, mouse and rat (catalog reactivity).
Which to pick: For tissue IHC, choose A01703-1: its images show staining in human and rat paraffin sections (catalog IHC captions); the fixative is unreported (catalog IHC captions). For IF/ICC, A01703-1 has an A549 cell image (catalog IF caption) and is listed for IF and ICC (catalog applications). For cross-species studies, A01703-1 is a polyclonal antibody (catalog dilution data) listed as reactive with human, mouse and rat (catalog reactivity), though the supplied IHC images cover human and rat only (catalog IHC captions).