This website uses cookies to ensure you get the best experience on our website.


- Table of Contents
This IHC-P guide describes GOT1’s cytoplasmic tissue pattern (HPA tissue IHC) and the catalog antibody’s 2–5 µg/mL IHC range (datasheet A04085-3). Compare high staining in round or early spermatids with undetected staining in adipocytes (HPA tissue IHC).

Expected localisation, validated protocols, controls and antibodies — the at-a-glance facts below, then the full design guide.
| Expected localisation | Cytoplasmic tissue staining (HPA tissue IHC) | |
| Staining pattern | Cytoplasmic in neurons and glandular cells; abundant in CNS (HPA tissue IHC) | |
| Antigen retrieval | EDTA pH 8.0 HIER, heat-mediated (datasheet A04085-3) | |
| Positive control | Testis+4 more · see all | |
| Negative control | Adipose tissue+4 more · see all |
| Fixation | Matched tissue-IHC evidence does not establish the fixation claim. Validate the specimen-specific method before use. (selected-SKU IHC image A04085-3) | |
| Caveat | Staining and RNA show medium consistency (HPA tissue IHC) | |
| Regulation | Expression regulation not annotated (UniProt) | |
| Isoform / epitope | 2 isoforms; epitope differences unreported (UniProt) |
Compare the catalog antibody’s EDTA pH 8.0 retrieval (datasheet A04085-3) with published GOT1 IHC protocols for pancreatic tumors and human FFPE sections (PMC9735520; PMC12671062).
| Sample | Paraffin-embedded mouse brain tissue; fixative not specified (datasheet A04085-3) |
| Fixation | Image fixative and duration unreported (datasheet A04085-3); verify before use. |
| Sectioning | 4–5 µm sections on charged slides (standard) |
| Deparaffinisation | Xylene, graded ethanol series to water (standard) |
| Antigen retrieval | Heat retrieval: EDTA pH 8.0 (datasheet A04085-3); 20 min, 95–100 °C (standard) |
| Peroxidase block | 3% H2O2, 10 min, room temperature (standard) |
| Blocking | 10% goat serum (datasheet A04085-3) |
| Primary antibody | Rabbit anti-GOT1, 2-5μg/ml (datasheet A04085-3) |
| Primary incubation | Overnight at 4 °C (datasheet A04085-3) |
| Detection | Streptavidin-biotin complex (SABC), DAB chromogen (datasheet A04085-3) |
| Counterstain | Hematoxylin, blue, dehydrate and mount (standard) |
| Expected result | GOT1-positive staining in round or early spermatids of testis (HPA tissue IHC: High). HPA tissue profile: General cytoplasmic expression, most abundant in CNS, heart muscle and liver. No signal in the no-primary control. |
GOT1 should appear mainly as cytoplasmic staining because it is annotated as cytoplasmic and has no transmembrane segment (UniProt P17174). In paraffin sections, useful positive cells include round or early spermatids in testis and neurons in cerebral cortex or caudate (HPA tissue IHC). HPA rates the tissue IHC evidence Enhanced, while reporting medium consistency between antibody staining and RNA expression (HPA tissue IHC).
| Cytoplasmic signal is strong in round or early spermatids, with cell outlines and nuclei still readable (HPA: High in round or early spermatids; UniProt P17174: cytoplasm). | This fits the reported high testis signal. Judge intensity in the named cells: an entire testis section need not stain uniformly when the reference pattern identifies a particular cell population (HPA tissue IHC; standard IHC practice). |
| Neuronal cytoplasm stains at a moderate level in cerebral cortex or caudate (HPA: Medium in neuronal cells). | This is another plausible positive pattern. Compare like cell types and sections processed together; HPA intensity labels describe observed tissue IHC, not an absolute chromogen threshold for every run (HPA tissue IHC; standard IHC practice). |
| Signal is predominantly nuclear or sharply confined to cell membranes, without convincing cytoplasmic staining (UniProt P17174: cytoplasm; no transmembrane segment). | That distribution conflicts with the annotated location. Check the counterstain, chromogen deposits and antibody-dependent background before scoring those cells as GOT1 positive (UniProt P17174; standard IHC practice). |
| Strong staining appears in adipocytes or lung alveolar cells, while the expected positive cell populations are weak (HPA: Not detected in those cell types). | Treat that contrast as suspect rather than assigning tissue-wide positivity. Cross-reactivity or endogenous detection activity is possible; compare a known-positive section and appropriate detection controls (HPA tissue IHC; standard IHC practice). |
| Color spreads across stroma, empty spaces or most cell compartments and obscures individual cells (standard IHC practice). | This is diffuse background, so it cannot establish a cytoplasmic GOT1 pattern. Review blocking, washing, antibody concentration and chromogen development against a control section (UniProt P17174: cytoplasm; standard IHC practice). |
| Cell-specific reference pattern and evidence strength (HPA tissue IHC). | HPA reports general cytoplasmic expression and identifies high staining in round or early spermatids, medium staining in several listed cell types, and non-detection in others (HPA tissue IHC). Its Enhanced IHC rating supports the pattern, while its stated RNA agreement is medium (HPA tissue IHC). |
| Subcellular location and topology (UniProt P17174). | Cytoplasmic location and absence of a transmembrane segment support a cytoplasmic readout (UniProt P17174). A membrane-only pattern therefore needs scrutiny; the record does not establish a special antigen-retrieval setting (UniProt P17174; standard IHC practice). |
| Isoforms and protein annotations (UniProt P17174). | Two isoforms, a chain annotated at residues 2–413, and modified residues at 149 and 259 are recorded (UniProt P17174). The supplied evidence does not map an antibody epitope or show that these features change staining or retrieval; avoid predicting an isoform-specific pattern. |
| Chromogenic detection controls (standard IHC practice). | Endogenous enzyme activity or nonspecific detection can add color in paraffin IHC (standard IHC practice). Use a detection control to assess unexplained signal, especially where HPA reports GOT1 as not detected in the named cell type (HPA tissue IHC). |
| IF/ICC expectation? (UniProt P17174; HPA subcellular record). | Cytoplasmic signal is a reasonable location prediction from UniProt P17174. HPA supplies no main ICC-IF location or cell-line images here, so this section cannot claim an observed IF/ICC pattern (HPA subcellular record). |
| Situation | Likely cause | Next action |
|---|---|---|
| No signal in round or early spermatids on a testis section (HPA: High in those cells). | A weak assay run is possible, but the HPA reference alone does not identify a GOT1-specific fixation or retrieval failure (HPA tissue IHC; standard IHC practice). | Check tissue identity and morphology, the IHC-validated antibody's supplied IHC-P instructions, detection reagents and a processed positive control (standard IHC practice). |
| Only nuclei or crisp cell borders stain (UniProt P17174: cytoplasm; no transmembrane segment). | The compartment disagrees with the annotated GOT1 location; counterstain confusion or nonspecific color may explain it (UniProt P17174; standard IHC practice). | Inspect unstained and detection-control areas, then assess whether a reproducible cytoplasmic signal remains in an HPA-positive cell type (HPA tissue IHC; standard IHC practice). |
| Adipocytes or lung alveolar cells stain strongly (HPA: Not detected in those cells). | Unexpected cell staining may reflect cross-reactivity or endogenous detection activity; HPA non-detection is an observed reference, not proof of absolute absence (HPA tissue IHC; standard IHC practice). | Review a detection control and a positive cell population in the same run; score the named cell type rather than calling the whole tissue positive (HPA tissue IHC; standard IHC practice). |
| Broad haze makes cell boundaries and cytoplasm hard to distinguish (standard IHC practice). | Excess nonspecific signal or overdeveloped chromogen can conceal the expected cytoplasmic distribution (UniProt P17174: cytoplasm; standard IHC practice). | Review blocking and washes, then adjust antibody concentration or development within the antibody's IHC-P instructions; compare controls processed together (standard IHC practice). |
| A section shows uneven staining across otherwise comparable areas (standard IHC practice). | Target-specific fixation effects are not established by the supplied assay evidence. Verify with a matched IHC source before attributing a result to fixation. | Inspect tissue integrity and reagent coverage, and repeat the comparison with sections processed together before assigning biological meaning to the gradient (standard IHC practice). |
| A moderate neuronal signal is dismissed because it is weaker than the testis example (HPA: Medium in listed neurons; High in round or early spermatids). | The reference intensities differ by cell type, so a single visual cutoff can misclassify an expected moderate pattern (HPA tissue IHC; standard IHC practice). | Score compartment, named cell type and background together; use the relevant HPA cell-specific level as context and record run-specific controls (HPA tissue IHC; standard IHC practice). |
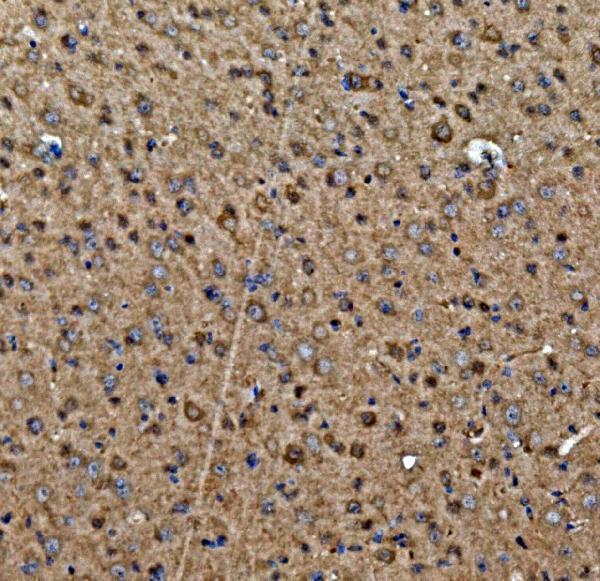
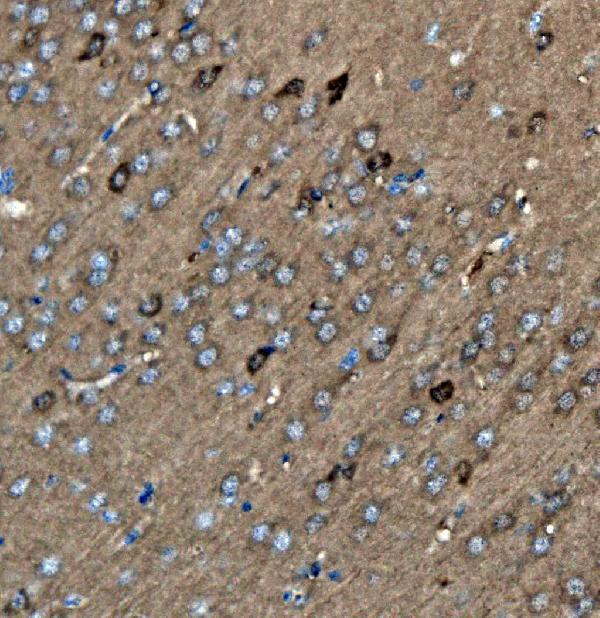

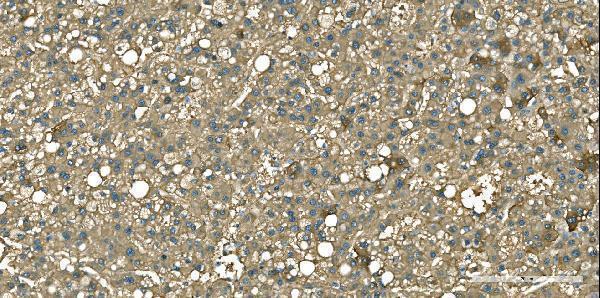
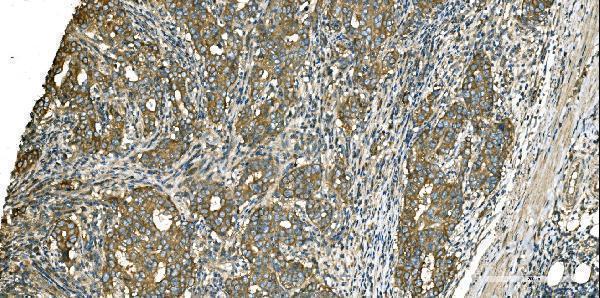


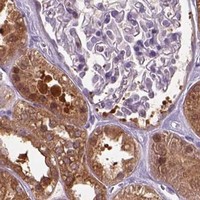
Comprehensive Human Protein Atlas IHC scoring per tissue (reliability: Enhanced — Medium consistency between antibody staining and RNA expression data.). Rows are taken directly from the HPA tissue chart — click any row's HPA link to view the source.
| Tissue | Cell type | Level | Evidence | Source |
|---|---|---|---|---|
| Testis | Round or early spermatids | High | Protein (IHC) | HPA → |
| Adrenal gland | Glandular cells | Medium | Protein (IHC) | HPA → |
| Appendix | Glandular cells | Medium | Protein (IHC) | HPA → |
| Caudate | Neuronal cells | Medium | Protein (IHC) | HPA → |
| Cerebellum | Cells in granular layer | Medium | Protein (IHC) | HPA → |
| Tissue | Cell type | Level | Evidence | Source |
|---|---|---|---|---|
| Adipose tissue | Adipocytes | Not detected | Protein (IHC) | HPA → |
| Bone marrow | Hematopoietic cells | Not detected | Protein (IHC) | HPA → |
| Breast | Adipocytes | Not detected | Protein (IHC) | HPA → |
| Endometrium | Cells in endometrial stroma | Not detected | Protein (IHC) | HPA → |
| Esophagus | Squamous epithelial cells | Not detected | Protein (IHC) | HPA → |
Troubleshoot GOT1 staining in paraffin sections by checking retrieval, cytoplasmic localisation, cell type and detection controls.
Catalog antibodies show paraffin-section IHC in human, mouse, and rat tissues and IF in T-47D cells, rat kidney, and human pancreas cancer sections (catalog image captions).
A04085-3 has IHC images from mouse and rat brain and human stomach and bladder cancer sections, plus IF images from T-47D cells, rat kidney, and human pancreas cancer sections (A04085-3 image captions). M04085-1 has IHC images from human liver cancer, renal pelvis squamous, and rectum adenocarcinoma sections (M04085-1 IHC image captions).
Which to pick: For human paraffin-section IHC, M04085-1 is a mouse monoclonal option with human tissue images (M04085-1 catalog entry and IHC image captions). For IF/ICC and cross-species IHC, choose A04085-3: its application list includes IF and ICC, and its IHC images cover human, mouse, and rat sections (A04085-3 catalog entry and image captions). Both IHC captions specify paraffin sections and EDTA pH 8 retrieval; neither reports the fixative (A04085-3 and M04085-1 IHC image captions).