This website uses cookies to ensure you get the best experience on our website.


- Table of Contents
Plan GYS1 paraffin IHC around the cytoplasmic staining reported in most tissues, with abundant staining in muscle cells (HPA tissue IHC). Use the catalog antibody’s 2–5 μg/ml IHC range as a starting point (datasheet A03512-3), and interpret staining with the HPA reliability assessment in mind (HPA tissue IHC).

Expected localisation, validated protocols, controls and antibodies — the at-a-glance facts below, then the full design guide.
| Expected localisation | Cytoplasmic staining (HPA tissue IHC) | |
| Staining pattern | Cytoplasmic staining in most tissues; abundant in muscle cells (HPA tissue IHC) | |
| Antigen retrieval | EDTA pH 8.0 HIER, heat-mediated (datasheet A03512-3) | |
| Positive control | Adrenal gland+4 more · see all | |
| Negative control | None in HPA (detected in all 45 tissues); use no-primary + isotype controls |
| Fixation | Keep fixation consistent across sections. (standard IHC practice; not target-specific) | |
| Caveat | Tissue staining has medium RNA consistency (HPA tissue IHC) | |
| Regulation | Expression in glycogen-bearing cell types (UniProt) | |
| Isoform / epitope | 2 isoforms; epitope coverage is unspecified (UniProt) |
The catalog antibody protocol uses EDTA pH 8.0 heat retrieval (datasheet A03512-3). The published IHC protocols below cover breast tumors and synovial tissue (PMC10242793; PMC6072843).
| Sample | Paraffin-embedded human breast cancer tissue; fixative not specified (datasheet A03512-3) |
| Fixation | Image fixative and duration unreported (datasheet A03512-3); verify before use. |
| Sectioning | 4–5 µm sections on charged slides (standard) |
| Deparaffinisation | Xylene, graded ethanol series to water (standard) |
| Antigen retrieval | Heat retrieval: EDTA pH 8.0 (datasheet A03512-3); 20 min, 95–100 °C (standard) |
| Peroxidase block | 3% H2O2, 10 min, room temperature (standard) |
| Blocking | 10% goat serum (datasheet A03512-3) |
| Primary antibody | Rabbit anti-GYS1, 2-5 μg/ml (datasheet A03512-3) |
| Primary incubation | Overnight at 4 °C (datasheet A03512-3) |
| Detection | Streptavidin-biotin complex (SABC), DAB chromogen (datasheet A03512-3) |
| Counterstain | Hematoxylin, blue, dehydrate and mount (standard) |
| Expected result | GYS1-positive staining in glandular cells of adrenal gland (HPA tissue IHC: High). HPA tissue profile: Cytoplasmic expression in most tissues, highly abundant in muscle cells. No signal in the no-primary control. |
GYS1 should appear chiefly in the cytoplasm across many tissues and be especially abundant in muscle cells (HPA: tissue IHC profile). Cytosol and microtubules are approved locations in ICC-IF (HPA: subcellular). It has no transmembrane segment or signal peptide (UniProt P13807 topology and processing). HPA rates its tissue IHC reliability Enhanced, while describing only medium agreement with RNA data and pending external verification (HPA: tissue IHC reliability).
| Cytoplasmic staining in muscle cells and other expected cells. | This fits the reported tissue pattern; muscle cells are especially abundant (HPA: tissue IHC profile). Judge intensity within each tissue: high staining is recorded in several glandular and neuronal cell populations, while some other populations are low (HPA: tissue IHC levels). A weak cell is therefore not automatically a failed stain. |
| Predominantly nuclear, cell-surface, or extracellular staining. | These patterns depart from the reported cytoplasmic tissue pattern (HPA: tissue IHC profile). An exclusively cell-surface pattern also lacks support from GYS1 topology and processing (UniProt P13807). Treat the discordance as a possible artefact and check controls; compartment alone cannot identify its cause (general IHC practice). |
| Strong staining in a cell population reported as low. | Strong staining in chondrocytes, bone-marrow hematopoietic cells, or lung type II alveolar cells merits scrutiny (HPA: low tissue IHC levels). These are low observations, not validated negative controls (HPA: tissue IHC levels). Cross-reactivity or endogenous chromogenic activity is possible; compare control slides before assigning a cause (general IHC practice). |
| Diffuse color across cells, stroma, and blank areas. | A broad deposit that ignores cell boundaries is difficult to reconcile with the reported cellular pattern (HPA: tissue IHC profile). In chromogenic IHC, incomplete blocking, endogenous detection activity, or excessive detection background can produce nonspecific color (general IHC practice). Assess the background with a matched negative detection control. |
| No discernible staining in a suitable positive tissue. | Absent cytoplasmic signal in muscle is discordant with its reported abundance (HPA: tissue IHC profile). Confirm that the specimen contains the expected cells, then review the antibody and detection controls (general IHC practice). The HPA tissue record does not establish a GYS1-specific fixation or antigen-retrieval failure mechanism. |
| Cellular location and topology | Cytoplasmic tissue staining is the reference pattern (HPA: tissue IHC profile). GYS1 lacks a transmembrane segment, signal peptide, and propeptide (UniProt P13807 topology and processing). These facts support checking unexpected surface or extracellular color, but do not prove that every such deposit is nonspecific. |
| Tissue and cell context | The profile spans most tissues and is especially abundant in muscle cells (HPA: tissue IHC profile). Listed low populations are useful comparators, but the supplied record lists no negative population (HPA: tissue IHC levels). Do not score every faint cell as negative or require uniform intensity across tissues. |
| Antibody validation | One listed antibody has Enhanced IHC validation and another has Supported IHC validation (HPA: CAB007793 and HPA041598 antibody records). The overall tissue profile still has medium staining-to-RNA consistency and awaits external verification (HPA: tissue IHC reliability). Interpret an unexpected pattern with controls and independent evidence. |
| Isoforms and epitope scope | Two isoforms are recorded (UniProt P13807 isoforms). The supplied evidence gives no antibody epitope or isoform coverage, so a staining difference cannot be assigned to an isoform from this record. Fifteen modified residues are recorded, including phosphoserines (UniProt P13807 modified residues); antibody sensitivity to them is unspecified. |
| IF/ICC Q&A: what location is reported? | Cytosol and microtubules are approved ICC-IF locations, with images listed for A-431, U-251MG, and U2OS (HPA: subcellular). That observation can inform interpretation of cellular localization; it does not supply an IF/ICC protocol or establish how a paraffin-section chromogenic pattern will resolve microtubules. |
| Situation | Likely cause | Next action |
|---|---|---|
| Muscle-containing section is blank. | The result conflicts with reported abundance in muscle cells (HPA: tissue IHC profile); the failure point is undetermined. | Confirm muscle is present, inspect a known-positive control, and review primary-antibody and chromogenic detection steps (general IHC practice). Do not attribute the blank section specifically to fixation or retrieval without evidence. |
| Signal appears only in nuclei or at cell surfaces. | The distribution conflicts with cytoplasmic tissue staining (HPA: tissue IHC profile) and, for surface-only signal, with the absence of a transmembrane segment (UniProt P13807 topology). | Compare with a negative detection control and the expected cytoplasmic cells; review staining specificity before scoring those compartments as GYS1 (general IHC practice). |
| Color is widespread in stroma or outside cells. | Noncellular deposit is inconsistent with the reported cellular profile (HPA: tissue IHC profile). Endogenous chromogenic activity or detection background can contribute (general IHC practice). | Examine a control lacking primary antibody, check endogenous-activity blocking appropriate to the detection system, and reassess wash and detection conditions (general IHC practice). |
| A reported low cell population stains strongly. | The result differs from a low HPA observation but does not by itself prove cross-reactivity (HPA: low tissue IHC levels). | Compare the same cell population with a negative detection control and a positive tissue control; seek independent confirmation if the strong pattern persists (general IHC practice). |
| A few cells stain weakly while nearby cells stain strongly. | Intensity need not be uniform: HPA reports high staining in some cell populations and low staining in others (HPA: tissue IHC levels). | Identify and score the relevant cell types separately; use the tissue's reported pattern as context before treating weak cells as a technical failure (HPA: tissue IHC profile; general IHC practice). |
| Two antibodies give different patterns. | The listed antibodies have different IHC validation statuses (HPA: antibody records), and the supplied evidence does not specify their epitope or isoform coverage. | Compare each result against the cytoplasmic tissue profile and controls, then report the disagreement rather than choosing a pattern by intensity alone (HPA: tissue IHC profile; general IHC practice). |
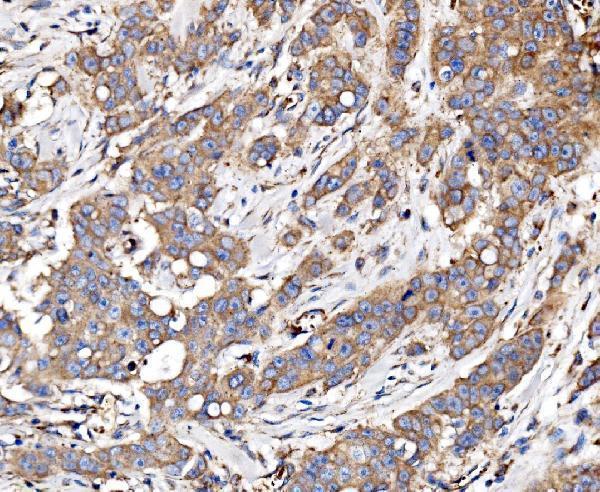
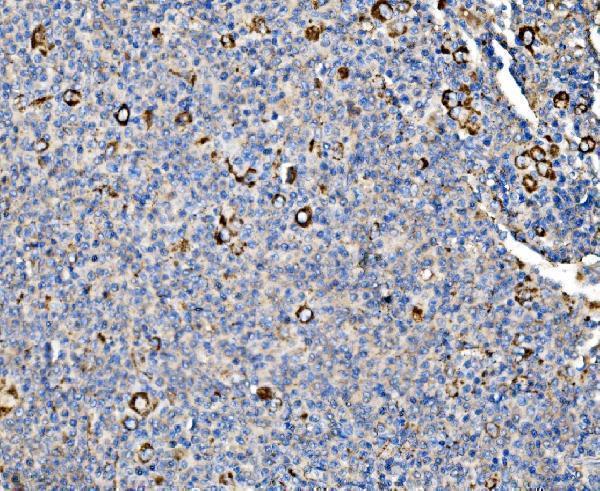
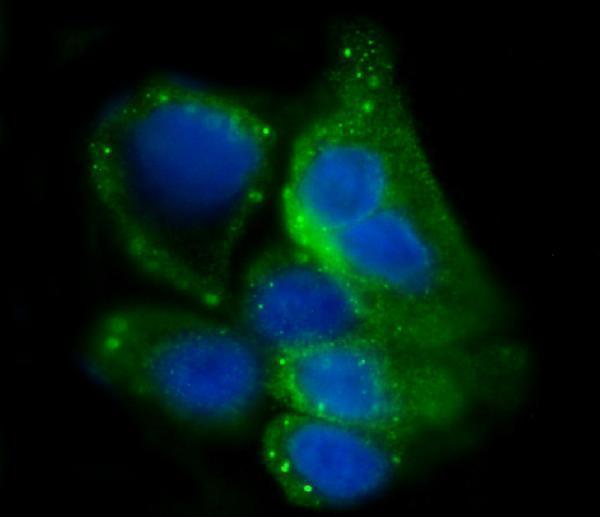
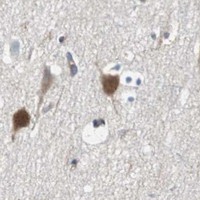
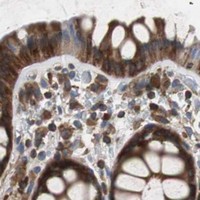
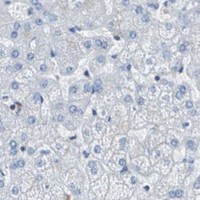


Comprehensive Human Protein Atlas IHC scoring per tissue (reliability: Enhanced — Medium consistency between antibody staining and RNA expression data. Pending external verification.). Rows are taken directly from the HPA tissue chart — click any row's HPA link to view the source.
| Tissue | Cell type | Level | Evidence | Source |
|---|---|---|---|---|
| Adrenal gland | Glandular cells | High | Protein (IHC) | HPA → |
| Appendix | Glandular cells | High | Protein (IHC) | HPA → |
| Breast | Glandular cells | High | Protein (IHC) | HPA → |
| Bronchus | Respiratory epithelial cells | High | Protein (IHC) | HPA → |
| Cerebellum | Cells in molecular layer | High | Protein (IHC) | HPA → |
| Tissue | Cell type | Level | Evidence | Source |
|---|---|---|---|---|
| None in HPA: GYS1 is detected in all 45 scored tissues. Use a no-primary (secondary-only) and an isotype control instead. | ||||
Troubleshoot GYS1 staining in paraffin sections by checking retrieval, cellular distribution and controls before comparing signal intensity (datasheet A03512-3; HPA tissue IHC).
A03512-3 has human paraffin-section IHC images and IF data from A431 cells (catalog image captions); its listed reactivity covers human, mouse and rat (catalog reactivity).
A03512-3 has IHC images from human breast cancer, lymphoma, placenta and renal clear cell carcinoma sections, plus IF data from A431 cells (catalog image captions). M03512 and M03512-2 list IHC and IF applications with human, mouse and rat reactivity (catalog applications and reactivity); P03512-2 lists IHC and IF with human and mouse reactivity (catalog applications and reactivity).
Which to pick: For tissue IHC, pick A03512-3: its own captions document staining in human paraffin sections after EDTA retrieval at pH 8.0, using 2 μg/ml primary antibody (A03512-3 IHC image captions); the fixative is unreported (A03512-3 IHC image captions). For IF/ICC, A03512-3 has an IF image from A431 cells at 5 μg/ml (A03512-3 IF image caption); M03512-2 is a rabbit monoclonal option listed for IF and IHC (M03512-2 catalog description and applications). For cross-species planning, A03512-3 and M03512-2 list human, mouse and rat reactivity, while P03512-2 lists human and mouse reactivity (catalog reactivity).