HAT1 / Histone acetyltransferase type B catalytic subunit · IHC design guide

Design Immunohistochemistry for HAT1

Plan chromogenic IHC-P for HAT1 around the predominantly nuclear pattern seen in most tissues (HPA tissue IHC). Colon glandular cells show high staining (HPA tissue IHC); for catalog antibody M03596, start at 1:50 (datasheet: M03596).

Evidence assembled Oct 2026 · For research use; verify linked source records and product datasheet before use
Immunohistochemistry protocol sheet for HAT1 (IHC for HAT1): expected localisation Predominantly nuclear in most tissues (HPA tissue IHC), antibody M03596, validated IHC image, and IHC protocol steps
Printable HAT1 IHC protocol sheet — expected localisation Predominantly nuclear in most tissues (HPA tissue IHC), antibody M03596, controls and protocol steps. Open the full HAT1 IHC guide →

HAT1 Immunohistochemistry Experimental Design Guide

Expected localisation, validated protocols, controls and antibodies — the at-a-glance facts below, then the full design guide.

Must know before staining
Expected localisation Predominantly nuclear in most tissues (HPA tissue IHC)
Staining pattern Nuclear staining across most tissue cell types (HPA tissue IHC)
Antigen retrieval EDTA pH 8.0 HIER, heat-mediated (datasheet M03596)
Positive control ⓘ Appendix+4 more · see all
Negative control ⓘ Adipose tissue+4 more · see all
Important caveats
Reasons your staining may differ from the expected pattern.
Fixation Keep fixation consistent across sections. (standard IHC practice; not target-specific)
Caveat Some cell types, including adipocytes, are unstained (HPA tissue IHC)
Regulation Stress enhances nuclear localisation (UniProt)
Isoform / epitope Two isoforms, A and B; check epitope coverage (UniProt)
Section 1

Recommended HAT1 IHC & IF Protocols

The catalog antibody uses EDTA pH 8.0 heat retrieval (datasheet M03596). The published mouse ovary IHC protocol uses Tris-EDTA pH 9.0 (PMC10617186).

Recommended immunohistochemistry (IHC-P) protocol parameters
SampleParaffin-embedded human liver cancer tissue; fixative not specified (datasheet M03596)
FixationImage fixative and duration unreported (datasheet M03596); verify before use.
Sectioning4–5 µm sections on charged slides (standard)
DeparaffinisationXylene, graded ethanol series to water (standard)
Antigen retrievalHeat retrieval: EDTA pH 8.0 (datasheet M03596); 20 min, 95–100 °C (standard)
Peroxidase block3% H2O2, 10 min, room temperature (standard)
Blocking10% goat serum (datasheet M03596)
Primary antibodyRabbit monoclonal (clone 21H24) anti-HAT1, 1:50 (datasheet M03596)
Primary incubationOvernight at 4 °C (datasheet M03596)
DetectionHRP-conjugated secondary, DAB chromogen (datasheet M03596)
CounterstainHematoxylin, blue, dehydrate and mount (standard)
Expected resultHAT1-positive staining in glandular cells of appendix (HPA tissue IHC: High). HPA tissue profile: Nuclear expression in most tissues. No signal in the no-primary control.
💡Decision noteStart with EDTA pH 8.0 for the catalog antibody (datasheet M03596); use Tris-EDTA pH 9.0 when reproducing the mouse ovary protocol (PMC10617186).
Section 2

What Is the Expected HAT1 Staining Pattern?

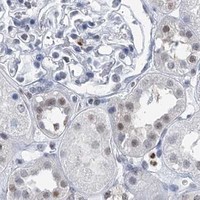
In paraffin section IHC, expect HAT1 staining mainly in nuclei across many tissues, including high signal in appendix and colon glandular cells and bone marrow hematopoietic cells (HPA: nuclear expression in most tissues; High in these cells). UniProt also lists cytoplasmic and mitochondrial locations, but describes normal cells as predominantly nuclear (UniProt O14929). HAT1 has no transmembrane segment (UniProt O14929 topology). HPA rates the tissue IHC pattern Supported, with medium consistency against RNA expression (HPA: reliability).

What am I looking at on my slide?
Distinct nuclear chromogen in appendix or colon glandular cells, with nuclei identifiable by counterstain.This matches the expected compartment and cell types (HPA: nuclear expression in most tissues; High in these glandular cells). Score the fraction and intensity of stained nuclei within the relevant cell population, keeping the HPA pattern as a reference rather than a required score for every specimen.
Signal is predominantly cytoplasmic, membranous or extracellular, with little nuclear staining in an otherwise positive cell population.Recheck staining specificity and optical separation of compartments: the baseline tissue pattern is nuclear (HPA: tissue IHC), and HAT1 lacks a transmembrane segment (UniProt O14929 topology). Cytoplasmic signal alone is not proof of an artefact because UniProt also lists cytoplasmic localization (UniProt O14929).
Strong signal appears in adipocytes or lung alveolar cells while expected positive nuclei are weak.HPA reports these specific cell populations as Not detected (HPA: adipose adipocytes; lung alveolar cells). Consider antibody cross-reactivity or endogenous chromogenic activity, then inspect control slides. These observations do not establish that every cell in adipose tissue or lung is negative.
Chromogen spreads across nuclei, cytoplasm and extracellular areas, obscuring cell boundaries.This is difficult to interpret as HAT1 localization because the reference IHC pattern is nuclear (HPA: tissue IHC). General IHC causes include nonspecific antibody binding, endogenous detection activity or excessive chromogen development; compare controls before assigning a cellular score.
No nuclear signal appears in appendix or colon glandular cells on a run expected to be positive.These populations are reported High by HPA (HPA: appendix and colon glandular cells). A blank result warrants a run-level check of antibody, retrieval and detection steps (general IHC practice). HPA's Supported rating and medium RNA agreement do not guarantee staining in every specimen (HPA: reliability).
💡Expected HAT1 appearanceCall a result consistent when discrete nuclear chromogen is visible in HPA High cell populations such as colon glandular cells, with interpretable counterstained nuclei; broad extracellular or uniformly diffuse color is suspect (HPA: nuclear expression; High in colon glandular cells; general IHC interpretation).
How each factor affects the staining
Cell type within the tissueUse cell-level expectations: appendix and colon glandular cells and bone marrow hematopoietic cells are High, while adipocytes and lung alveolar cells are Not detected (HPA: tissue IHC). Avoid labeling an entire organ positive or negative from one listed cell population.
Strength of the reference patternHPA describes nuclear expression in most tissues, but its IHC reliability is Supported with medium consistency against RNA expression (HPA: tissue profile; reliability). Treat a match as supportive evidence, and investigate a mismatch with appropriate controls rather than declaring identity from staining alone.
Location under cellular stressUniProt describes HAT1 as predominantly nuclear in normal cells and reports enhanced nuclear localization after hydrogen peroxide or ionizing radiation through redistribution of existing protein (UniProt O14929 subcellular location). Interpret an unusually strong nuclear fraction in light of documented specimen treatment.
Antibody validationTwo listed antibodies have Supported IHC status, HPA036788 and CAB037191 (HPA: antibody validation). This supports use of the nuclear reference pattern; it does not establish identical staining for every catalog antibody or supply a dilution, retrieval condition or diagnostic threshold.
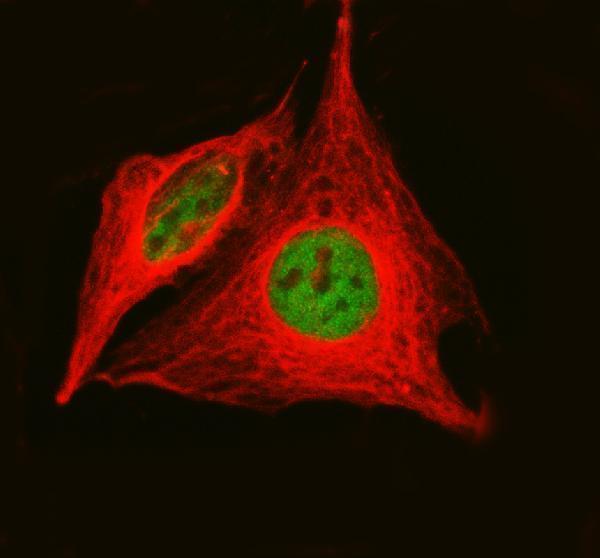
Does IF/ICC offer a localization cross-check?Yes. HPA reports supported nucleoplasmic localization by ICC-IF and lists A-431, U-251MG and U2OS images; HPA036788 has Supported ICC status (HPA: subcellular; antibody validation). This informs compartment interpretation, while IF/ICC setup belongs in its separate guide.
Why is my staining missing, weak or wrong?
SituationLikely causeNext action
Expected positive nuclei remain blank.A failed antibody, retrieval or detection step is possible (general IHC practice); a blank result alone does not establish absent HAT1.Check a concurrently stained appendix or colon section for nuclear signal in glandular cells (HPA: High in these cells). Review the catalog antibody's IHC-P instructions and run controls before interpreting the specimen.
Negative control shows brown deposits or broad tissue staining.Endogenous detection activity or nonspecific reagent binding can create chromogenic signal (general IHC practice).Compare reagent controls, check the detection system's endogenous activity block, and inspect whether color follows cell nuclei (general IHC practice; HPA: nuclear tissue pattern).
Cytoplasmic color dominates and nuclear outlines are hard to assess.Diffuse background or overlapping cellular color may obscure the expected nuclear pattern (HPA: tissue IHC); UniProt also lists cytoplasmic HAT1 (UniProt O14929).Examine a well-counterstained positive cell population and control slides; optimize routine blocking, antibody concentration and chromogen development as needed (general IHC practice). Avoid calling all cytoplasmic signal false without supporting controls.
Adipocytes or alveolar cells stain strongly.The result conflicts with HPA's Not detected entries for those cells (HPA: adipose adipocytes; lung alveolar cells). Cross-reactivity or endogenous activity is possible (general IHC practice).Confirm the stained cell identity, review the negative control, and compare nuclear signal in a listed positive population from the same run (HPA: tissue IHC).
Signal varies sharply between sections in one staining run.Uneven section processing, reagent coverage or detection can produce technical variation (general IHC practice); HPA supplies no HAT1-specific fixation sensitivity.Compare control-section performance and processing records, then repeat the inconsistent section with the same validated IHC-P workflow (general IHC practice). Do not infer a HAT1-specific fixation effect from this pattern.
A specimen shows much stronger nuclear staining than expected.Biological redistribution is possible if hydrogen peroxide or ionizing radiation treatment is documented (UniProt O14929 subcellular location); run variation is also possible (general IHC practice).Check treatment history and concurrent controls, then score nuclear intensity and the proportion of positive cells separately (general IHC practice). Do not infer treatment from staining alone.

Sample controls for HAT1 IHC & IF

🧪Run colon first and look for staining in its glandular cells (HPA: High in colon glandular cells). Use adipose tissue adipocytes as the negative reference (HPA: Not detected in adipocytes); on the colon slide, assess nonglandular cells for background, but do not assume they are HAT1-negative without validation (HPA: colon glandular-cell result).
Positive control tissue: Appendix (Glandular cells, HPA High)
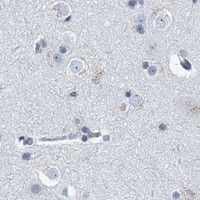
Negative control tissue: Adipose tissue (HPA Not detected)
ICC-IF cell lines (HPA subcellular resource): HPA ICC-IF images show HAT1 in A-431, U-251MG, U2OS, with annotated localisation: Nucleoplasm (supported) (HPA subcellular).
Technical controls: Include a no-primary, secondary-only control; a concentration-matched rabbit IgG isotype control matched to the primary antibody’s clonality; and a HAT1-knockout biological control or cognate-peptide block if available (M03596 caption: rabbit primary; standard IHC practice). Block endogenous peroxidase and check nonspecific DAB signal in the colon section (M03596 caption: HRP/DAB detection; standard IHC practice).
⚠️Feasibility: A target-specific fixation window or fixation effect is unreported, and the selected M03596 paraffin-section caption does not state its fixative (M03596 caption). That caption uses heat retrieval in EDTA at pH 8.0 before staining, but does not establish that retrieval is required under other conditions (M03596 caption). No supplied matched comparison establishes whether frozen sections or IF/ICC are easier; for colon, distinguish glandular-cell staining from luminal background (HPA: High in colon glandular cells; standard IHC practice).

HPA tissue IHC evidence for HAT1

Comprehensive Human Protein Atlas IHC scoring per tissue (reliability: Supported — Medium consistency between antibody staining and RNA expression data.). Rows are taken directly from the HPA tissue chart — click any row's HPA link to view the source.

Positive expression · recommended positive controls

TissueCell typeLevelEvidenceSource
Appendix Glandular cells High Protein (IHC) HPA →
Bone marrow Hematopoietic cells High Protein (IHC) HPA →
Bronchus Ciliated cells (cell body) High Protein (IHC) HPA →
Cervix Squamous epithelial cells High Protein (IHC) HPA →
Colon Glandular cells High Protein (IHC) HPA →

Undetected expression · recommended negative controls

TissueCell typeLevelEvidenceSource
Adipose tissue Adipocytes Not detected Protein (IHC) HPA →
Cerebellum Cells in granular layer Not detected Protein (IHC) HPA →
Cerebral cortex Endothelial cells Not detected Protein (IHC) HPA →
Hippocampus Glial cells Not detected Protein (IHC) HPA →
Liver Cholangiocytes Not detected Protein (IHC) HPA →
Section 3

Advanced HAT1 IHC Tips

Troubleshoot HAT1 staining in paraffin sections by checking retrieval, nuclear localisation, cell type and controls before interpreting signal intensity.

What retrieval should I try first when HAT1 staining is weak?
Use heat-mediated antigen retrieval in EDTA at pH 8.0 first (datasheet M03596). The selected paraffin-section image used that retrieval, followed by 10% goat serum blocking and a 1:50 primary antibody incubation overnight at 4°C (caption M03596). If nuclear staining is weak, compare retrieval heating and cooling conditions on adjacent sections while keeping antibody concentration and detection constant (standard IHC practice). Include a positive-control section with expected nuclear staining, such as colon glandular cells, and assess its nuclei alongside the study section (HPA tissue IHC: high in colon glandular cells; standard IHC practice).
Could fixation explain weak or patchy HAT1 staining?
The selected HAT1 image shows a paraffin-embedded section, but its caption does not report a fixative or fixation duration (caption M03596). Target-specific fixation sensitivity is therefore unknown; neither the tissue staining profile nor HAT1 topology establishes how fixation changes this epitope (HPA tissue IHC; UniProt O14929 topology). Check the specimen’s recorded fixative and fixation time, then compare sections with known processing histories under the same retrieval and detection conditions (standard IHC practice). Treat staining differences across differently processed blocks as provisional until a matched positive control shows that the assay worked in each processing group (standard IHC practice).
How should I assess cytoplasmic or mitochondrial HAT1 staining?
Prioritise nuclear staining in ordinary tissue sections: HAT1 is predominantly nuclear in normal cells, and the tissue IHC profile reports nuclear expression in most tissues (UniProt O14929 subcellular; HPA tissue IHC). UniProt also lists cytoplasmic and mitochondrial localisation, so extra-nuclear staining deserves evaluation rather than automatic rejection (UniProt O14929 subcellular). Compare nuclear and extra-nuclear signals within the same intact cell population, using morphology and a counterstain to define compartments (standard IHC practice). Hydrogen peroxide treatment or ionising radiation can enhance nuclear localisation through redistribution of existing HAT1, so record those exposures before comparing compartments across specimens (UniProt O14929 subcellular).
Can isoforms or modified residues explain discordant HAT1 staining?
HAT1 has two annotated isoforms, A and B, but the supplied antibody evidence does not define which isoform its epitope recognises (UniProt O14929 isoforms; caption M03596). Its listed modifications include acetylation at residues 2, 9 and 15 and phosphorylation at 190 and 343; their effects on this antibody’s binding are unreported (UniProt O14929 modified residues; caption M03596). Do not assign a staining difference to an isoform or modification without an epitope map and independent validation (standard IHC practice). Instead, compare serial sections using consistent retrieval and detection, and document whether the discrepancy concerns signal intensity, cell type or subcellular distribution (standard IHC practice).
How can I check whether an IF signal matches HAT1 staining?
Use IF as a complementary localisation check: supported nucleoplasmic localisation and ICC/IF images in A-431, U-251MG and U2OS provide cellular context, but do not validate this catalog antibody for IF (HPA subcellular; caption M03596). In tissue, multiplex with a marker identifying the expected cell population, such as a glandular epithelial marker when examining colon glandular cells, and include a nuclear counterstain (HPA tissue IHC: high in colon glandular cells; standard IF practice). Choose a far-red fluorophore when shorter wavelengths show tissue autofluorescence, with single-stain controls for bleed-through (standard IF practice). Because HAT1 lacks a transmembrane segment and is predominantly nuclear, assess permeabilisation sufficient to access nuclear epitopes without losing cell structure (UniProt O14929 topology and subcellular; standard IF practice).
What should I change when DAB background obscures HAT1 nuclei?
First compare staining with a no-primary control and inspect whether brown signal follows cells, tissue edges or damaged areas (standard IHC practice). The selected image used a peroxidase-conjugated secondary antibody and DAB, making an endogenous peroxidase block and a controlled DAB development time relevant general workflow checks (caption M03596; standard IHC practice). Its 10% goat serum block and 1:50 primary dilution are starting conditions from one paraffin-section image, not proof that they minimise background in every specimen (caption M03596). If diffuse signal persists, check wash stringency and antibody concentration while preserving the expected nuclear pattern in a positive control (HPA tissue IHC; standard IHC practice).
How should I score HAT1 IHC across specimens? ⚠ ANSWER MARKED FOR VERIFICATION
Define the cell population and score nuclear staining consistently, because tissue IHC reports nuclear expression in most tissues (HPA tissue IHC; standard IHC practice). Report the percentage of positive nuclei and, when intensity is reproducible, an H-score from 0–300 based on the percentages at each staining intensity (standard IHC practice). Normalise counts to the number of evaluable nuclei in the same cell population, or report positive-cell density per mm² of viable analysed tissue (standard IHC practice). Keep retrieval, imaging or visual scoring criteria, background threshold and exclusion rules consistent across specimens; record cytoplasmic signal separately (standard IHC practice; UniProt O14929 subcellular).
How do I distinguish convincing HAT1 staining from artefact?
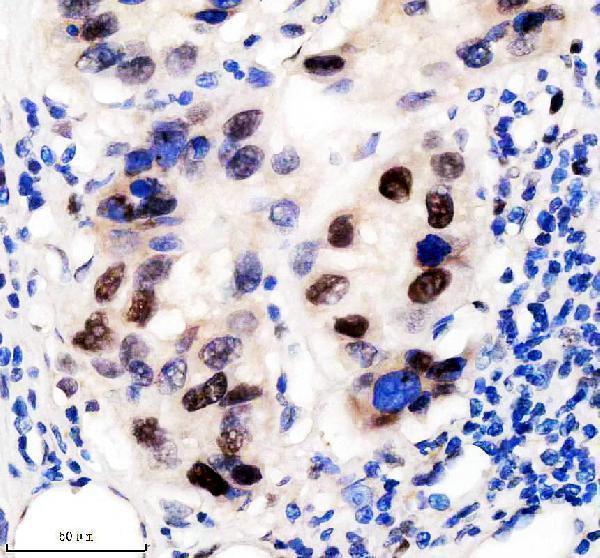
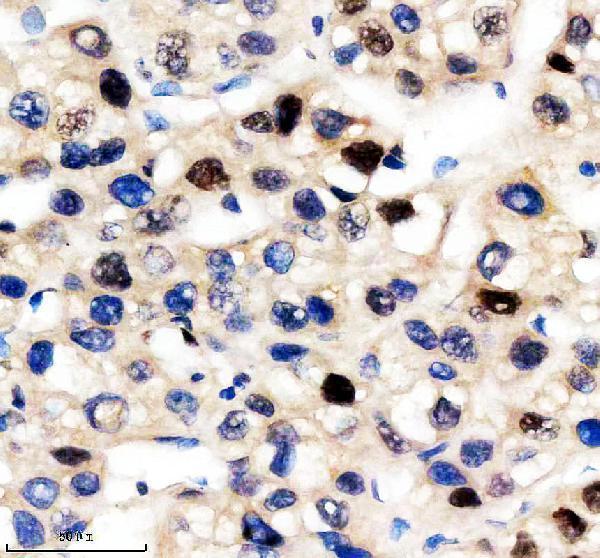
A convincing result shows interpretable cellular staining with a substantial nuclear component, consistent with HAT1’s predominant nuclear localisation and the tissue IHC profile (UniProt O14929 subcellular; HPA tissue IHC). Confirm the expected cell population: colon glandular cells are reported high, whereas liver cholangiocytes are reported not detected (HPA tissue IHC). Treat staining confined to section edges, necrotic regions or no-primary controls as suspect, and check endogenous peroxidase when evaluating DAB signal (standard IHC practice). The selected image demonstrates staining in a human liver cancer paraffin section, but does not establish that every cell in that tissue should stain or identify the fixative (caption M03596).
Boster reagents

Best HAT1 / Histone acetyltransferase type B catalytic subunit IHC Antibodies

Anti-HAT1 antibodies have IHC images from human liver cancer, human lung cancer, mouse bladder and rat thymus paraffin sections, plus an IF image from HeLa cells (catalog image captions).

Real IHC data IHC analysis of KAT1 using anti-KAT1 antibody (M03596). KAT1 was detected in a paraffin-embedded section of human liver cancer tissue. Heat mediated antigen retrieval was performed in EDTA buffer (pH 8.0, epitope retrieval solution). The tissue section was blocked with 10% goat serum. The tissue section was then incubated with 1:50 rabbit anti-KAT1 Antibody (M03596) overnight at 4°C. Peroxidase Conjugated Goat Anti-rabbit IgG was used as secondary antibody and incubated for 30 minutes at 37°C. The tissue section was developed using HRP Conjugated Rabbit IgG Super Vision Assay Kit (Catalog # SV0002) with DAB as the chromogen.
Anti-KAT1 / HAT1 Rabbit Monoclonal Antibody
Cat # M03596
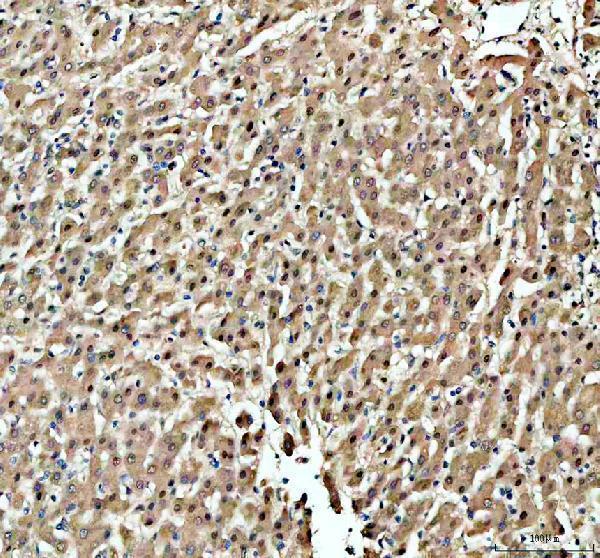
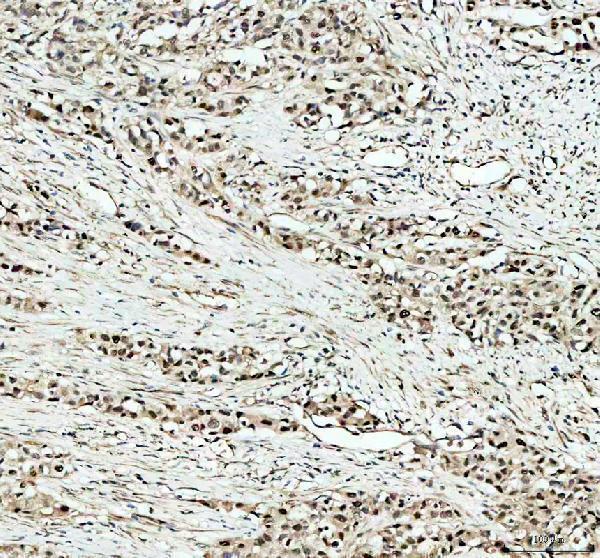
Real IHC data IHC analysis of KAT1/HAT1 using anti-KAT1/HAT1 antibody (A03596-2). KAT1/HAT1 was detected in a paraffin-embedded section of human liver cancer tissue. Heat mediated antigen retrieval was performed in EDTA buffer (pH 8.0, epitope retrieval solution). The tissue section was blocked with 10% goat serum. The tissue section was then incubated with 2 μg/ml rabbit anti-KAT1/HAT1 Antibody (A03596-2) overnight at 4°C. Peroxidase Conjugated Goat Anti-rabbit IgG was used as secondary antibody and incubated for 30 minutes at 37°C. The tissue section was developed using HRP Conjugated Rabbit IgG Super Vision Assay Kit (Catalog # SV0002) with DAB as the chromogen.
Anti-KAT1/HAT1 Antibody ®
Cat # A03596-2

M03596 has IHC images from human liver cancer, mouse bladder and rat thymus paraffin sections; IHC and IF/ICC are listed applications (M03596 catalog images and applications). A03596-2 has IHC images from human liver and lung cancer paraffin sections and an IF/ICC image from HeLa cells (A03596-2 catalog images).

Which to pick: For tissue IHC, both SKUs have paraffin-section images: M03596 used 1:50 and A03596-2 used 2 μg/ml, each with EDTA retrieval at pH 8.0; the fixative is unreported in both captions (M03596 and A03596-2 IHC image captions). Choose A03596-2 for IF/ICC when an imaged example matters: its HeLa-cell IF caption documents 5 μg/ml, while M03596 lists IF/ICC without an IF image (A03596-2 IF image caption; M03596 applications and image list). For IHC across species, M03596 has human, mouse and rat paraffin-section images and is listed as rabbit monoclonal clone 21H24; A03596-2 lists human, mouse and rat reactivity but its IHC images show human sections (M03596 catalog and IHC image captions; A03596-2 catalog and IHC image captions).

Each figure is that product's own IHC / IF validation image from its datasheet.

References

  1. UniProt Consortium. UniProt entry O14929 (HAT1_HUMAN, Histone acetyltransferase type B catalytic subunit).
  2. Human Protein Atlas. HAT1 tissue IHC expression (reliability: Supported).
  3. Human Protein Atlas. HAT1 subcellular location (ICC-IF): Localized to the nucleoplasm..
  4. Human Protein Atlas. HAT1 antibody validation summary (2 antibodies).
  5. Histopathological and epigenetic changes in myocardium associated with cancer therapy-related cardiac dysfunction. ESC heart failure 2022 — PMC9715834.
  6. Decreased HAT1 expression in granulosa cells disturbs oocyte meiosis during mouse ovarian aging. Reproductive biology and endocrinology : RB&E 2023 — PMC10617186.
  7. Overexpressed histone acetyltransferase 1 regulates cancer immunity by increasing programmed death-ligand 1 expression in pancreatic cancer. Journal of experimental & clinical cancer research : CR 2019 — PMC6359760.
  8. Histone acetyltransferase 1 promotes ovarian cancer progression by regulating cell proliferation and the cell cycle. Oncology letters 2025 — PMC12490291.
  9. PubMed PMID:9427644 — UniProt-cited evidence.
  10. PubMed PMID:15815621 — UniProt-cited evidence.
  11. PubMed PMID:15489334 — UniProt-cited evidence.