This website uses cookies to ensure you get the best experience on our website.


- Table of Contents
Plan chromogenic HGD IHC in paraffin sections using liver hepatocytes as a positive control (HPA tissue IHC). Start catalog antibody A01909-1 at 0.5–1 μg/ml (datasheet A01909-1) and compare with adipocytes, where staining was not detected (HPA tissue IHC).

Expected localisation, validated protocols, controls and antibodies — the at-a-glance facts below, then the full design guide.
| Expected localisation | Cytoplasmic staining in a subset of tissues (HPA tissue IHC) | |
| Staining pattern | Cytoplasmic staining in hepatocytes and glandular cells (HPA tissue IHC) | |
| Antigen retrieval | Citrate pH 6 HIER, heat-mediated (datasheet A01909-1) | |
| Positive control | Endometrium+4 more · see all | |
| Negative control | Adipose tissue+4 more · see all |
| Fixation | Keep fixation consistent across paraffin sections (standard IHC practice; not target-specific) | |
| Caveat | Liver endogenous peroxidase can mimic DAB staining (standard IHC practice) | |
| Regulation | Expression varies by tissue (UniProt) | |
| Isoform / epitope | No annotated isoforms; one 1–445 chain (UniProt) |
The catalog antibody’s IHC-P protocol is accompanied by one published HGD IHC method using mouse tissues (PMC13200543).
| Sample | Paraffin-embedded human liver cancer tissue; fixative not specified (datasheet A01909-1) |
| Fixation | Image fixative and duration unreported (datasheet A01909-1); verify before use. |
| Sectioning | 4–5 µm sections on charged slides (standard) |
| Deparaffinisation | Xylene, graded ethanol series to water (standard) |
| Antigen retrieval | Heat retrieval: Citrate pH 6, 20 min (datasheet A01909-1) |
| Peroxidase block | 3% H2O2, 10 min, room temperature (standard) |
| Blocking | 10% goat serum (datasheet A01909-1) |
| Primary antibody | Rabbit anti-HGD, 0.5-1μg/ml recommended; image 2μg/ml (datasheet A01909-1) |
| Primary incubation | Overnight at 4 °C (datasheet A01909-1) |
| Detection | Streptavidin-biotin complex (SABC), DAB chromogen (datasheet A01909-1) |
| Counterstain | Hematoxylin, blue, dehydrate and mount (standard) |
| Expected result | HGD-positive staining in ciliated epithelial cells of endometrium (HPA tissue IHC: High). HPA tissue profile: Cytoplasmic expression in a subset of tissues including liver, kidney, gallbladder, gastrointestinal tract, prostate and thyroid gland. No signal in the no-primary control. |
For paraffin-section IHC, expect HGD staining in the cytoplasm of selected epithelial cells, especially hepatocytes and gallbladder glandular cells (HPA: tissue IHC, High). Kidney proximal tubule cell bodies and prostate glandular cells show Medium staining (HPA: tissue IHC). The tissue pattern has Enhanced reliability (HPA: tissue IHC). HGD has no annotated transmembrane segment (UniProt Q93099 topology); its Golgi assignment comes from ICC-IF (HPA: subcellular ICC-IF).
| Strong cytoplasmic staining in hepatocytes, with staining concentrated in the expected cells. | This matches a High tissue-IHC result (HPA: liver hepatocytes, High). Judge the pattern by cell identity and compartment as well as intensity; staining throughout unrelated cells does not reproduce the reported distribution (HPA: tissue IHC profile). |
| Predominantly nuclear, membrane-rim or extracellular staining in an otherwise positive section. | Treat this as a pattern mismatch: HPA reports cytoplasmic tissue staining (HPA: tissue IHC profile), and UniProt annotates no transmembrane segment (UniProt Q93099 topology). Check controls and detection background before interpreting such staining as HGD. |
| Strong staining in adipocytes or bone-marrow hematopoietic cells. | These cells are reported as Not detected (HPA: adipose tissue adipocytes; bone marrow hematopoietic cells). Review the stained cell type and the no-primary control; cross-reactivity or endogenous detection activity may explain unexpected signal (general IHC practice). |
| Diffuse color across cells, stroma and the section background. | A field-wide deposit obscures the selective cytoplasmic pattern (HPA: tissue IHC profile). Compare a no-primary control and review blocking, washes and detection chemistry for nonspecific or endogenous signal (general IHC practice). |
| No detectable staining in a well-preserved liver section. | Hepatocytes are a High reference population (HPA: liver hepatocytes, High). A blank result warrants review of the IHC-validated antibody, retrieval and detection controls (general IHC practice); this section has no evidence for an HGD-specific fixation effect. |
| Choice of reference tissue and cell | Liver hepatocytes and gallbladder glandular cells provide High examples; kidney proximal tubules and prostate glandular cells are Medium (HPA: tissue IHC). Score the named cells, since whole-section intensity can obscure a selective result. |
| Strength of tissue-pattern evidence | Tissue IHC is rated Enhanced for consistency with RNA expression (HPA: tissue IHC reliability). Two listed antibodies have Enhanced IHC validation, HPA047374 and HPA052359 (HPA: antibodies); this supports the reported pattern without validating every staining condition. |
| Cellular location and assay | HPA describes cytoplasmic staining in tissue IHC, while its approved Golgi location comes from ICC-IF (HPA: tissue IHC; subcellular ICC-IF). The ICC-IF result alone does not require Golgi-resolved chromogenic staining in paraffin sections. |
| Protein architecture | HGD is a single annotated chain, residues 1–445, with no signal peptide, propeptide or transmembrane segment (UniProt Q93099 processing and topology). Those annotations provide no basis for expecting a shed or membrane-anchored IHC pattern. |
| IF/ICC Q: What location should I compare? | A: Compare a cellular IF/ICC result with the approved Golgi assignment (HPA: subcellular ICC-IF). That evidence is assay-specific; the paraffin-section comparison remains the cytoplasmic tissue-IHC profile (HPA: tissue IHC). |
| Situation | Likely cause | Next action |
|---|---|---|
| Liver control is blank while the counterstain and tissue morphology are visible. | Hepatocytes normally provide a High signal (HPA: liver hepatocytes, High); a blank control can reflect an assay or detection failure (general IHC practice). | Check the IHC-validated antibody, retrieval, primary incubation and detection controls against the run record (general IHC practice). Do not infer HGD-specific fixation sensitivity from this result. |
| Kidney appears weaker than liver. | That difference is consistent with the reported levels: proximal tubule cell bodies are Medium and hepatocytes are High (HPA: kidney; liver tissue IHC). | Score proximal tubule cell bodies separately and retain a liver reference in the comparison (HPA: kidney; liver tissue IHC). Investigate only if the expected cell-restricted signal disappears. |
| Signal is confined to nuclei or outlines cell membranes. | The compartment conflicts with cytoplasmic tissue staining (HPA: tissue IHC profile); HGD has no annotated transmembrane segment (UniProt Q93099 topology). | Inspect the no-primary control, stain distribution and cell morphology; reassess staining specificity before assigning the pattern to HGD (general IHC practice). |
| Strong color appears in adipocytes or bone-marrow hematopoietic cells. | Both populations are listed as Not detected (HPA: adipose tissue; bone marrow tissue IHC). Cross-reactivity or endogenous detection activity is a possible IHC explanation, not an established HGD finding. | Compare a no-primary control, review blocking and detection chemistry, and confirm the cell identity before scoring a positive result (general IHC practice). |
| Most cells and extracellular areas carry a similar faint stain. | Diffuse deposit can mask the selective cytoplasmic profile (HPA: tissue IHC profile); nonspecific staining or background detection is possible (general IHC practice). | Compare background with the no-primary control, then review blocking, wash stringency and detection steps (general IHC practice). Score only staining that remains cell-restricted. |
| An IF/ICC image looks Golgi-localized, but paraffin IHC looks broadly cytoplasmic. | The Golgi assignment is from ICC-IF, while the broader cytoplasmic description is from tissue IHC (HPA: subcellular ICC-IF; tissue IHC). | Interpret each image against its own assay's reference pattern. For paraffin IHC, prioritize the reported stained cell types and cytoplasmic distribution (HPA: tissue IHC). |
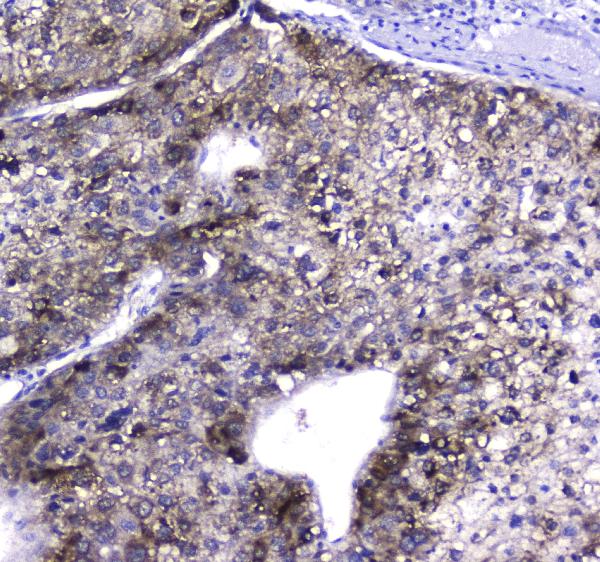
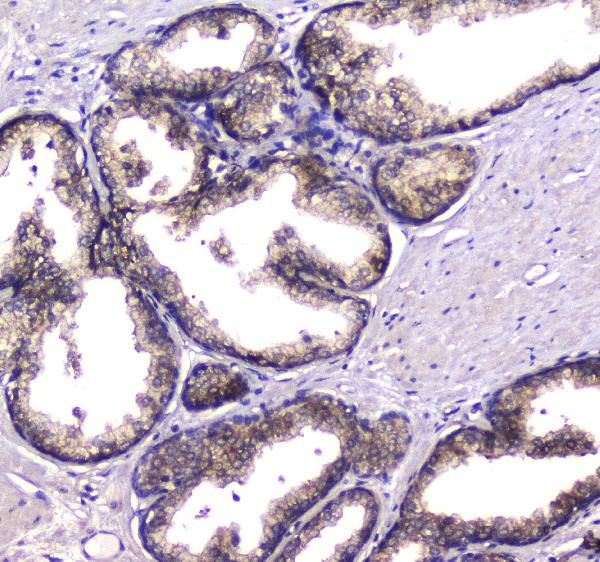
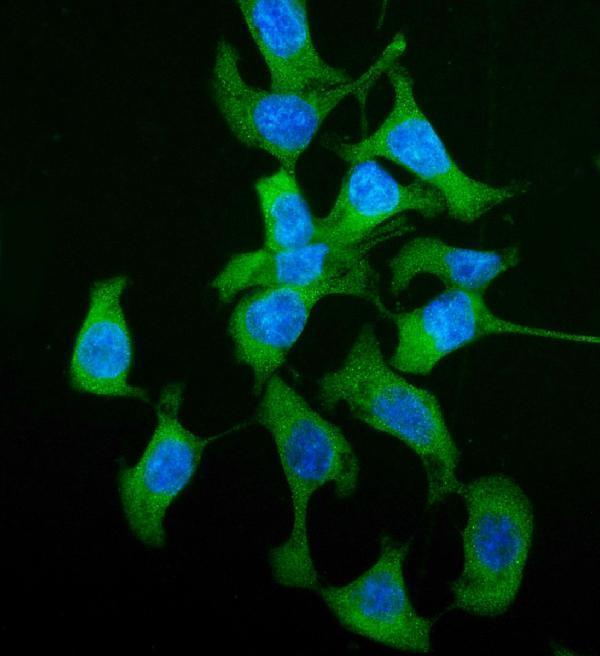
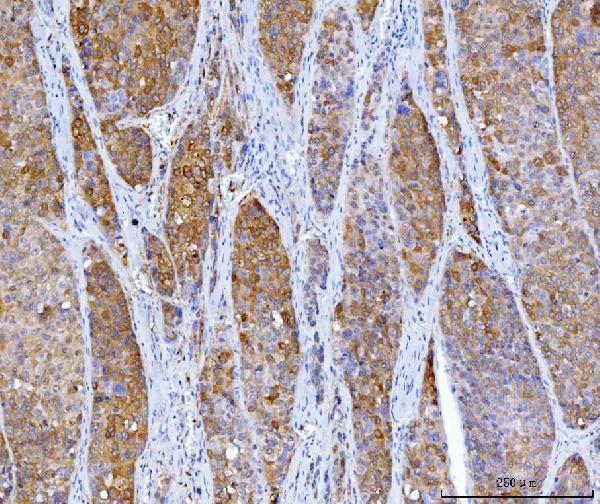


Comprehensive Human Protein Atlas IHC scoring per tissue (reliability: Enhanced — High consistency between antibody staining and RNA expression data.). Rows are taken directly from the HPA tissue chart — click any row's HPA link to view the source.
| Tissue | Cell type | Level | Evidence | Source |
|---|---|---|---|---|
| Endometrium | Ciliated epithelial cells | High | Protein (IHC) | HPA → |
| Gallbladder | Glandular cells | High | Protein (IHC) | HPA → |
| Liver | Hepatocytes | High | Protein (IHC) | HPA → |
| Duodenum | Glandular cells | Medium | Protein (IHC) | HPA → |
| Kidney | Proximal tubules (cell body) | Medium | Protein (IHC) | HPA → |
| Tissue | Cell type | Level | Evidence | Source |
|---|---|---|---|---|
| Adipose tissue | Adipocytes | Not detected | Protein (IHC) | HPA → |
| Adrenal gland | Glandular cells | Not detected | Protein (IHC) | HPA → |
| Appendix | Glandular cells | Not detected | Protein (IHC) | HPA → |
| Bone marrow | Hematopoietic cells | Not detected | Protein (IHC) | HPA → |
| Breast | Adipocytes | Not detected | Protein (IHC) | HPA → |
Troubleshoot HGD staining in paraffin sections by checking retrieval, cell type, localisation and controls alongside the chromogenic signal.
Anti-HGD antibodies have IHC images from paraffin-embedded human cancer sections (catalog IHC captions); A01909-1 also has an IF/ICC image from CACO-2 cells and lists human, mouse and rat reactivity (catalog IF caption; reactivity).
A01909-1 has IHC images from paraffin-embedded human liver and prostatic cancer sections and an IF/ICC image from CACO-2 cells (A01909-1 image captions). M01909-1 has an IHC image from a paraffin-embedded human liver cancer section (M01909-1 IHC caption).
Which to pick: For human tissue IHC, M01909-1 is a mouse monoclonal with a paraffin-section image using EDTA retrieval; A01909-1 is a rabbit antibody with paraffin-section images using citrate retrieval (catalog antibody details; respective IHC captions). For IF/ICC, choose A01909-1 because those applications are listed and its IF image shows CACO-2 cells (A01909-1 applications; IF caption). For cross-species IHC, A01909-1 lists human, mouse and rat reactivity, while M01909-1 lists human only; the fixative is unreported in both paraffin-section IHC captions (catalog reactivity; respective IHC captions).