This website uses cookies to ensure you get the best experience on our website.


- Table of Contents
Source-linked HPGD Western blot protocol options, expected-band and isoform facts, troubleshooting for weak or shifted signal, and recommended anti-HPGD WB antibodies. Everything you need to plan the experiment before you commit precious samples.

Expected bands, source-linked protocol options, controls and antibodies — the at-a-glance facts below, then the full design guide.
| Expected band | ~29 kDa | |
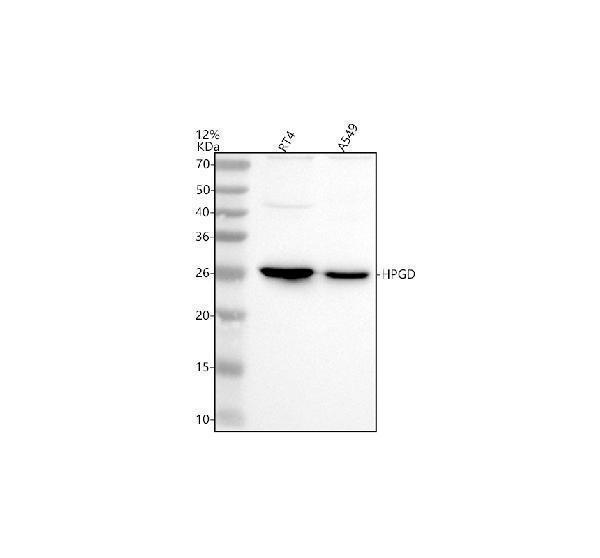
| Observed band | ~26 kDa | |
| Gel | 12% (catalog A02686-3) | |
| Positive control | Duodenum (IHC candidate; verify WB) +4 more | |
| Negative control | Adipose tissue (IHC candidate; verify WB) |
| PTM | — | |
| Caveat | Below predicted mass | |
| Gene-set association | MSigDB Hallmark membership | |
| Isoform | 5 isoform(s) |
The A02686-3 protocol combines labelled catalog values with standard starting conditions. Published comparisons retain their own sample, reagent and detection scope.
| Sample / lysate | human RT4, human A549 (catalog A02686-3) |
| Gel % | 12% (catalog A02686-3) |
| Load | 30 ug; reducing conditions (catalog A02686-3) |
| Transfer | a nitrocellulose membrane at 150 mA for 50-90 minutes (catalog A02686-3) |
| Membrane | nitrocellulose membrane (catalog A02686-3) |
| Blocking | 5% non-fat milk/TBS for 1.5 hour at RT (catalog A02686-3) |
| Primary antibody | A02686-3 · 0.5 μg/mL (catalog A02686-3) |
| Primary incubation | overnight at 4°C (catalog A02686-3) |
| Secondary antibody | goat anti-rabbit IgG-HRP, 1:5000 (catalog A02686-3) |
| Secondary incubation | 1.5 hour at RT (catalog A02686-3) |
| Wash | TBS-0.1%Tween 3 times with 5 minutes each (catalog A02686-3) |
| Detection | ECL (catalog A02686-3) |
HPGD is predicted at 29 kDa and observed at ~26 kDa in reducing whole-cell blots; the cause of the difference is not established.
| Band at ~26 kDa | Empirical HPGD band in reducing whole-cell lysates; confirm identity with a positive control |
| Band near 29 kDa | Near the UniProt predicted monomer mass; identity requires confirmation |
| Band near twice the monomer size | Could reflect a homodimer if it remains intact during electrophoresis |
| Several discrete bands | Five isoforms are listed, but distinct migration has not been established |
| UniProt predicted monomer mass | Predicts a band near 29 kDa; the observed band is ~26 kDa |
| Homodimer formation | Could produce a band near twice the monomer size if the dimer survives electrophoresis |
| Isoform 1 | Its individual apparent size is not supplied |
| Isoform 2 | May differ in size, but its individual apparent size is not supplied |
| Isoform 3 | May differ in size, but its individual apparent size is not supplied |
| Isoform 4 | May differ in size, but its individual apparent size is not supplied |
| Isoform 5 | May differ in size, but its individual apparent size is not supplied |
| Situation | Likely cause | Next action |
|---|---|---|
| No band in lysate | HPGD may be below detection in the tested cytoplasmic lysate | Check loading and assay performance with an HPGD-positive whole-cell lysate |
| Band higher than expected | An HPGD homodimer may persist during electrophoresis | Compare reducing and more thoroughly denatured samples; confirm identity by HPGD knockdown |
| Band lower than expected | The empirical ~26 kDa band runs below the 29 kDa prediction for an unestablished reason | Compare with a validated ~26 kDa positive-control band and HPGD knockdown |
| Multiple bands | Five HPGD isoforms are listed, but their migration is unverified | Check which bands respond to HPGD knockdown or an independent antibody |
| Weak or no signal | HPGD abundance in the tested lysate may be low | Verify transfer and loading, then compare with an HPGD-positive lysate |

Comprehensive Human Protein Atlas IHC scoring per tissue. Rows are taken directly from the HPA tissue chart — click any row's HPA link to view the source.
| Tissue | Cell type | Level | Evidence | Source |
|---|---|---|---|---|
| Duodenum | paneth cells | High | Protein (IHC) | HPA → |
| Lung | endothelial cells | High | Protein (IHC) | HPA → |
| Skin | fibrohistiocytic cells | High | Protein (IHC) | HPA → |
| Small intestine | paneth cells | High | Protein (IHC) | HPA → |
| Stomach | glandular cells | High | Protein (IHC) | HPA → |
| Tissue | Cell type | Level | Evidence | Source |
|---|---|---|---|---|
| Adipose tissue | adipocytes | Not detected | Protein (IHC) | HPA → |
| Breast | adipocytes | Not detected | Protein (IHC) | HPA → |
| Caudate | glial cells | Not detected | Protein (IHC) | HPA → |
| Cerebellum | cells in granular layer | Not detected | Protein (IHC) | HPA → |
| Cerebral cortex | endothelial cells | Not detected | Protein (IHC) | HPA → |
Deeper troubleshooting and optimisation questions for HPGD, answered from its protein features.
Catalog antibodies with Western blot application and product-specific WB images. Evaluate suitability with the reported sample, controls and experimental conditions.
Both listed HPGD antibodies have WB images. A02686-3 shows human RT4 and A549 lysates, with a reported band near 26 kDa versus 29 kDa expected. M02686 shows SW480 lysate. The supplied evidence is limited to these examples.
Which to pick: For mouse or rat samples, A02686-3 lists reactivity, but its WB image uses human lysates. For human samples, both list reactivity and have WB images; A02686-3 provides detailed conditions, while M02686 has a brief SW480 caption.