IL6ST / Interleukin-6 receptor subunit beta · Western blot design guide

Design a Western Blot for IL6ST

Real validated IL6ST Western blot protocols, expected-band and isoform facts, troubleshooting for weak or shifted signal, and recommended anti-IL6ST WB antibodies. Everything you need to plan the experiment before you commit precious samples.

Evidence assembled September 2026 · For research use; verify linked source records and product datasheet before use
Western blot protocol sheet for IL6ST: expected band ~103.5 kDa, hero antibody A01216, catalog values and labelled standard workflow; separate PMC comparisons on the guide
Printable IL6ST Western blot protocol sheet — expected band ~103.5 kDa, antibody A01216, controls and PMC citations. Open the full IL6ST WB guide →

IL6ST Western Blot Experimental Design Guide

Expected bands, validated protocols, controls and antibodies — the at-a-glance facts below, then the full design guide.

Must know before running
Expected band ~103.5 kDa
Gel 8–10% (standard starting point)
Negative control ⓘ Suggested KO / knockdown lysate
Important caveats
Reasons your observed band may differ from the expected size.
PTM Glycosylated + Phosphorylated
Caveat Modification-state controls
Gene-set association MSigDB Hallmark membership
Isoform 3 isoform(s)
Section 1

Real Curated IL6ST Western Blot Protocols

The A01216 protocol combines labelled catalog values with standard starting conditions. Published comparisons retain their own sample, reagent and detection scope.

Recommended Western blot protocol parameters
Sample / lysate293T COLO cells (catalog A01216)
Gel %8–10% (standard starting point)
Load20–30 µg total protein per lane; optimize for abundance (standard starting point)
TransferWet/tank transfer; optimize duration (standard starting point)
Membrane0.45 µm PVDF (standard starting point)
Blocking5% milk or 5% BSA in TBST (standard starting point)
Primary antibodyA01216 · 1:500 (catalog A01216)
Primary incubationOvernight at 4 °C (standard starting point)
Secondary antibodySpecies-matched HRP conjugate at validated dilution (standard starting point)
Secondary incubation1 h at room temperature (standard starting point)
Wash3 × 5 min in TBST (standard starting point)
DetectionECL; bracket exposures to avoid saturation (standard starting point)
Section 2

What Is the Expected IL6ST Western Blot Band Size?

IL6ST has a predicted full-length mass of 103.5 kDa; glycosylation, signal peptide cleavage, and isoforms may affect migration, but no empirical band is supplied.

What am I looking at on my blot?
Band near 103.5 kDaconsistent with the predicted full-length IL6ST mass, pending identity controls
Band above 103.5 kDacould reflect N-linked glycosylation at annotated asparagine sites
Band slightly below precursor sizecould reflect cleavage of the residues 1–22 signal peptide
Multiple bands at different positionscould reflect isoforms 1, 2, and 3, whose migration differences are unreported
💡Expected IL6ST appearanceUniProt predicts a 103.5 kDa full-length IL6ST precursor, but no empirical band size is supplied; assess any candidate band with antibody specificity and appropriate identity controls.
How each factor affects band size
Predicted full-length massprovides a 103.5 kDa sequence-based reference, not a measured band position
N-linked glycosylation at Asn43, Asn83, Asn131, Asn157, Asn227, Asn379, Asn383, and complex Asn390could increase apparent mass; the size of any shift is unknown
Signal peptide at residues 1–22cleavage makes the mature chain smaller than the precursor
Isoforms 1, 2, and 3may differ in size, but their individual masses and migration are not supplied
Why is my band missing or off?
SituationLikely causeNext action
No band in lysatemembrane IL6ST may be poorly recovered during lysischeck membrane extraction and use an IL6ST-positive control
Band higher than expectedN-linked glycosylation could increase apparent masscompare with a deglycosylated sample and verify band identity
Band lower than expectedsignal peptide cleavage or an isoform could reduce sizecheck antibody epitope and confirm identity with an independent antibody
Broad smear instead of sharp bandvariable N-linked glycosylation is possiblecompare untreated and deglycosylated samples
Multiple bandsisoforms 1, 2, and 3 are annotated, but distinct bands are unverifiedcompare isoform-specific expression or independent antibody controls

Sample controls for IL6ST Western blot

🧪For positive controls for IL6ST in Western blot, you can use no HPA-supported sample from the supplied evidence because no positive candidates are listed.
Positive control: No high/medium HPA tissue identified
Negative control: Suggested KO / knockdown lysate
Loading controls: Run GAPDH, β-actin, and a total-protein stain such as Ponceau alongside the samples.
⚠️Feasibility: A positive control cannot be selected from the supplied HPA data; IL6ST isoform 1 is membrane-localized.

HPA tissue expression evidence for IL6ST

Comprehensive Human Protein Atlas IHC scoring per tissue. Rows are taken directly from the HPA tissue chart — click any row's HPA link to view the source.

Higher expression tissues · candidate positive controls from IHC

TissueCell typeLevelEvidenceSource
No high/medium HPA tissues identified in the supplied evidence.

Lower expression tissues · IHC evidence, not confirmed WB-negative controls

TissueCell typeLevelEvidenceSource
No lower-expression tissue rows available in the supplied evidence.
Section 3

Advanced IL6ST Western Blot Tips

Deeper troubleshooting and optimisation questions for IL6ST, answered from its protein features.

How should IL6ST band migration be interpreted?
Band shift · Use the separately labelled calculated mass and catalog-observed evidence above. A sequence annotation does not establish an observed migration shift. Verify target identity with orthogonal controls.
How could isoform 2 affect IL6ST band interpretation?
Isoforms · Isoform 2 replaces residues 325–329 (RPSKA) with NIASF and lacks residues 330–918, so it has a substantially shorter sequence than isoform 1. Check whether the antibody epitope remains within isoform 2 before assigning a band to it. Coordinates refer to the supplied UniProt canonical sequence.

Isoform 3 lacks canonical residues 423–483. An antibody targeting that interval would not detect it; an antibody targeting a retained region could. The deletion motivates checking for a different band, but the features do not specify its apparent mass.

Identify the antibody epitope and quantify consistently defined bands across samples. Isoform 2 lacks residues 330–918, and isoform 3 lacks 423–483, so an antibody may detect the isoforms differently. Avoid treating a change in one detected band as a change in total IL6ST without establishing which isoforms contribute.
Could IL6ST glycosylation produce multiple bands?
PTM · UniProt lists N-linked sites at Asn 43, 83, 131, 157, 227, 379, 383, 390, 553, and 564; Asn 390 is annotated as complex. Glycosylation could affect migration, but site annotations alone do not prove that any particular band difference reflects glycosylation. These are UniProt canonical coordinates.

UniProt annotates phosphoserines at canonical residues 661, 667, 782, 789, 829, and 839. Isoform 2 lacks all six positions because residues 330–918 are missing. If comparing phospho-sensitive bands, first establish which isoform the antibody detects; the annotations alone do not predict a visible shift.
Does this guide establish induction of IL6ST?
Induction · No general induction response is established by this guide. A pathway or gene-set association is not evidence of induction in a particular specimen. Verify the relevant treatment and control in a target-specific experiment.
How should transfer be checked for IL6ST?
Transfer · Standard workflow guidance: verify transfer efficiency for the intended target size before interpreting a weak signal. Use total-protein assessment and optimize transfer for the membrane, gel and apparatus; the labelled catalog values take precedence.
How should blocking be optimized?
Blocking · Standard workflow guidance: follow the A01216 datasheet where specified. Otherwise compare 5% milk or 5% BSA in TBST; for a phospho-specific assay start with BSA. Optimize background and specific signal with matched controls.
How should IL6ST be quantified?
Quantitation · Standard workflow guidance: quantify only a validated target band within the linear exposure range. Use consistent sample preparation and loading, retain biological replicates, and avoid interpreting saturation or loading differences as regulation.
Why might IL6ST migrate differently from its predicted 103.5 kDa mass?
Interpretation · The 103.5 kDa prediction does not establish where IL6ST runs on a blot. UniProt lists a signal peptide at residues 1–22 and ten N-linked glycosylation sites, which may affect the processed protein and its migration. No observed band size is supplied, so these features cannot establish a specific shift.

Check the antibody epitope against the three isoforms first: isoform 2 lacks 330–918, while isoform 3 lacks 423–483. Then consider the annotated signal peptide and ten N-linked sites when evaluating migration. UniProt also lists five disulfide bonds. None of these features, by itself, identifies an unexpected band.
Boster reagents

IL6ST Western Blot Antibodies

Catalog antibodies with Western blot application and product-specific WB images. Evaluate suitability with the reported sample, controls and experimental conditions.

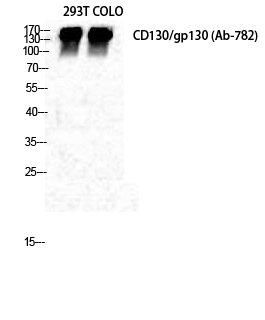
Real WB data Western Blot analysis of 293T COLO cells using CD130 Polyclonal Antibody diluted at 1:500
Anti-CD130 IL6ST Antibody
Cat # A01216

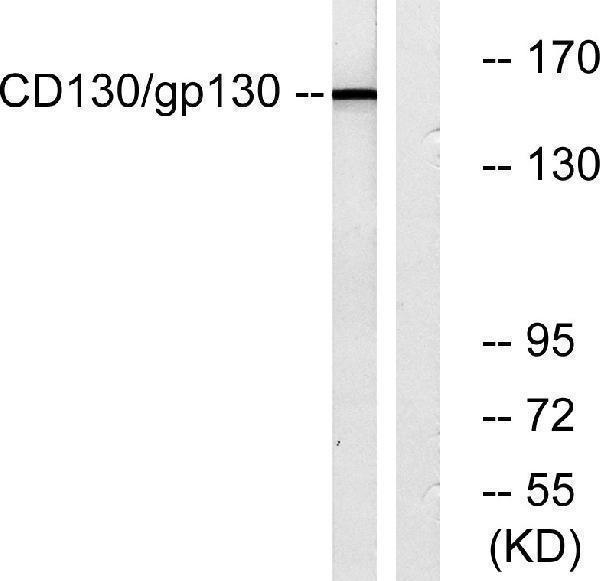
The catalog reports A01216, an anti-IL6ST antibody for Western blot with stated Human and Mouse reactivity. Its WB image caption reports 293T and COLO cells at a 1:500 dilution; the supplied evidence does not show a mouse sample.

Which to pick: A01216 is the only listed option. It has a WB image for 293T and COLO cells at 1:500. Human and Mouse reactivity is listed, but the supplied caption provides no mouse WB example.

Source: BosterBio IL6ST gene-info card — filtered to Western-blot-capable antibodies; each card shows that product's actual WB validation figure.