This website uses cookies to ensure you get the best experience on our website.


- Table of Contents
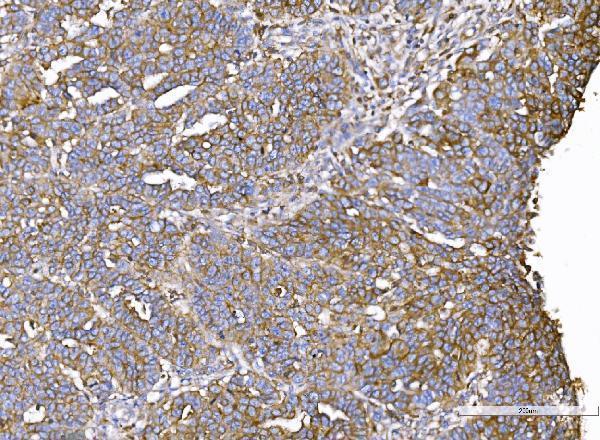
Plan chromogenic IQGAP1 IHC in paraffin sections with the catalog antibody (datasheet A01603). Compare cytoplasmic and membranous staining across cell types, using strongly stained colon glandular cells and undetected adipocytes as reference populations (HPA tissue IHC).

Expected localisation, validated protocols, controls and antibodies — the at-a-glance facts below, then the full design guide.
| Expected localisation | Cytoplasmic and membranous tissue staining (HPA tissue IHC) | |
| Staining pattern | Most cell types show cytoplasmic and membranous signal (HPA tissue IHC) | |
| Antigen retrieval | Citrate pH 6 HIER, heat-mediated (datasheet A01603) | |
| Positive control | Colon+4 more · see all | |
| Negative control | Adipose tissue+4 more · see all |
| Fixation | Keep fixation conditions consistent across sections. (standard IHC practice; not target-specific) | |
| Caveat | Macrophages can contribute strong lung staining (HPA tissue IHC) | |
| Regulation | Nuclear levels rise at G1/S (UniProt) | |
| Isoform / epitope | 0 annotated isoforms; chain spans residues 2–1657 (UniProt) |
The catalog antibody’s IHC-P protocol is followed by four published IQGAP1 chromogenic IHC protocols covering melanoma, colorectal carcinoma, hepatocellular carcinoma, and lung cancer (PMC5406000; PMC5588162; PMC9628040; PMC4249885).
| Sample | Paraffin-embedded human intestinal cancer tissue; fixative not specified (datasheet A01603) |
| Fixation | Image fixative and duration unreported (datasheet A01603); verify before use. |
| Sectioning | 4–5 µm sections on charged slides (standard) |
| Deparaffinisation | Xylene, graded ethanol series to water (standard) |
| Antigen retrieval | Heat retrieval: Citrate pH 6, 20 min (datasheet A01603) |
| Peroxidase block | 3% H2O2, 10 min, room temperature (standard) |
| Blocking | 10% goat serum (datasheet A01603) |
| Primary antibody | Rabbit anti-IQGAP1, 0.5-1μg/ml (datasheet A01603) |
| Primary incubation | Overnight at 4 °C (datasheet A01603) |
| Detection | Streptavidin-biotin complex (SABC), DAB chromogen (datasheet A01603) |
| Counterstain | Hematoxylin, blue, dehydrate and mount (standard) |
| Expected result | IQGAP1-positive staining in glandular cells of colon (HPA tissue IHC: High). HPA tissue profile: Cytoplasmic and membranous expression in most cell types. No signal in the no-primary control. |
In paraffin sections, expect cytoplasmic and membrane-associated IQGAP1 staining in many cell types, with high staining in selected populations such as colon glandular cells and lung macrophages (HPA tissue IHC: Enhanced; HPA: High in colon glandular cells and lung macrophages). IQGAP1 also localizes to the cell cortex and can enter the nucleus; it has no transmembrane segment (UniProt P46940: subcellular location and topology).
| Brown cytoplasmic and membrane-associated staining in colon glandular cells or lung macrophages. | This fits the reported IHC pattern and provides a useful positive reference; compare the identified cells, rather than judging the entire section by one average intensity (HPA tissue IHC: cytoplasmic and membranous expression; HPA: High in these cells). |
| Signal is mainly in luminal material or extracellular spaces, with little staining in cells. | That distribution does not match the reported cellular pattern; inspect morphology and reagent controls before scoring it as IQGAP1 (HPA tissue IHC: cytoplasmic and membranous expression). Nuclear staining alone needs context because nuclear IQGAP1 is reported (UniProt P46940: nucleus). |
| Strong staining appears in adipocytes or skeletal myocytes. | These cells are reported as not detected; check for cross-reactivity or endogenous detection activity before accepting the signal (HPA tissue IHC: adipocytes and skeletal myocytes, Not detected). Their status does not make every cell in those tissues a negative control. |
| A similar brown haze covers cells, stroma and areas without tissue. | This is more consistent with background than a cell-localized result. Review the reagent-only control, blocking, washing and chromogen development as general chromogenic IHC checks; the expected IQGAP1 pattern is cellular (HPA tissue IHC: cytoplasmic and membranous expression). |
| Colon glandular cells or lung macrophages show little or no signal. | A negative result in these reported high-staining cells warrants a run-level check before biological interpretation (HPA tissue IHC: High in colon glandular cells and lung macrophages). Confirm cell identity, positive-control performance and that the IHC-validated antibody was used. |
| Cellular location | IQGAP1 is reported at the cortex, apical and basolateral membranes, cytoplasm and nucleus, despite having no transmembrane segment (UniProt P46940: subcellular location and topology). A membrane-associated outline can therefore be plausible without implying that the protein spans the membrane. |
| Cell cycle | Nuclear levels increase at G1/S (UniProt P46940: subcellular distribution). Evaluate nuclear signal alongside cell identity and the broader cytoplasmic or membrane pattern; nuclear staining by itself is not sufficient grounds to call the section an artefact. |
| Choice of comparison cells | Colon glandular cells, kidney glomerular cells, lung macrophages and placental trophoblastic cells are reported as High; adipocytes and skeletal myocytes are Not detected (HPA tissue IHC). Score the named cells, since each designation applies to a cell population. |
| Evidence for the tissue pattern | The tissue IHC profile is rated Enhanced for consistency between staining and RNA data; HPA014055 and CAB013302 each have Enhanced IHC validation (HPA tissue IHC: reliability; HPA antibodies: IHC). Use this as support for the reported pattern, not as proof of specificity in every section. |
| Chromogenic detection | Endogenous enzyme activity can imitate antibody-dependent color in chromogenic IHC (general IHC practice). Where relevant to the detection system, evaluate an appropriate reagent control and enzyme block; HPA cell-level observations alone cannot identify the source of an unexpected deposit. |
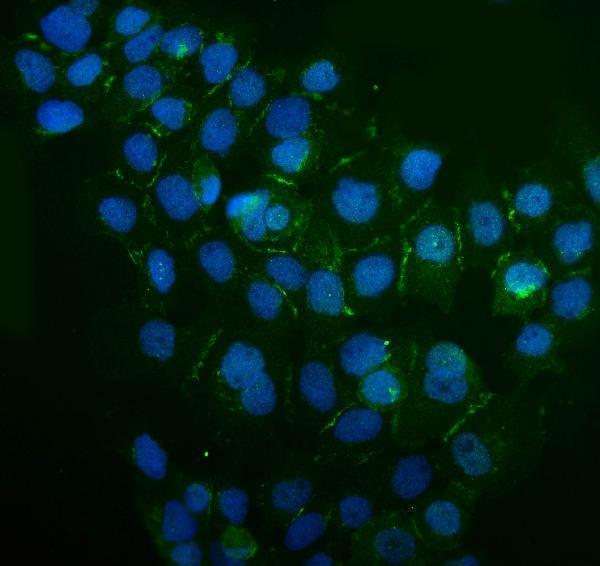
| Q: Can ICC-IF resolve an IHC staining call? | A: ICC-IF supports plasma-membrane and cell-junction localization, and CAB013302 has Supported ICC validation (HPA subcellular; HPA antibodies: ICC). This is useful localization context; decide paraffin-section staining against the tissue IHC pattern (HPA tissue IHC). |
| Situation | Likely cause | Next action |
|---|---|---|
| No signal in a positive reference section. | A failed staining run or unsuitable assay settings are possible; the selected cells are reported as High (HPA tissue IHC: colon glandular cells; lung macrophages). | Confirm the named cells are present and the IHC-validated antibody and detection reagents were used; review retrieval, reagent preparation and positive-control performance as general IHC practice. |
| Brown deposit sits mainly outside cells. | The distribution conflicts with the reported cytoplasmic and membranous cellular pattern (HPA tissue IHC: profile). | Inspect the counterstain and tissue boundaries, then compare reagent controls and chromogen development. Score only convincing cell-associated signal (general IHC practice; HPA tissue IHC: profile). |
| Adipocytes or skeletal myocytes stain strongly. | Cross-reactivity or endogenous detection activity is possible because these named cells are reported as Not detected (HPA tissue IHC). | Check a reagent-only control and the relevant endogenous-enzyme block; compare another reported cell population before assigning target-specific staining (general IHC practice; HPA tissue IHC: cell-level pattern). |
| Most of the slide has a uniform brown haze. | Nonspecific reagent binding, inadequate washing or excess chromogen development can produce background (general IHC practice). | Review blocking, washing and development time against the run controls; require a recognizable cytoplasmic or membrane-associated cell pattern for interpretation (general IHC practice; HPA tissue IHC: profile). |
| Some cells in a positive tissue stain while neighbors do not. | The HPA levels describe specific populations, such as kidney glomerular cells and lung macrophages, rather than every cell in a tissue (HPA tissue IHC). | Identify and score the reported population separately. Compare intensity only after matching cell type and section morphology (HPA tissue IHC: cell-level observations; general IHC practice). |
| Nuclear color is present with weak membrane staining. | Nuclear IQGAP1 is plausible, and its level can rise at G1/S; that fact alone does not establish that this particular nuclear signal is specific (UniProt P46940: subcellular distribution). | Check whether color follows intact nuclei, review reagent controls and look for a credible cellular pattern in reported positive cells before scoring (general IHC practice; HPA tissue IHC: positive cells). |
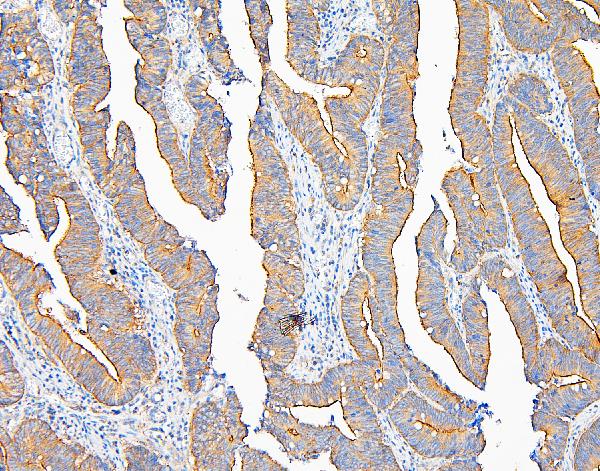
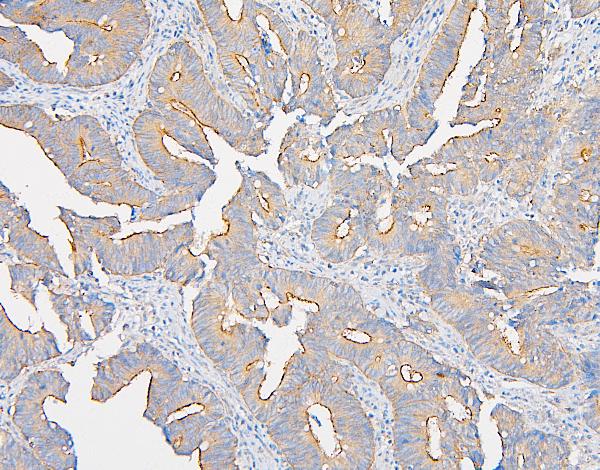
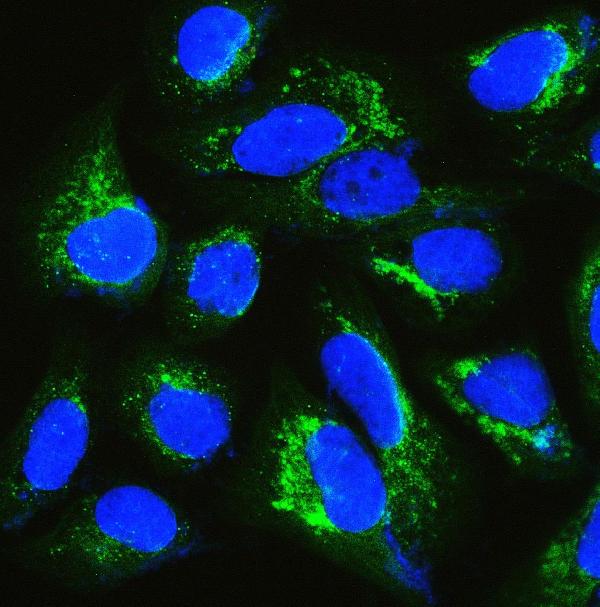
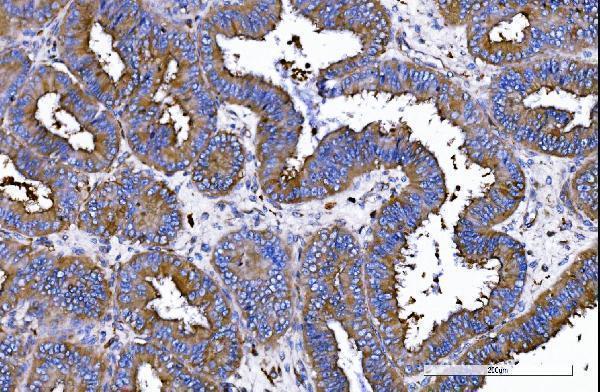


Comprehensive Human Protein Atlas IHC scoring per tissue (reliability: Enhanced — High consistency between antibody staining and RNA expression data.). Rows are taken directly from the HPA tissue chart — click any row's HPA link to view the source.
| Tissue | Cell type | Level | Evidence | Source |
|---|---|---|---|---|
| Colon | Glandular cells | High | Protein (IHC) | HPA → |
| Endometrium | Glandular cells | High | Protein (IHC) | HPA → |
| Kidney | Cells in glomeruli | High | Protein (IHC) | HPA → |
| Lung | Macrophages | High | Protein (IHC) | HPA → |
| Lymph node | Non-germinal center cells | High | Protein (IHC) | HPA → |
| Tissue | Cell type | Level | Evidence | Source |
|---|---|---|---|---|
| Adipose tissue | Adipocytes | Not detected | Protein (IHC) | HPA → |
| Caudate | Glial cells | Not detected | Protein (IHC) | HPA → |
| Cerebellum | Cells in granular layer | Not detected | Protein (IHC) | HPA → |
| Hippocampus | Glial cells | Not detected | Protein (IHC) | HPA → |
| Skeletal muscle | Myocytes | Not detected | Protein (IHC) | HPA → |
Troubleshoot IQGAP1 staining by checking retrieval, tissue preservation, compartment patterns, controls, and cell-specific scoring before interpreting signal.
Two anti-IQGAP1 antibodies have paraffin-section IHC images from human cancers and IF/ICC images from cells (catalog image captions); catalog reactivity covers human, mouse and rat (catalog: A01603, A01603-1).
A01603 will render with human intestinal cancer IHC and U20S cell IF/ICC images; its listed reactivity is human, mouse and rat (catalog: A01603 image captions and reactivity). A01603-1 will render with human endometrial adenocarcinoma IHC and A431 cell IF/ICC images; its listed reactivity is human (catalog: A01603-1 image captions and reactivity).
Which to pick: For paraffin-section IHC, start with A01603 at 0.5–1 μg/ml with citrate retrieval at pH 6, or A01603-1 at 2–5 μg/ml with EDTA retrieval at pH 8; each retrieval method comes from that SKU’s own IHC image caption (catalog: A01603 and A01603-1 IHC captions and dilutions). For IF/ICC, both list the application and have cell images: A01603 at 2 μg/ml or A01603-1 at 5 μg/ml (catalog: IF/ICC applications, IF image captions and dilutions). Choose A01603 when mouse or rat reactivity is needed, while treating that as listed reactivity rather than tissue IHC image evidence; clone type is unreported for both antibodies, and neither IHC caption reports the tissue fixative (catalog: reactivity, clone fields and IHC captions).