This website uses cookies to ensure you get the best experience on our website.


- Table of Contents
Plan IST1 paraffin IHC using the cytoplasmic and nuclear tissue pattern, with colon glandular cells as a high-staining reference (HPA tissue IHC). The guide covers fixation, staining controls and interpretation for the IHC-validated antibody A05507-2 (datasheet A05507-2).

Expected localisation, validated protocols, controls and antibodies — the at-a-glance facts below, then the full design guide.
| Expected localisation | Cytoplasmic and nuclear staining in most tissues (HPA tissue IHC) | |
| Staining pattern | Most tissues show cytoplasmic and nuclear staining (HPA tissue IHC) | |
| Antigen retrieval | EDTA pH 8.0 HIER, heat-mediated (datasheet A05507-2) | |
| Positive control | Adipose tissue+4 more · see all | |
| Negative control | None in HPA (detected in all 43 tissues); use no-primary + isotype controls |
| Fixation | Keep fixation conditions consistent across sections. (standard IHC practice; not target-specific) | |
| Caveat | Staining and RNA levels have medium consistency (HPA tissue IHC) | |
| Regulation | RNA has low tissue specificity (HPA tissue RNA) | |
| Isoform / epitope | 6 isoforms; antibody epitope coverage is unclear (UniProt; datasheet A05507-2) |
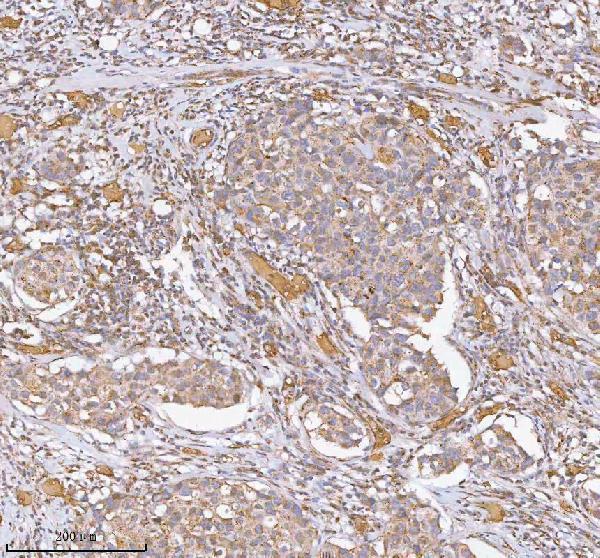
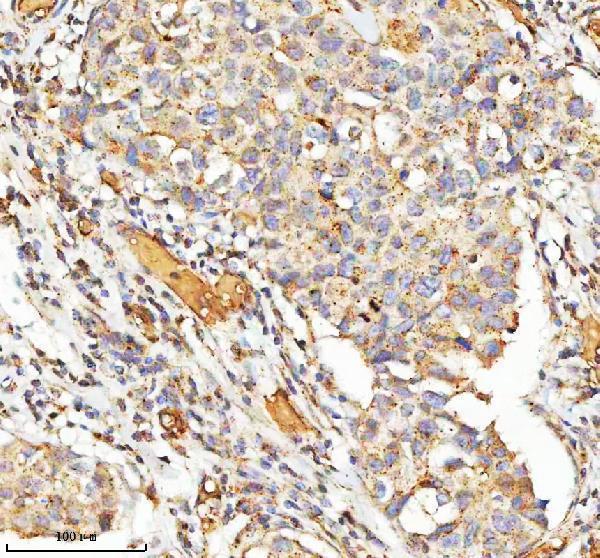
The catalog antibody’s IHC-P protocol (datasheet: A05507-2) is paired with a published IST1 stain of paraffin-embedded tissue (PMC10200693).
| Sample | Paraffin-embedded human breast cancer tissue; fixative not specified (datasheet A05507-2) |
| Fixation | Image fixative and duration unreported (datasheet A05507-2); verify before use. |
| Sectioning | 4–5 µm sections on charged slides (standard) |
| Deparaffinisation | Xylene, graded ethanol series to water (standard) |
| Antigen retrieval | Heat retrieval: EDTA pH 8.0 (datasheet A05507-2); 20 min, 95–100 °C (standard) |
| Peroxidase block | 3% H2O2, 10 min, room temperature (standard) |
| Blocking | 10% goat serum (datasheet A05507-2) |
| Primary antibody | Rabbit anti-IST1, 2-5 μg/ml (datasheet A05507-2) |
| Primary incubation | Overnight at 4 °C (datasheet A05507-2) |
| Detection | HRP-conjugated secondary, DAB chromogen (datasheet A05507-2) |
| Counterstain | Hematoxylin, blue, dehydrate and mount (standard) |
| Expected result | IST1-positive staining in adipocytes of adipose tissue (HPA tissue IHC: High). HPA tissue profile: Cytoplasmic and nuclear expression in most tissues. No signal in the no-primary control. |
IST1 should show cytoplasmic and nuclear staining in many tissues, including strong staining in several epithelial, adipocyte and hematopoietic populations (HPA tissue IHC: High; profile: cytoplasmic and nuclear). Vesicular signal is consistent with its reported localization; dividing cells may also show centrosomal, midbody or reforming nuclear envelope signal (UniProt P53990: subcellular location). IST1 has no transmembrane segment (UniProt P53990: topology). HPA rates the tissue IHC pattern Approved, with medium consistency against RNA expression (HPA tissue IHC: reliability).
| Cytoplasmic staining, with some nuclear staining, in colon or appendix glandular cells. | This fits the reported broad tissue pattern and the High staining recorded for these cells (HPA tissue IHC: profile; High in colon and appendix glandular cells). Judge the intended cells against neighboring tissue and the same staining run; a positive result need not have identical intensity in every cell (general IHC interpretation). |
| A small, discrete signal appears near the division plane of a dividing cell. | A midbody-associated pattern is biologically plausible because IST1 localizes to the midbody and helps recruit VPS4 proteins during cytokinesis (UniProt P53990: location and function). In a paraffin section, a single dot is insufficient proof of a midbody; confirm cell morphology and reproducibility before assigning that structure (general IHC interpretation). |
| The dominant signal outlines the plasma membrane or fills extracellular spaces. | That distribution conflicts with the reported cytoplasmic and nuclear tissue pattern and the absence of a transmembrane segment (HPA tissue IHC: profile; UniProt P53990: topology). Review morphology and controls for deposited chromogen or nonspecific staining before interpreting the outline as IST1 (general IHC interpretation). |
| An unexpected cell population stains while the expected cells do not. | Consider antibody cross-reactivity or endogenous detection activity, then inspect the positive control and control lacking primary antibody (general IHC troubleshooting). Cell identity alone is not proof of a false positive: HPA reports expression in most tissues and low RNA tissue specificity (HPA tissue IHC: profile and RNA specificity). |
| Staining is diffuse across cells, stroma and the slide, or absent in an expected positive tissue. | Diffuse signal obscures the reported cellular pattern; absent signal in an expected High population prevents a reliable negative call (HPA tissue IHC: profile; High in specified cells). Compare controls, section quality and the detection run before attributing either result to IST1 biology (general IHC interpretation). |
| Choice of reference tissue and cell population | HPA reports High staining in adipocytes, several glandular or respiratory epithelial populations, and bone marrow hematopoietic cells, but Low staining in cardiomyocytes (HPA tissue IHC: listed cells). Compare the relevant cell population, rather than treating an entire section as uniformly positive or negative (general IHC interpretation). |
| Cell state and compartment | IST1 is reported at cytoplasmic vesicles and, in dividing cells, at the centrosome, midbody and reforming nuclear envelope (UniProt P53990: subcellular location). Those structures need suitable cell morphology and resolution for assignment; routine chromogenic IHC may show a broader cytoplasmic or nuclear pattern (HPA tissue IHC: profile; general IHC interpretation). |
| Antibody evidence | Two listed antibodies have Approved IHC status, while the tissue pattern has medium consistency with RNA data (HPA antibodies: IHC Approved; HPA tissue IHC: reliability). Use the observed pattern as a reference with that limitation; the supplied record does not establish an Enhanced IHC validation claim (HPA antibodies: listed status). |
| Isoforms and epitope coverage | Six isoforms are listed, but the supplied record gives no antibody epitope or isoform coverage (UniProt P53990: isoforms; supplied antibody record). Do not infer which isoforms a stained or unstained cell contains from this IHC result alone (general IHC interpretation). |
| Processing and fixation evidence | The listed IST1 chain spans residues 1–364, with no signal peptide, propeptide or glycosylation site reported (UniProt P53990: processing and glycosylation). These facts do not establish how fixation or antigen retrieval affects staining; target-specific fixation sensitivity is unreported in the supplied sources. |
| Situation | Likely cause | Next action |
|---|---|---|
| No signal in colon or appendix glandular cells expected to stain strongly. | A failed staining run is possible; these are High populations in the HPA tissue record (HPA tissue IHC: High in colon and appendix glandular cells). | Check tissue identity, section integrity, primary antibody application and detection controls, then review retrieval conditions using the antibody's validated IHC instructions (general IHC practice). Do not call the tissue IST1-negative until the run controls work. |
| Signal is weak but present in the reference cell population. | Low signal may reflect the staining workflow; apparent strength also depends on which cells are being compared (general IHC practice). Cardiomyocytes are listed as Low, so they are a poor strong-signal reference (HPA tissue IHC: Low in cardiomyocytes). | Compare like cell populations within the same run and use an HPA High population as a positive reference (HPA tissue IHC: listed levels). Review antibody dilution, retrieval and detection settings against the applicable IHC instructions (general IHC practice). |
| Brown staining spreads through stroma or appears at section edges. | Background deposition or nonspecific binding can obscure cellular staining (general chromogenic IHC practice). It does not match HPA's cytoplasmic and nuclear tissue profile (HPA tissue IHC: profile). | Inspect a control lacking primary antibody, wash and blocking steps, and whether the signal follows intact cell boundaries (general IHC practice). Score IST1 only where a reproducible cellular pattern remains interpretable. |
| The strongest signal forms a continuous cell-surface rim. | A dominant membrane outline is discordant with the reported pattern and with IST1's lack of a transmembrane segment (HPA tissue IHC: profile; UniProt P53990: topology). | Check the control lacking primary antibody and repeat with the validated IHC conditions if needed (general IHC practice). Do not reinterpret a membrane rim as the expected vesicular pattern without supporting cellular morphology (HPA subcellular ICC-IF: vesicles supported). |
| Bone marrow cells appear positive even in a control lacking primary antibody. | Endogenous detection activity can produce chromogenic signal independently of the primary antibody (general chromogenic IHC practice). Bone marrow hematopoietic cells are also listed as High, so the control matters here (HPA tissue IHC: High in bone marrow hematopoietic cells). | Review the detection system's endogenous-activity blocking step and compare control and test sections under the same conditions (general IHC practice). Interpret residual cellular staining only after control-derived signal is accounted for. |
| IF/ICC: Should vesicular puncta count as IST1 localization? | HPA reports vesicles as a supported main ICC-IF location; the IHC tissue profile is broader, with cytoplasmic and nuclear expression (HPA subcellular ICC-IF: vesicles supported; HPA tissue IHC: profile). | Use the separate IF/ICC guide for that application. Here, treat puncta as compatible with the supported localization when controls and cell morphology support them; do not transfer an IF pattern or workflow directly into a chromogenic paraffin-section interpretation (general IHC/IF practice). |
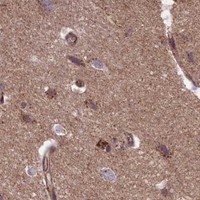


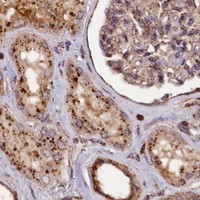


Comprehensive Human Protein Atlas IHC scoring per tissue (reliability: Approved — Medium consistency between antibody staining and RNA expression data.). Rows are taken directly from the HPA tissue chart — click any row's HPA link to view the source.
| Tissue | Cell type | Level | Evidence | Source |
|---|---|---|---|---|
| Adipose tissue | Adipocytes | High | Protein (IHC) | HPA → |
| Appendix | Glandular cells | High | Protein (IHC) | HPA → |
| Bone marrow | Hematopoietic cells | High | Protein (IHC) | HPA → |
| Breast | Adipocytes | High | Protein (IHC) | HPA → |
| Bronchus | Respiratory epithelial cells | High | Protein (IHC) | HPA → |
| Tissue | Cell type | Level | Evidence | Source |
|---|---|---|---|---|
| None in HPA: IST1 is detected in all 43 scored tissues. Use a no-primary (secondary-only) and an isotype control instead. | ||||
Troubleshoot IST1 staining in paraffin sections by checking retrieval, cell compartment, controls, and scoring before interpreting a chromogenic signal.
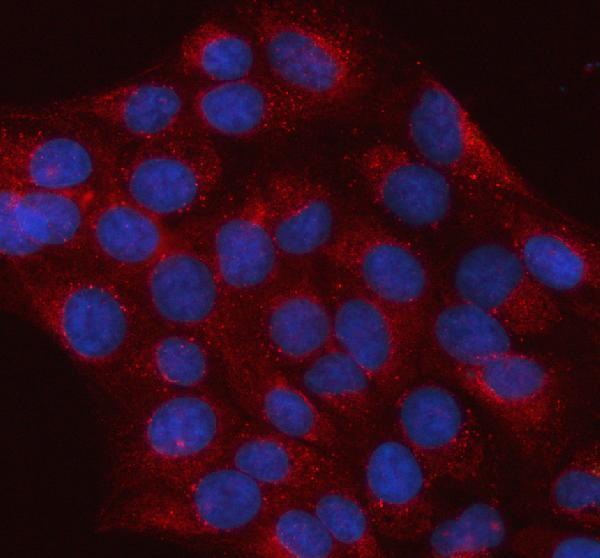
A05507-2 has human paraffin-section IHC images and a U2OS cell IF image (catalog image captions). Listed reactivity covers human, mouse, and rat (catalog reactivity).
A05507-2 is shown in paraffin sections of human breast cancer and colon adenocarcinoma (catalog IHC image captions). The same SKU is shown in U2OS cells by IF and is listed for IHC, ICC, and IF (catalog IF image caption; catalog applications).
Which to pick: Choose A05507-2 for human paraffin-section IHC: its own captions show staining at 2 μg/ml after EDTA retrieval at pH 8.0; the fixative is unreported (catalog IHC image captions). For IF/ICC, the same SKU has a U2OS cell IF image at 5 μg/ml (catalog IF image caption). For mouse or rat samples, this SKU lists reactivity with both species, but its supplied IHC and IF images show human samples only; clonality is unreported (catalog reactivity; catalog image captions; catalog clone field).