This website uses cookies to ensure you get the best experience on our website.


- Table of Contents
This guide covers KTN1 paraffin-section IHC using the catalog antibody's 2–5 μg/ml range (datasheet A05071-1). Plan controls around its cytoplasmic tissue staining (HPA tissue IHC) and interpret that pattern alongside its ER membrane location (UniProt).

Expected localisation, validated protocols, controls and antibodies — the at-a-glance facts below, then the full design guide.
| Expected localisation | Cytoplasmic tissue staining (HPA tissue IHC) | |
| Staining pattern | Cytoplasmic staining across diverse cell types (HPA tissue IHC) | |
| Antigen retrieval | EDTA pH 8.0 HIER, heat-mediated (datasheet A05071-1) | |
| Positive control | Adrenal gland+4 more · see all | |
| Negative control | None in HPA (detected in all 45 tissues); use no-primary + isotype controls |
| Fixation | Keep paraffin-section fixation consistent (standard IHC practice; not target-specific); Matched tissue-IHC evidence does not establish the fixation claim. Validate the specimen-specific method before use. (selected-SKU IHC image A05071-1) | |
| Caveat | Staining has medium consistency with RNA expression (HPA tissue IHC) | |
| Regulation | Integrin aggregation enriches adhesion complexes (UniProt) | |
| Isoform / epitope | 4 isoforms; map epitopes to cytoplasmic or ER-luminal regions (UniProt) |
The catalog antibody’s IHC-P protocol uses EDTA pH 8.0 retrieval (datasheet: A05071-1). One published KTN1 IHC protocol provides a breast tissue microarray alternative (PMC9253731).
| Sample | Paraffin-embedded human spleen tissue; fixative not specified (datasheet A05071-1) |
| Fixation | Image fixative and duration unreported (datasheet A05071-1); verify before use. |
| Sectioning | 4–5 µm sections on charged slides (standard) |
| Deparaffinisation | Xylene, graded ethanol series to water (standard) |
| Antigen retrieval | Heat retrieval: EDTA pH 8.0 (datasheet A05071-1); 20 min, 95–100 °C (standard) |
| Peroxidase block | 3% H2O2, 10 min, room temperature (standard) |
| Blocking | 10% goat serum (datasheet A05071-1) |
| Primary antibody | Rabbit anti-KTN1, 2-5 μg/ml (datasheet A05071-1) |
| Primary incubation | Overnight at 4 °C (datasheet A05071-1) |
| Detection | Streptavidin-biotin complex (SABC), DAB chromogen (datasheet A05071-1) |
| Counterstain | Hematoxylin, blue, dehydrate and mount (standard) |
| Expected result | KTN1-positive staining in glandular cells of adrenal gland (HPA tissue IHC: High). HPA tissue profile: Ubiquitous cytoplasmic expression. No signal in the no-primary control. |
KTN1 should stain the cytoplasm of many cell types, consistent with its endoplasmic reticulum membrane location and single transmembrane segment at residues 7–29 (UniProt Q86UP2). HPA reports ubiquitous cytoplasmic tissue staining, with high signal in several glandular, epithelial and hematopoietic cell populations; its IHC reliability is Enhanced, although antibody staining and RNA expression have only medium consistency (HPA tissue IHC).
| Cytoplasmic chromogen in glandular cells of adrenal gland, appendix or breast, or in bronchial epithelium. | This fits HPA's High staining in those cells and its ubiquitous cytoplasmic profile (HPA tissue IHC). In paraffin sections, an ER-associated pattern may appear broadly cytoplasmic; a fine reticular pattern need not be resolved to support the call (UniProt Q86UP2; HPA subcellular ICC-IF). |
| Predominantly nuclear, extracellular or sharply membrane-only staining, with little cytoplasmic signal. | That distribution conflicts with the reported cytoplasmic IHC profile and ER location (HPA tissue IHC; HPA subcellular ICC-IF). Treat it as suspect until controls and tissue morphology support a specific interpretation; the provided sources do not establish those compartments as expected KTN1 staining. |
| Strong staining in an unexpected cell population while adjacent expected cells remain weak. | Compare the cells with HPA's named populations before assigning a positive result: hematopoietic cells in bone marrow and glial cells in caudate are reported High, while heart cardiomyocytes are reported Low (HPA tissue IHC). An unexplained mismatch may reflect antibody cross-reactivity or endogenous detection activity (general IHC practice). |
| Chromogen spreads evenly across cells, stroma and section edges, obscuring cell boundaries. | This is background rather than a readable cytoplasmic distribution (general IHC interpretation). Review the no-primary control and staining workflow; HPA's ubiquitous cytoplasmic profile does not mean every section component should have uniform signal (HPA tissue IHC). |
| No cytoplasmic signal in a section expected to show high staining. | A blank result in adrenal glandular cells, bronchial respiratory epithelial cells or bone marrow hematopoietic cells conflicts with HPA's High observations (HPA tissue IHC). Check tissue identity, assay controls and reagent performance before concluding that KTN1 is absent; no target-specific fixation sensitivity is reported here. |
| Cell and tissue choice | HPA reports High staining in adrenal, appendix and breast glandular cells, bronchial respiratory epithelium and bone marrow hematopoietic cells, but Low staining in heart cardiomyocytes (HPA tissue IHC). Use those observations to choose comparison sections; low is not an established negative. |
| Subcellular context | KTN1 is anchored to the ER by one transmembrane segment, with residues 30–1357 annotated as lumenal (UniProt Q86UP2 topology). HPA calls the ICC-IF location ER and the tissue IHC profile cytoplasmic (HPA subcellular ICC-IF; HPA tissue IHC). Interpret compartment at the resolution of the assay. |
| Antibody validation | HPA rates tissue IHC reliability Enhanced and describes medium agreement between antibody staining and RNA expression (HPA tissue IHC). Two listed antibodies have Enhanced IHC status; a third is Supported (HPA antibodies). These ratings support comparison with the reference pattern, not an assumption that every stained cell is specific. |
| Isoforms and epitope coverage | UniProt lists 4 KTN1 isoforms (UniProt Q86UP2). The supplied record gives no antibody epitope or isoform coverage, so differences between reagents cannot be assigned to a particular isoform. Check the catalog antibody's stated target region before interpreting discordant staining. |
| Post-translational features | UniProt annotates 8 glycosylation sites and several modified residues (UniProt Q86UP2). Their effect on this assay is unreported; they do not justify predicting tissue-specific staining, retrieval needs or fixation sensitivity from the supplied evidence. |
| IF/ICC: what pattern is expected? | Expect ER-associated signal: HPA reports an enhanced ER location and lists ICC-IF images from A-431, U-251MG and U2OS (HPA subcellular ICC-IF). This provides a compartment check for IF/ICC, while the primary interpretation here concerns chromogenic IHC in paraffin sections. |
| Situation | Likely cause | Next action |
|---|---|---|
| Known high-staining cells are blank. | The result conflicts with HPA's High observations in several named cell populations; tissue identification or assay performance may be at issue (HPA tissue IHC; general IHC practice). | Confirm the expected cells are present, then review the catalog antibody's IHC-P instructions, detection reagents and positive control together. Avoid calling biological absence from a failed control (general IHC practice). |
| Signal is mostly nuclear or extracellular. | Those compartments do not match HPA's cytoplasmic IHC profile or ER location (HPA tissue IHC; HPA subcellular ICC-IF). | Compare a known high-staining section and a no-primary control, and inspect whether color follows intact cell cytoplasm rather than nuclei or section debris (general IHC practice). |
| Heart cardiomyocytes appear as strong as a high-staining comparator. | HPA records cardiomyocytes as Low, whereas several glandular and hematopoietic populations are High (HPA tissue IHC). Staining strength may reflect background or assay settings; the record alone cannot identify the cause. | Compare sections processed together, confirm cell identity and review the no-primary control. Treat the HPA Low observation as a comparator, not proof of complete absence (HPA tissue IHC; general IHC practice). |
| Every structure has similar diffuse color. | Uniform color can obscure the cell-specific cytoplasmic pattern reported by HPA (HPA tissue IHC); nonspecific detection or inadequate washing are general IHC possibilities. | Inspect the no-primary control, blocking and wash steps, then reassess whether cytoplasmic signal remains distinguishable from background (general IHC practice). |
| Unexpected cell types stain strongly. | HPA reports staining across many tissues, so an unfamiliar positive is not automatically erroneous (HPA tissue IHC). Cross-reactivity or endogenous detection activity remains possible when expected cells and controls disagree (general IHC practice). | Identify the stained cells, compare them with HPA's cell-level observations, and use a no-primary control to assess detection-derived color before assigning KTN1 positivity (HPA tissue IHC; general IHC practice). |
| Antibodies give different cytoplasmic patterns. | HPA lists different IHC validation levels, while the supplied record does not identify antibody epitopes or isoform coverage (HPA antibodies; UniProt Q86UP2). | Compare each antibody's catalog target information and IHC controls, then retain the interpretation that best matches HPA's cytoplasmic tissue pattern. Do not attribute the difference to an isoform without epitope evidence (HPA tissue IHC; UniProt Q86UP2). |

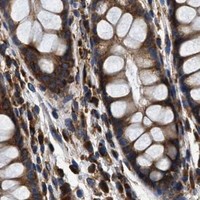
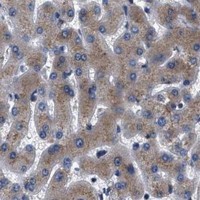
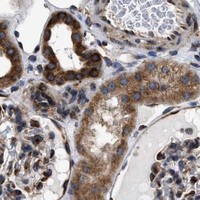


Comprehensive Human Protein Atlas IHC scoring per tissue (reliability: Enhanced — Medium consistency between antibody staining and RNA expression data.). Rows are taken directly from the HPA tissue chart — click any row's HPA link to view the source.
| Tissue | Cell type | Level | Evidence | Source |
|---|---|---|---|---|
| Adrenal gland | Glandular cells | High | Protein (IHC) | HPA → |
| Appendix | Glandular cells | High | Protein (IHC) | HPA → |
| Bone marrow | Hematopoietic cells | High | Protein (IHC) | HPA → |
| Breast | Glandular cells | High | Protein (IHC) | HPA → |
| Bronchus | Respiratory epithelial cells | High | Protein (IHC) | HPA → |
| Tissue | Cell type | Level | Evidence | Source |
|---|---|---|---|---|
| None in HPA: KTN1 is detected in all 45 scored tissues. Use a no-primary (secondary-only) and an isotype control instead. | ||||
These troubleshooting checks center on paraffin-section, chromogenic KTN1 IHC and its expected endoplasmic reticulum staining (UniProt Q86UP2; HPA tissue IHC).
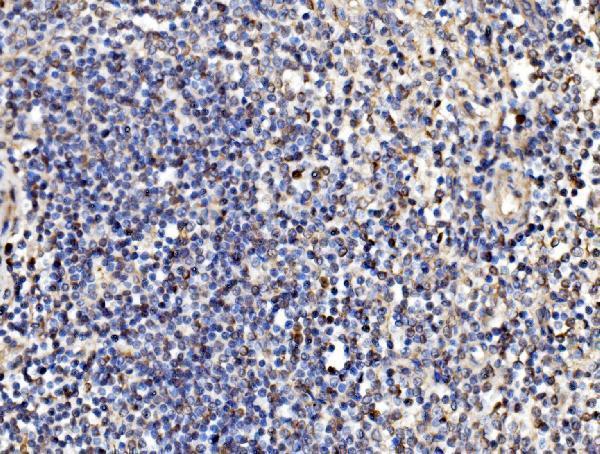
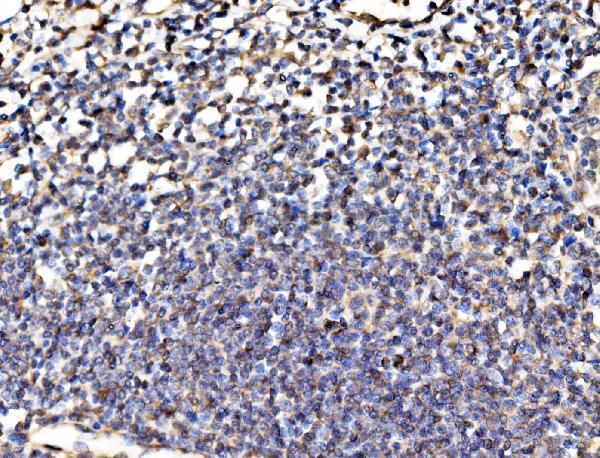
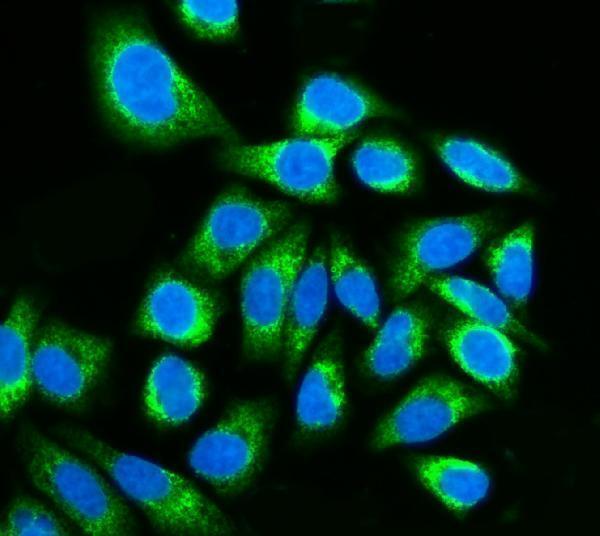
A05071-1 has IHC images from human spleen, tonsil and liver cancer paraffin sections and mouse brain paraffin sections, plus IF data from HEP3B cells (A05071-1 image captions).
A05071-1 was demonstrated by IHC in paraffin sections of human spleen, tonsil and liver cancer and mouse brain (A05071-1 IHC image captions). The same SKU lists IF/ICC and shows IF staining in HEP3B cells (A05071-1 applications and IF image caption).
Which to pick: Choose A05071-1 for tissue IHC: its paraffin-section captions document EDTA retrieval at pH 8.0 and 2 μg/ml primary antibody; the fixative is unreported (A05071-1 IHC image captions). For IF/ICC, A05071-1 lists both applications and shows HEP3B staining at 5 μg/ml with DAPI counterstain (A05071-1 applications and IF image caption). For cross-species work, A05071-1 lists human, mouse, rat and monkey reactivity, but its IHC dilution guidance covers human, mouse and rat; no clone is reported (A05071-1 catalog reactivity, dilution guidance and clone field).