This website uses cookies to ensure you get the best experience on our website.


- Table of Contents
Plan chromogenic LPCAT2 IHC on paraffin sections using thyroid glandular cells as a strong positive reference (HPA tissue IHC). Compare cytoplasmic staining with bronchial respiratory epithelium, where staining was not detected (HPA tissue IHC), and start the IHC-validated antibody at 2 μg/ml (datasheet A07471-2).

Expected localisation, validated protocols, controls and antibodies — the at-a-glance facts below, then the full design guide.
| Expected localisation | Cytoplasmic tissue staining (HPA tissue IHC) | |
| Staining pattern | Strong cytoplasmic staining in thyroid glandular cells (HPA tissue IHC) | |
| Antigen retrieval | EDTA pH 8.0 HIER, heat-mediated (datasheet A07471-2) | |
| Positive control | Epididymis+4 more · see all | |
| Negative control | Bronchus+4 more · see all |
| Fixation | Keep fixation conditions consistent across sections (standard IHC practice; not target-specific) | |
| Caveat | Lung macrophages may confound epithelial scoring (HPA tissue IHC) | |
| Regulation | Staining regulation unreported (UniProt) | |
| Isoform / epitope | 2 isoforms; no extracellular domain; epitope unspecified (UniProt) |
The catalog antibody's IHC-P protocol uses heat-mediated EDTA retrieval (datasheet A07471-2). Published LPCAT2 IHC protocols cover colorectal metastases, frozen sections, and spinal cord (PMC5778070; PMC5396354; PMC5471516).
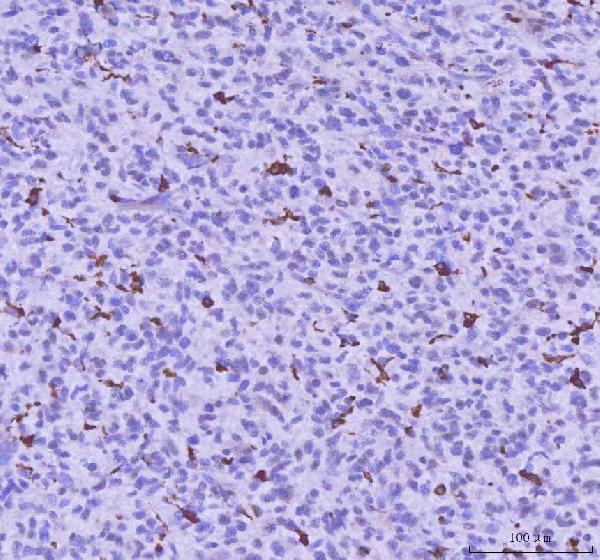
| Sample | Paraffin-embedded human glioma tissue; fixative not specified (datasheet A07471-2) |
| Fixation | Image fixative and duration unreported (datasheet A07471-2); verify before use. |
| Sectioning | 4–5 µm sections on charged slides (standard) |
| Deparaffinisation | Xylene, graded ethanol series to water (standard) |
| Antigen retrieval | Heat retrieval: EDTA pH 8.0 (datasheet A07471-2); 20 min, 95–100 °C (standard) |
| Peroxidase block | 3% H2O2, 10 min, room temperature (standard) |
| Blocking | 10% goat serum (datasheet A07471-2) |
| Primary antibody | Rabbit anti-LPCAT2, 2-5 μg/ml (datasheet A07471-2) |
| Primary incubation | Overnight at 4 °C (datasheet A07471-2) |
| Detection | HRP-conjugated secondary, DAB chromogen (datasheet A07471-2) |
| Counterstain | Hematoxylin, blue, dehydrate and mount (standard) |
| Expected result | LPCAT2-positive staining in glandular cells of epididymis (HPA tissue IHC: High). HPA tissue profile: Cytoplasmic expression in several different tissues, highest in thyroid gland. No signal in the no-primary control. |
LPCAT2 is an ER, Golgi and cell-membrane protein also associated with lipid droplets; it has one transmembrane segment, residues 58–78 (UniProt Q7L5N7 topology and subcellular location). In tissue IHC, expect mainly cytoplasmic staining, especially in thyroid and epididymal glandular cells (HPA tissue IHC: High). HPA rates the tissue profile Enhanced, with medium agreement between staining and RNA data and external verification pending (HPA tissue IHC: reliability).
| Cytoplasmic staining is strong in thyroid or epididymal glandular cells; nuclei remain distinct. | This matches HPA's highest listed glandular-cell staining and cytoplasmic tissue profile (HPA tissue IHC: High; profile). At chromogenic IHC resolution, an ER-associated signal may appear broadly cytoplasmic rather than resolve into individual organelles (UniProt Q7L5N7: ER membrane; standard IHC interpretation). |
| Signal is predominantly nuclear, with little convincing cytoplasmic staining in the same cells. | A nuclear-only pattern conflicts with the reported membrane and lipid-droplet locations (UniProt Q7L5N7 subcellular location; HPA subcellular: ER and lipid droplets). Treat it as suspect; compare the positive tissue and a no-primary control before scoring it as LPCAT2. |
| Strong staining appears in cells HPA lists as undetected, such as bronchial respiratory epithelium. | HPA reports LPCAT2 as not detected in those cells (HPA tissue IHC: bronchus). Cross-reactivity or detection-system activity is possible, but this comparison alone does not prove either cause; check the cell identity, control slide and detection controls. |
| Color is spread across extracellular spaces or many unrelated cell types without clear cell boundaries. | That distribution is difficult to reconcile with HPA's cell-specific cytoplasmic profile (HPA tissue IHC: profile). Consider background from the staining workflow, then assess a no-primary control and repeat with appropriate blocking and washes (standard IHC practice). |
| Thyroid glandular cells show no signal in an otherwise interpretable section. | This is discordant with HPA's High thyroid glandular-cell staining (HPA tissue IHC: thyroid gland). First confirm that the section contains intact glandular cells; then review antibody dilution, retrieval, detection and positive-control performance (standard paraffin IHC practice). |
| Compartment and topology | LPCAT2 has a transmembrane segment at 58–78, with residues 1–57 cytoplasmic and 79–544 lumenal (UniProt Q7L5N7 topology). These annotations help assess localisation; they do not identify the antibody's epitope or predict retrieval needs. |
| Choice of tissue reference | Thyroid and epididymal glandular cells are listed as High; bone-marrow hematopoietic cells and lung macrophages are Medium (HPA tissue IHC). A weaker signal in a Medium group need not match the intensity of a High glandular control. |
| Strength of the staining reference | HPA calls the tissue profile Enhanced, while reporting medium staining–RNA consistency and pending external verification (HPA tissue IHC: reliability). HPA007891 is IHC Enhanced; HPA008433 is IHC Supported (HPA antibodies). Treat a discordant result as a finding to investigate. |
| Isoform coverage | Two LPCAT2 isoforms are listed (UniProt Q7L5N7: isoforms 1 and 2). The supplied record gives no antibody epitope or isoform-specific staining data, so isoform coverage cannot explain a positive or negative section from this evidence alone. |
| Situation | Likely cause | Next action |
|---|---|---|
| No thyroid glandular-cell signal in the positive control. | The result conflicts with the High reference pattern (HPA tissue IHC: thyroid gland); the cause is not established by HPA. | Check section integrity and glandular-cell presence, then verify dilution, antigen retrieval and detection against the catalog antibody's IHC-P instructions (standard paraffin IHC practice). |
| The whole section develops a diffuse chromogenic haze. | Background may reflect blocking, washes or the detection system (standard IHC practice); it is not the cell-specific HPA profile (HPA tissue IHC: profile). | Review a no-primary control, blocking and washes. If enzyme-based detection is used, check the relevant endogenous-activity control (standard IHC practice). |
| Only nuclei stain strongly. | Nuclear-only staining is discordant with the listed ER, other membrane and lipid-droplet locations (UniProt Q7L5N7 subcellular location). | Compare cytoplasm and nuclei in the positive tissue, inspect the no-primary control and avoid scoring nuclear-only color as confirmed LPCAT2. |
| Bronchial respiratory epithelium stains strongly. | That cell population is listed as not detected (HPA tissue IHC: bronchus); cross-reactivity or detection background remains possible. | Verify the stained cell type and compare a no-primary control with a thyroid or epididymal glandular positive control (HPA tissue IHC: High). |
| Bone marrow or lung appears weaker than thyroid. | HPA lists bone-marrow hematopoietic cells and lung macrophages as Medium, versus High thyroid glandular cells (HPA tissue IHC). | Score each named cell population against its own reference level. Do not require a Medium population to match a High control (HPA tissue IHC). |
| IF/ICC Q&A: What pattern would support the IHC localisation? | HPA places LPCAT2 mainly in the ER, with additional lipid-droplet localisation in ICC-IF (HPA subcellular: supported). | Look for ER-associated fluorescence with possible lipid-droplet signal in an IF/ICC experiment; interpret that imaging evidence separately from paraffin chromogenic IHC (HPA subcellular; standard microscopy practice). |


Comprehensive Human Protein Atlas IHC scoring per tissue (reliability: Enhanced — Medium consistency between antibody staining and RNA expression data. Pending external verification.). Rows are taken directly from the HPA tissue chart — click any row's HPA link to view the source.
| Tissue | Cell type | Level | Evidence | Source |
|---|---|---|---|---|
| Epididymis | Glandular cells | High | Protein (IHC) | HPA → |
| Thyroid gland | Glandular cells | High | Protein (IHC) | HPA → |
| Bone marrow | Hematopoietic cells | Medium | Protein (IHC) | HPA → |
| Cerebral cortex | Neuronal cells | Medium | Protein (IHC) | HPA → |
| Duodenum | Endocrine cells | Medium | Protein (IHC) | HPA → |
| Tissue | Cell type | Level | Evidence | Source |
|---|---|---|---|---|
| Bronchus | Respiratory epithelial cells | Not detected | Protein (IHC) | HPA → |
| Cervix | Glandular cells | Not detected | Protein (IHC) | HPA → |
| Esophagus | Squamous epithelial cells | Not detected | Protein (IHC) | HPA → |
| Fallopian tube | Glandular cells | Not detected | Protein (IHC) | HPA → |
| Kidney | Cells in glomeruli | Not detected | Protein (IHC) | HPA → |
Troubleshoot LPCAT2 staining in paraffin sections by checking retrieval, cell identity, subcellular pattern, and matched controls before interpreting chromogenic signal.
Both catalog antibodies have human paraffin-section IHC images (catalog image captions) and list Human, Mouse, and Rat reactivity (catalog applications/reactivity); neither provides IF images or an IF dilution (catalog IF fields).
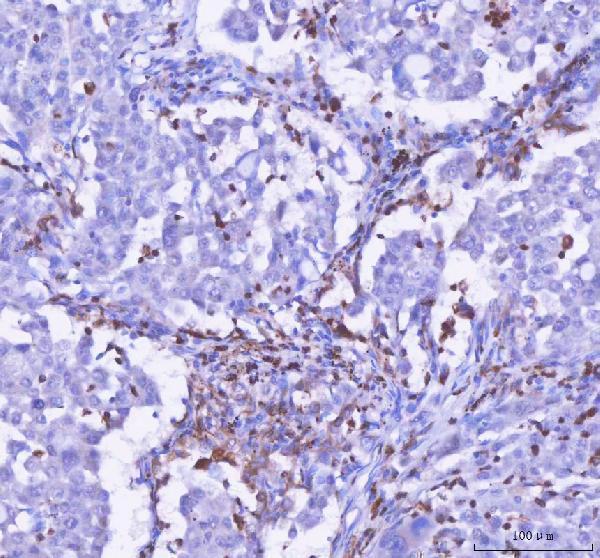
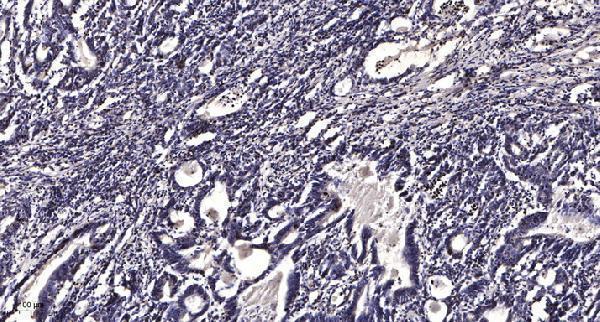
A07471-2 shows chromogenic IHC in paraffin-embedded human glioma and lung cancer sections (A07471-2 image captions); its catalog lists IHC for Human and general reactivity with Human, Mouse, and Rat (A07471-2 catalog). A07471-1 shows IHC in a paraffin-embedded human gastric adenocarcinoma section (A07471-1 image caption) and lists IHC plus Human, Mouse, and Rat reactivity (A07471-1 catalog).
Which to pick: For tissue IHC, choose A07471-2 when its documented EDTA pH 8.0 retrieval and 2 μg/ml primary incubation suit the study (A07471-2 image caption); A07471-1 provides a separate paraffin-section example using Tris-EDTA pH 9.0 and a 1:200 primary dilution (A07471-1 image caption). Neither SKU lists IF/ICC or provides an IF image or dilution, so neither has catalog-supported IF/ICC conditions (catalog applications/IF fields). For cross-species planning, both list Human, Mouse, and Rat reactivity (catalog reactivity), but the supplied IHC images show human tissue only (image captions); A07471-1 is polyclonal (A07471-1 dilution data), A07471-2 has no stated clonality (A07471-2 catalog), and neither caption reports the tissue fixative (image captions).