This website uses cookies to ensure you get the best experience on our website.


- Table of Contents
Plan LRRC59 chromogenic IHC in paraffin sections with the catalog antibody's 2–5 μg/ml range (datasheet A09874-2). Use the variable cytoplasmic tissue pattern and high staining in placental decidual cells to choose comparison sections (HPA tissue IHC).

Expected localisation, validated protocols, controls and antibodies — the at-a-glance facts below, then the full design guide.
| Expected localisation | Variable cytoplasmic staining in most tissues (HPA tissue IHC) | |
| Staining pattern | Cytoplasmic staining of varying intensity (HPA tissue IHC) | |
| Antigen retrieval | EDTA pH 8.0 HIER, heat-mediated (datasheet A09874-2) | |
| Positive control | Appendix+4 more · see all | |
| Negative control | Adipose tissue+4 more · see all |
| Fixation | Keep fixation consistent across sections (standard IHC practice; not target-specific) | |
| Caveat | Staining and RNA show medium consistency (HPA tissue IHC) | |
| Regulation | No expression regulator specified (UniProt) | |
| Isoform / epitope | No isoforms; N-terminus processed; cytosolic vs lumenal epitopes (UniProt) |
The catalog antibody IHC-P protocol (datasheet: A09874-2) is accompanied by one published colorectal IHC protocol (PMC12576520).
| Sample | Paraffin-embedded human colorectal adenocarcinoma tissue; fixative not specified (datasheet A09874-2) |
| Fixation | Image fixative and duration unreported (datasheet A09874-2); verify before use. |
| Sectioning | 4–5 µm sections on charged slides (standard) |
| Deparaffinisation | Xylene, graded ethanol series to water (standard) |
| Antigen retrieval | Heat retrieval: EDTA pH 8.0 (datasheet A09874-2); 20 min, 95–100 °C (standard) |
| Peroxidase block | 3% H2O2, 10 min, room temperature (standard) |
| Blocking | 10% goat serum (datasheet A09874-2) |
| Primary antibody | Rabbit anti-LRRC59, 2-5 μg/ml (datasheet A09874-2) |
| Primary incubation | Overnight at 4 °C (datasheet A09874-2) |
| Detection | HRP-conjugated secondary, DAB chromogen (datasheet A09874-2) |
| Counterstain | Hematoxylin, blue, dehydrate and mount (standard) |
| Expected result | LRRC59-positive staining in glandular cells of appendix (HPA tissue IHC: High). HPA tissue profile: Cytoplasmic expression of varying intensity in most tissues. No signal in the no-primary control. |
LRRC59 should appear mainly as cytoplasmic staining of varying intensity across most tissues, with strong staining in selected glandular, neuronal, exocrine glandular, and decidual cells (HPA tissue IHC: Enhanced; medium consistency with RNA). Its endoplasmic reticulum and nuclear envelope localization is consistent with a membrane-associated cytoplasmic pattern (UniProt Q96AG4 localization; transmembrane segment 245–265). Interpret tissue staining against the named cell types, not an entire section’s average intensity.
| Cytoplasmic staining in appendix or duodenal glandular cells, pancreatic exocrine glandular cells, or cortical neurons. | This fits the reported High cell-specific IHC pattern (HPA tissue IHC). Evaluate the named cells within each section; HPA reports varying cytoplasmic intensity across most tissues, so uniform intensity across every cell is not the expected benchmark (HPA tissue IHC). |
| Predominantly nuclear staining, or an isolated plasma-membrane outline, with little cytoplasmic signal. | Treat this as a compartment mismatch and investigate artefact before assigning it to LRRC59. HPA reports cytoplasmic tissue staining and endoplasmic reticulum localization by ICC-IF; UniProt also lists the nuclear envelope, which does not establish diffuse nuclear staining (HPA tissue IHC; HPA subcellular; UniProt Q96AG4 localization). |
| Strong staining in adipocytes, ovarian stromal cells, skeletal myocytes, or smooth muscle cells. | These named populations were not detected in HPA tissue IHC. Check the cell identification and controls, then consider antibody cross-reactivity or endogenous chromogen-generating activity as general IHC explanations. An unexpected positive cell alone does not identify which explanation applies (HPA tissue IHC; general IHC practice). |
| Broad, hazy chromogen deposition that obscures cell boundaries or appears across unrelated compartments. | This is difficult to score as cell-specific LRRC59 staining against HPA’s cytoplasmic pattern. Assess a no-primary control and review blocking, washing, and detection conditions for nonspecific background; those checks are general IHC practice and do not imply a documented LRRC59-specific reagent effect (HPA tissue IHC; general IHC practice). |
| No visible signal in a reported High population, such as appendix glandular cells or pancreatic exocrine glandular cells. | First verify that the named cells are present and that the positive control and detection steps worked (HPA tissue IHC; general IHC practice). A blank section may reflect a technical failure, but HPA’s Enhanced tissue reliability has only medium consistency with RNA, so its staining category is a reference pattern rather than a guarantee for every specimen (HPA tissue IHC). |
| Cell type and tissue selection | LRRC59 is widely expressed (UniProt Q96AG4 tissue specificity), but HPA reports variable cytoplasmic IHC intensity. Use a named High population for a positive reference and interpret an undetected population by cell type; neither label describes every cell in that tissue (HPA tissue IHC). |
| Membrane topology and subcellular interpretation | UniProt places residues 1–244 on the cytoplasmic side, a transmembrane segment at 245–265, and residues 266–307 in the lumen (UniProt Q96AG4 topology). These annotations support a membrane-associated pattern, but the supplied evidence gives no antibody epitope location, so topology cannot predict retrieval conditions or epitope accessibility. |
| Antibody validation and limits | HPA lists IHC validation as Enhanced for both HPA030827 and HPA030829; its tissue profile has medium consistency between staining and RNA (HPA antibodies; HPA tissue IHC). This supports comparison with the reported pattern while leaving an unexpected cell or compartment to be checked with controls. |
| IF/ICC: where should LRRC59 appear? | For the separate IF/ICC guide, expect endoplasmic reticulum localization: HPA calls it the enhanced main location and provides images from A-431, U-251MG, and U2OS (HPA subcellular). UniProt also lists the nuclear envelope, whose localization depends on nuclear import machinery including KPNB1 (UniProt Q96AG4 localization). |
| Situation | Likely cause | Next action |
|---|---|---|
| Reported High cells are blank. | The target cell population may be absent from the examined area, or staining and detection may have failed (HPA tissue IHC; general IHC practice). | Confirm the named cell type in the section, inspect a positive-control section, and review the validated IHC workflow’s retrieval, primary incubation, detection, and counterstain steps (general IHC practice). |
| Nuclei dominate the stain. | This conflicts with the reported cytoplasmic IHC pattern; UniProt’s nuclear-envelope annotation does not justify diffuse nuclear staining (HPA tissue IHC; UniProt Q96AG4 localization). | Compare signal with a no-primary control and inspect whether staining tracks the nuclear rim or the whole nucleus; review blocking and detection if control staining persists (general IHC practice). |
| Adipocytes or myocytes stain strongly. | HPA records adipocytes and skeletal and smooth muscle cells as not detected; cross-reactivity or endogenous detection activity is possible (HPA tissue IHC; general IHC practice). | Verify cell identity, compare a no-primary control, and assess endogenous detection activity with controls suited to the chromogenic system (general IHC practice). |
| Background covers both target cells and surrounding tissue. | Nonspecific binding or detection background can obscure the reported cytoplasmic pattern (HPA tissue IHC; general IHC practice). | Check the no-primary control, then review blocking, washes, antibody concentration, and detection conditions as general IHC variables; do not infer LRRC59-specific fixation sensitivity from this pattern. |
| A section shows weak staining where strong staining was expected. | HPA’s High designation applies to specified cell populations, and its Enhanced tissue profile has medium consistency with RNA (HPA tissue IHC). | Score the named cells separately from surrounding tissue and compare a reported High control section processed in the same run (HPA tissue IHC; general IHC practice). |
| A proposed IF pattern disagrees with the IHC slide. | HPA’s ICC-IF result emphasizes the endoplasmic reticulum, while tissue IHC reports cytoplasmic staining; the methods resolve compartments differently (HPA subcellular; HPA tissue IHC; general microscopy practice). | Interpret each result within its own method: assess cytoplasmic cell staining in IHC and endoplasmic reticulum localization on the separate IF/ICC guide (HPA tissue IHC; HPA subcellular). |


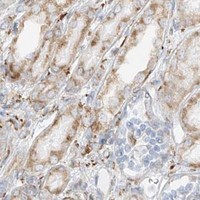


Comprehensive Human Protein Atlas IHC scoring per tissue (reliability: Enhanced — Medium consistency between antibody staining and RNA expression data.). Rows are taken directly from the HPA tissue chart — click any row's HPA link to view the source.
| Tissue | Cell type | Level | Evidence | Source |
|---|---|---|---|---|
| Appendix | Glandular cells | High | Protein (IHC) | HPA → |
| Cerebral cortex | Neuronal cells | High | Protein (IHC) | HPA → |
| Duodenum | Glandular cells | High | Protein (IHC) | HPA → |
| Endometrium | Glandular cells | High | Protein (IHC) | HPA → |
| Hippocampus | Neuronal cells | High | Protein (IHC) | HPA → |
| Tissue | Cell type | Level | Evidence | Source |
|---|---|---|---|---|
| Adipose tissue | Adipocytes | Not detected | Protein (IHC) | HPA → |
| Breast | Adipocytes | Not detected | Protein (IHC) | HPA → |
| Ovary | Ovarian stroma cells | Not detected | Protein (IHC) | HPA → |
| Skeletal muscle | Myocytes | Not detected | Protein (IHC) | HPA → |
| Smooth muscle | Smooth muscle cells | Not detected | Protein (IHC) | HPA → |
Troubleshoot chromogenic LRRC59 staining in paraffin sections using the catalog antibody’s tissue image, expected localisation, and reported tissue patterns (datasheet A09874-2; UniProt Q96AG4; HPA).
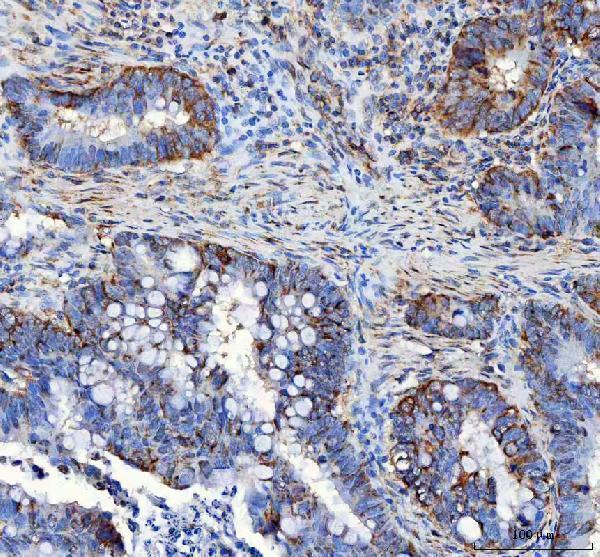
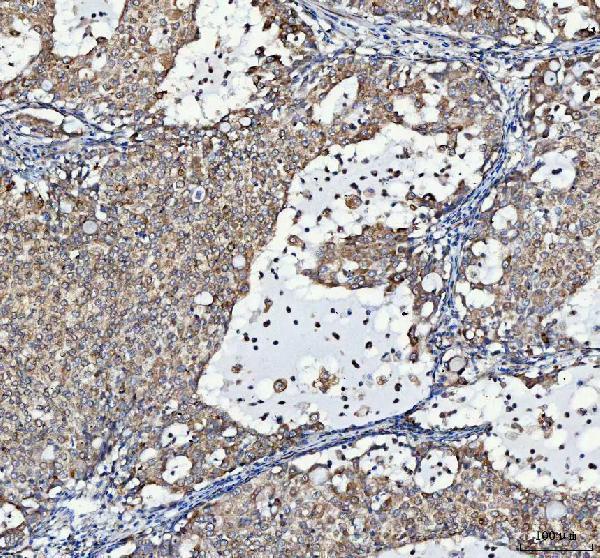
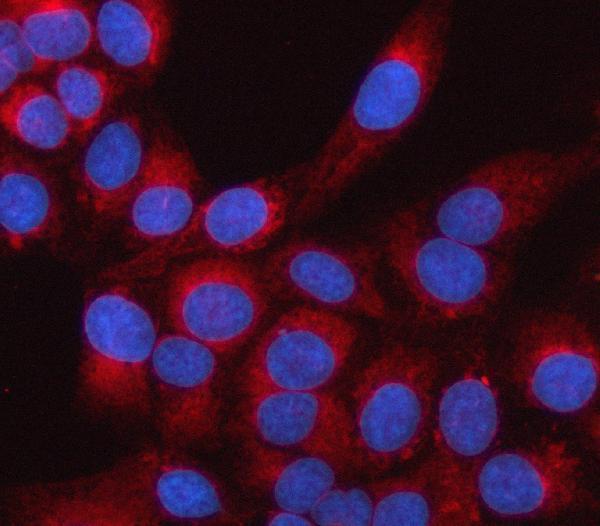
A09874-2 has IHC images from human colorectal adenocarcinoma, lung cancer, placenta, and mouse colon paraffin sections, plus IF data from U2OS cells (catalog image captions).
A09874-2 is listed for IHC in Human, Mouse, and Rat; its IHC captions document human colorectal adenocarcinoma, lung cancer, placenta, and mouse colon paraffin sections (catalog applications, reactivity, and IHC image captions). The same SKU is listed for ICC/IF and has a U2OS cell IF image (catalog applications and IF image caption).
Which to pick: For tissue IHC, choose A09874-2: its own paraffin-section captions document EDTA retrieval at pH 8.0 and 2 μg/ml primary antibody; the fixative is unreported (catalog IHC image captions). For IF/ICC, A09874-2 has a U2OS cell IF image using 5 μg/ml primary antibody (catalog IF image caption). For work across species, A09874-2 lists Human, Mouse, and Rat reactivity, while its IHC images document Human and Mouse samples; clonality is unreported (catalog reactivity, IHC image captions, and clone field).