This website uses cookies to ensure you get the best experience on our website.


- Table of Contents
Plan chromogenic MFSD1 IHC in paraffin sections using 10 μg/mL as a starting antibody concentration (datasheet). Assess cytoplasmic staining in immune-cell subsets (HPA tissue IHC), while treating lysosomal membrane localization as a molecular expectation (UniProt).

Expected localisation, validated protocols, controls and antibodies — the at-a-glance facts below, then the full design guide.
| Expected localisation | Cytoplasmic staining in immune-cell subsets (HPA tissue IHC) | |
| Staining pattern | Cytoplasmic staining in subsets of immune cells (HPA tissue IHC) | |
| Antigen retrieval | Citrate pH 6.0 HIER, 95–98 °C, 20 min (rule: cytoplasmic / membrane antigen) | |
| Positive control | Appendix+4 more · see all | |
| Negative control | Adipose tissue+4 more · see all |
| Fixation | Keep fixation consistent across sections (standard IHC practice; not target-specific) | |
| Caveat | Catalog antibody IHC validated in rat, not human (datasheet) | |
| Regulation | No expression regulator annotated (UniProt) | |
| Isoform / epitope | 6 isoforms (UniProt); epitope unmapped (datasheet) |
The catalog antibody’s IHC-P protocol is accompanied by one published chromogenic MFSD1 protocol using free-floating mouse brain sections (PMC5321710).
| Sample | Tissue sections; selected-image fixative not specified (standard IHC workflow) |
| Fixation | Image fixative and duration unreported (datasheet A17695); verify before use. |
| Sectioning | 4–5 µm sections on charged slides (standard) |
| Deparaffinisation | Xylene, graded ethanol series to water (standard) |
| Antigen retrieval | Heat-induced epitope retrieval in citrate buffer, pH 6.0, 20 min at 95–98 °C (standard rule: cytoplasmic / membrane antigen) |
| Peroxidase block | 3% H2O2, 10 min, room temperature (standard) |
| Blocking | 10% normal serum of the secondary host, 30 min, room temperature (standard) |
| Primary antibody | Rabbit anti-MFSD1, 10 μg/mL (datasheet A17695) |
| Primary incubation | Overnight at 4 °C (standard) |
| Detection | HRP-polymer secondary, DAB chromogen 5–10 min (standard) |
| Counterstain | Hematoxylin, blue, dehydrate and mount (standard) |
| Expected result | MFSD1-positive staining in lymphoid tissue of appendix (HPA tissue IHC: High). HPA tissue profile: Cytoplasmic expression mainly in subsets of immune cells in most tissues. No signal in the no-primary control. |
MFSD1 is a lysosomal membrane transporter with 12 transmembrane segments (UniProt Q9H3U5 topology). In tissue IHC, expect cytoplasmic staining mainly in subsets of immune cells, with high staining also reported in specific ciliated, decidual and Leydig cells (HPA tissue IHC). HPA rates its tissue IHC profile Approved, with medium consistency between antibody staining and RNA expression (HPA tissue IHC).
| Cytoplasmic signal appears in selected immune cells; germinal center cells stain strongly. | This fits the reported tissue profile and High staining in lymph node and tonsil germinal center cells (HPA tissue IHC). Score the named cell population, since an unstained neighboring cell does not invalidate a positive result in a mixed tissue. |
| Strong nuclear staining dominates the section. | A nuclear dominant pattern conflicts with the lysosomal membrane annotation and the reported cytoplasmic tissue IHC pattern (UniProt Q9H3U5; HPA tissue IHC). Treat it as suspect; compare the control tissue, detection only control and nuclear counterstain before assigning MFSD1 positivity. |
| Strong staining appears in a cell population reported as Not detected. | For example, HPA reports adipocytes as Not detected (HPA tissue IHC). Reproducible staining there warrants a specificity check, including omission of primary antibody to assess detection background. An HPA Not detected call is a reference observation, not proof that every specimen must be negative. |
| Color spreads across stroma, empty spaces or many unrelated cell types. | That distribution is difficult to reconcile with HPA’s selective tissue profile (HPA tissue IHC). Review the detection only control for endogenous enzyme activity or nonspecific reagent binding; compare staining with cellular morphology before scoring any diffuse color as MFSD1. |
| A known positive tissue shows no convincing cellular signal. | Check a documented High population, such as tonsil germinal center cells or testis Leydig cells (HPA tissue IHC). Confirm the expected cells are present, then review antigen retrieval, primary antibody application and chromogen development as general IHC workflow checks. One negative section does not establish absent MFSD1. |
| Membrane topology | MFSD1 has 12 transmembrane segments and is annotated at the lysosome membrane (UniProt Q9H3U5 topology and subcellular location). Interpret chromogenic tissue staining at the cellular, cytoplasmic level; the supplied sources do not establish a target specific retrieval condition or predict a resolvable lysosomal pattern on every section. |
| Cell population within the tissue | HPA reports cytoplasmic expression mainly in subsets of immune cells, alongside High staining in specified ciliated, decidual and Leydig populations (HPA tissue IHC). Choose and score the documented population rather than averaging staining across an entire tissue or treating adjacent unstained cells as assay failure. |
| Evidence strength | HPA calls the tissue IHC profile Approved but describes medium consistency with RNA expression (HPA tissue IHC). Its listed High and Not detected calls guide control selection; they do not by themselves verify the identity of every positive cell or establish a universal negative tissue. |
| Assay dependent localisation | HPA reports mainly plasma membrane, with additional cytosol, in ICC-IF (HPA subcellular ICC-IF), while UniProt places MFSD1 at the lysosome membrane (UniProt Q9H3U5). That ICC-IF observation belongs to the separate IF/ICC guide; do not use it as the required chromogenic tissue IHC pattern. |
| Isoform and epitope information | UniProt lists 6 isoforms (UniProt Q9H3U5). The supplied evidence gives no antibody epitope or isoform specific staining result, so isoform coverage cannot be inferred. Avoid explaining an unexpected positive or negative cell solely through alternative splicing. |
| Situation | Likely cause | Next action |
|---|---|---|
| Tonsil germinal center cells are unstained. | The expected High population may be absent from the examined area, or an IHC workflow step may have failed (HPA tissue IHC; general IHC practice). | Locate germinal centers on the counterstained section; then check retrieval, primary incubation and detection against the assay’s established controls. Do not infer MFSD1 absence until the expected cells and assay performance are verified. |
| Adipocytes stain as strongly as the positive control. | This disagrees with HPA’s Not detected call for adipocytes; nonspecific binding or detection background is possible (HPA tissue IHC; general IHC practice). | Compare the same cell type across sections, inspect morphology and run a detection only control. Record the disagreement as unresolved if staining persists; HPA’s reference call alone cannot identify the cause. |
| Most of the section has a faint, even tint. | Diffuse tint can arise from chromogenic detection background rather than the selective cytoplasmic profile reported for MFSD1 (general IHC practice; HPA tissue IHC). | Inspect a detection only control and review blocking, washing and chromogen development under the assay’s standard procedure. Score distinct cellular signal separately from the overall tint. |
| Only nuclei appear strongly positive. | A nuclear dominant result conflicts with UniProt’s lysosome membrane location and HPA’s cytoplasmic tissue profile (UniProt Q9H3U5; HPA tissue IHC). | Compare with the nuclear counterstain and a documented High tissue population; check a detection only control before calling the nuclear signal specific. |
| A bronchus section has signal near cilia but little signal elsewhere. | HPA reports High staining in bronchial ciliated cells at ciliary rootlets; a restricted pattern can therefore be expected (HPA tissue IHC). | Confirm ciliated cell morphology and score that compartment specifically. Avoid treating weak staining in unrelated neighboring cells as a failed run when the documented population stains. |
| An ICC-IF image looks membrane associated while tissue IHC looks cytoplasmic. | Those descriptions come from different HPA assays; ICC-IF lists plasma membrane and cytosol, while tissue IHC reports a cytoplasmic profile (HPA subcellular ICC-IF; HPA tissue IHC). | Assess the paraffin section against tissue IHC controls and cell morphology. Use the separate IF/ICC guide for fluorescence localisation; the difference alone does not establish a failed IHC run. |


Comprehensive Human Protein Atlas IHC scoring per tissue (reliability: Approved — Medium consistency between antibody staining and RNA expression data.). Rows are taken directly from the HPA tissue chart — click any row's HPA link to view the source.
| Tissue | Cell type | Level | Evidence | Source |
|---|---|---|---|---|
| Appendix | Lymphoid tissue | High | Protein (IHC) | HPA → |
| Bronchus | Ciliated cells (ciliary rootlets) | High | Protein (IHC) | HPA → |
| Fallopian tube | Ciliated cells (ciliary rootlets) | High | Protein (IHC) | HPA → |
| Lymph node | Germinal center cells | High | Protein (IHC) | HPA → |
| Nasopharynx | Ciliated cells (ciliary rootlets) | High | Protein (IHC) | HPA → |
| Tissue | Cell type | Level | Evidence | Source |
|---|---|---|---|---|
| Adipose tissue | Adipocytes | Not detected | Protein (IHC) | HPA → |
| Caudate | Glial cells | Not detected | Protein (IHC) | HPA → |
| Cerebellum | Cells in granular layer | Not detected | Protein (IHC) | HPA → |
| Cerebral cortex | Endothelial cells | Not detected | Protein (IHC) | HPA → |
| Cervix | Glandular cells | Not detected | Protein (IHC) | HPA → |
Troubleshoot MFSD1 chromogenic IHC in paraffin sections by checking retrieval, controls, cell identity and compartment before interpreting staining intensity.
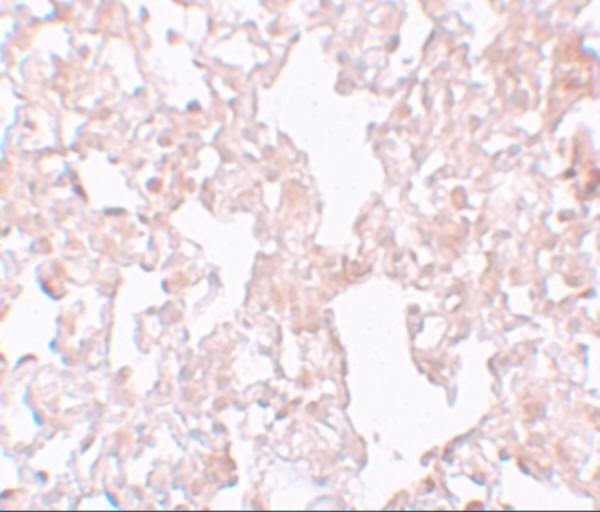
A17695 has a rat lung IHC image; its catalog lists human, mouse, and rat reactivity (image caption; catalog reactivity). No IF image is provided (catalog IF image alts).
A17695 is listed for IHC-P, with a rat lung IHC image at 10 μg/mL (catalog applications; image caption). Human, mouse, and rat reactivity are listed, while the pictured IHC result is from rat tissue (catalog reactivity; image caption).
Which to pick: Choose A17695 for paraffin-section tissue IHC: IHC-P is listed, and its own image caption shows rat lung IHC at 10 μg/mL; the fixative is unreported (catalog applications; image caption). No listed SKU has IF/ICC in its applications or an IF image, so the catalog does not support an IF/ICC recommendation (catalog applications; IF image alts). For cross-species IHC, A17695 lists human, mouse, and rat reactivity, though pictured IHC evidence covers rat lung only; clonality is unreported (catalog reactivity; image caption; clone field).